Abstract
Introduction
Cardiac tissue can be entrained when subjected to sinusoidal stimuli, often responding with action potentials sustained for the duration of the stimulus. To investigate mechanisms responsible for both entrainment and extended action potential duration, computer simulations of a two-dimensional grid of cardiac cells subjected to sinusoidal extracellular stimulation were performed.
Methods and Results
The tissue is represented as a bidomain with unequal anisotropy ratios. Cardiac membrane dynamics are governed by a modified Beeler-Reuter model. The stimulus, delivered by a bipolar electrode, has a duration of 750 to 1,000 msec, an amplitude range of 800 to 3,200 μA/cm, and a frequency range of 10 to 60 Hz. The applied stimuli create virtual electrode polarization (VEP) throughout the sheet. The simulations demonstrate that periodic extracellular stimulation results in entrainment of the tissue. This phase-locking of the membrane potential to the stimulus is dependent on the location in the sheet and the magnitude of the stimulus. Near the electrodes, the oscillations are 1:1 or 1:2 phase-locked; at the middle of the sheet, the oscillations are 1:2 or 1:4 phase-locked and occur on the extended plateau of an action potential. The 1:2 behavior near the electrodes is due to periodic change in the voltage gradient between VEP of opposite polarity; at the middle of the sheet, it is due to spread of electrotonic current following the collision of a propagating wave with refractory tissue.
Conclusion
The simulations suggest that formation of VEP in cardiac tissue subjected to periodic extracellular stimulation is of paramount importance to tissue entrainment and formation of an extended oscillatory action potential plateau.
Keywords: defibrillation, AC stimulation, entrainment, action potential duration, computer simulation, virtual electrode polarization
Introduction
The life-threatening loss of cardiac output caused by ventricular fibrillation (VF) is treated by the timely delivery of strong electrical shocks to the heart, termed electrical defibrillation. Despite the widespread use of traditional monophasic and biphasic shocks, there remain many substantial problems with DC defibrillation, such as damage to the heart caused by the strong electric current (electroporation), uncertainty of success, necessity of stronger shocks following an initial failed shock, and cost of producing a DC defibrillation device. Further, DC shock waveforms are based on estimations of whole-heart membrane time constants1 and the hardware design of defibrillators2 and not on the underlying mechanisms of fibrillation and defibrillation. Presumably, a waveform based on a mechanistic understanding of fibrillation, including wave dynamics in the heart, may lead to improved methods of defibrillation.
Previous research has examined alternating current (AC) field stimulation as a means of defibrillation.3–10 The 60-Hz AC waveforms were used clinically to defibrillate until the early 1960s. Use of this mode of defibrillation waned for a variety of reasons, including high energy requirements, induction of atrial fibrillation, prolonged muscle contraction, risk of shock to the operator, and prohibitive size of the device.11 Recent experiments have developed new interest in the potential of defibrillation via AC field shocks, using the hypothesis that low-frequency periodic waveforms near the dominant frequency of VF (10 Hz) may lower the energy required to defibrillate the heart.12,13 Using intact rabbit hearts, Gray et al.12 demonstrated that AC field stimulation can stop VF. These experiments showed that a periodic field can entrain cardiac tissue both at rest (in diastole) and during VF.12 Often entrainment was associated with the generation of prolonged action potentials (APs), the plateau of which oscillated with the stimulus.
However, the mechanisms underlying AC entrainment and the formation of extended APs are not easily identified. A greater understanding of these phenomena can be gained by examining tissue-field interactions. Our previous study using a computational model of a single cardiac cell showed that AC field stimulation can result in sustained oscillatory plateau of the AP.14 Formation of this prolonged plateau is due to excitation of a portion of the cell by the depolarizing field stimulus and deexcitation of another portion of the cell by the hyperpolarizing stimulus. Deexcitation allows the crucial transmembrane sodium current to reset, permitting the cell to depolarize again when the polarity reverses.14
Although major characteristics of the AP induced by the AC stimulus were reproduced by the single-cell model, additional phenomena documented in whole-heart animal experiments were not.12,13 For example, the cell model displayed oscillations along the plateau of the extended AP entrained only at 1:2 ratio with the oscillating stimulus, whereas in the experiment, 1:1 and 1:4 entrainment also was observed. Consideration of multicellular preparations where the spatial interactions between cells contribute to tissue behavior may be the key to explaining these other modes of entrainment.
To examine AC stimulation of tissue, a model that properly accounts for the distribution of externally applied current between the intracellular and extracellular spaces in the tissue is required; this condition is met by the bidomain model. Recent studies using the bidomain model have been instrumental in understanding the formation of virtual electrode polarization (VEP) patterns.15,16 VEP regions, areas of strong positive and negative membrane polarization adjacent to each other, have been implicated in defibrillation and arrhythmogenesis.17–19 Thus, it is possible that the response of tissue to sinusoidal extracellular stimulation is largely determined by the shock-induced VEP, much like the opposite polarization at cell ends determines the response of a single cell to AC stimulation.14
The goal of this study was to examine sinusoidal stimulation in bidomain tissue in diastole and to understand the mechanisms responsible for entrainment and extended AP duration (APD) at the tissue level. The results of this study can be instrumental in the examination of how AC shocks terminate VF, possibly providing a new avenue for the development of alternative defibrillation therapy.
Methods
To investigate the effects of AC fields upon cardiac tissue, a homogeneous two-dimensional bidomain model with unequal anisotropy ratios is implemented. The governing equations are as follows20:
| (1) |
| (2) |
where Am (cm−1) is the membrane surface-to-volume ratio, Cm (μF/cm2) is the membrane specific capacitance, Vm (mV) is the transmembrane potential, Iion (μA/cm2) is the ionic current density calculated from the membrane kinetics model, Iext (μA/cm3) is the current volume density delivered to the extracellular space, G (mS/cm2) is the voltage-dependent membrane conductance associated with membrane electroporation,21,22 Di and De (mS/cm) are the intracellular and extracellular conductivity tensors, and Φe (mV) is the extracellular potential. In this study, we use a two-dimensional 4 mm × 4 mm sheet; the fibers run vertically, in the y-direction.
Membrane kinetics are represented by the Beeler-Reuter Drouhard Roberge (BRDR) model.23 The equations have been modified further to shorten APD90 to 91 msec and to ensure that the model does not break down under strong fields. These model modifications were described in detail previously.18,22 Further, to increase the physiologic relevance of the model, the effects of shock damage to the tissue, electroporation,24,25 are included in the model.22
To solve the model equations, a finite difference method is used. The two-dimensional sheet is discretized into a square mesh of 1,089 nodes, with a spatial step of 125 μm. Neumann boundary conditions are implemented, i.e., all tissue boundaries are insulated. The numerical procedure was described in detail previously.18,22 In brief, Equation 1 is solved using a predictor-corrector scheme: the predictor step uses an explicit two-step Adams-Bashforth method; the corrector step uses an implicit two-step Adams-Moulton method.22 At each moment in time, Equation 2 is updated and its large sparse nonsymmetric matrix is solved using the iterative approach GMRES.22 Values of the parameters used in this study are given in Table 1. Electroporation parameters are available in a previously published study.22
TABLE 1.
Parameter Values: Material Constants in the Model and the Time and Space Discretization Steps
| Variable Name | Description | Value |
|---|---|---|
| dx | Space step | 0.0125 cm |
| dt | Time step | 0.01 msec |
| dt | Time step at high stimulus frequency | 0.005 msec |
| giy | Intracellular longitudinal conductivity | 3.75 mS/cm |
| gix | Intracellular transverse conductivity | 0.375 mS/cm |
| gey | Extracellular longitudinal conductivity | 3.75 mS/cm |
| gex | Extracellular transverse conductivity | 2.14 mS/cm |
| Am | Surface-to-volume ratio | 0.3 μm−1 |
| Cm | Membrane specific capacitance | 1.0 μF/cm2 |
To apply AC defibrillation to the model, extracellular bipolar point stimulus is used. The two electrode sites are located at the respective centers of the top and bottom boundaries of the sheet: the “anode” is at the bottom of the sheet and the “cathode” is at the top. Similar electrode configurations were used in previous studies of extracellular DC stimulation from our group, thus allowing easy comparisons of results.18,22,26 The electrodes are referred to in quotations to underscore the fact that the sinusoidal stimulus reverses the polarity of the current delivered by each electrode during each cycle; thus, the “anode” at the onset of the stimulus becomes the “cathode” after half of the stimulus period. The stimulus frequency is varied from 10 to 60 Hz, and the amplitude from 800 to 3,200 μA/cm. The duration of the stimulus is chosen within the interval from 750 to 1,000 msec. The shock is delivered to tissue at rest.
Results
Behavior of the Sheet Undergoing Extracellular AC Stimulation
The response of the sheet to sinusoidal field stimulus of 1,600 μA/cm magnitude and 100-msec period is shown in Figure 1. The tissue first reacts by producing a wavefront from the area directly under the cathode at the top of the sheet (panels t = 4, 7 msec). Within 15 msec, the wave propagates across the entire sheet, encountering tissue at rest with the exception of the strongly hyperpolarized tissue under the anode (panels t = 11, 15 msec). The strong hyperpolarization maintained by the external stimulus prevents the propagating wavefront from depolarizing the tissue under the anode. After the initial depolarization of the tissue, the field magnitude continues to increase and reaches its peak magnitude at t = 25 msec. The VEP develops “on top” of the activated tissue; the distinctive symmetric half “dog-bone” pattern of the VEP characteristic of unipolar stimulation of the bidomain model15,16,27 is apparent in panels t = 15, 25 msec. Near the cathode, the shock-induced depolarization serves to raise Vm above the level of the AP plateau as expected; near the anode, the hyperpolarizing influence of the external field acts to repolarize Vm. Similar phenomena take place in the smaller internal regions of depolarization and hyperpolarization. In fact, under the anode, the hyperpolarizing stimulus is so strong that Vm drops below the resting potential Vrest. As the stimulus increases, the areas affected by the positive and negative polarization at the top and bottom of the sheet grow significantly (panels t = 15, 25 msec).
Figure 1.
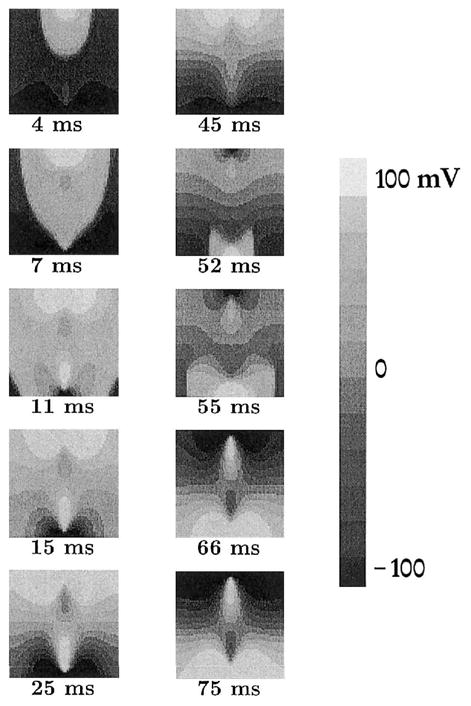
Change in transmembrane potential across the sheet. Panels show maps of Vm; numbers below the panels represent the time at which each map is calculated in relation to the stimulus onset. Field magnitude is 1,600 μA/cm and its period is 100 ms (10 Hz).
The stimulus amplitude begins to drop after it reaches its zenith at t = 25 msec. The top of panel t = 45 msec shows the decreased extent of the strong polarization under the cathode, as compared with panel t = 25 msec. The area of repolarized tissue at the bottom around the anode increases as the tissue continues to repolarize. At t = 50 msec, the stimulus polarity reverses, and the next half-cycle begins. The tissue previously under the hyperpolarizing influence of the “anode” is exposed to the depolarizing “new cathode.” This tissue is activated more easily, because hyperpolarization has increased its excitability.28 A new wavefront propagates outward from the area under the cathode (panels t = 52, 55 msec). Propagation is blocked by the previously depolarized tissue along the middle rows of the sheet, which still are refractory. A new “anode” develops, which repolarizes Vm at the opposite end of the sheet (panels t = 66, 75 msec). As the stimulus changes polarity, the described changes in Vm are repeated.
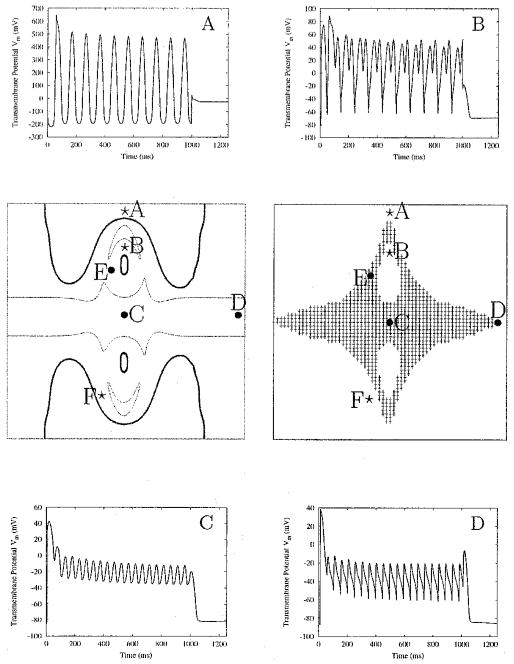
The sinusoidal extracellular stimulus entrains the entire sheet; however, the type of entrainment varies throughout the sheet (Fig. 2). The membrane potential oscillations are the largest under the electrode (site A) and gradually decrease in magnitude toward the center of the sheet (site C). The largest oscillations reach below the resting potential level (panel A). As the magnitude of the oscillations decreases toward the middle of the sheet, the membrane potential gradually takes on the shape of an extended AP with an oscillatory plateau (panel C). Such sustained depolarization typically arises at regions along the borders of the virtual electrodes, i.e., along the edges of the “dog-bone” pattern stemming from the electrode, and along the middle row of the sheet, equidistant from the electrode sites. Areas with the characteristic extended plateau are shown highlighted in Figure 2, right middle panel; the value of −60 mV for the minimum value of the extended plateau is used as a criterion to construct the gray area (since it is close to the sodium threshold). Throughout this region, Vm remains significantly elevated (panels C and D). The APD is extended for 1,000 msec, the full duration of the stimulus.
Figure 2.
AC entrainment of the sheet. In the right middle panel, regions of sustained depolarization are shaded. In the left middle panel, areas within the thick outlines are entrained at 1:1 with the stimulus; areas within the thin outlines exhibit 1:2 entrainment. Time course of the action potentials (APs) at locations noted by circles and stars is displayed in the corner panels. Circles refer to sites with extended AP durations; stars indicate sites of entrainment without an extended AP. APs from points E and F are shown in Figure 3. The stimulus has magnitude of 1,600 μA/cm and a frequency of 10 Hz, and is applied for 1,000 ms.
Figure 2, left middle panel, shows the regions undergoing various types of entrainment. Regions within the thick outline are characterized with 1:1 phase-locking with the stimulus. These are in the vicinity of the stimulus electrodes, or in the very interior of the opposite-polarity virtual electrodes. In these regions, entrainment takes place without extending the AP plateau. Regions within the thin outline represent 1:2 entrainment; that is, two plateau oscillations are produced during one period of the AC waveform. This is similar to behavior seen in single-cell simulations.14 These regions are located in the middle of the sheet (panels C and D), but also around the opposite-polarity virtual electrodes. Outside the described regions, the transmembrane potential traces exhibit variations in the transition from 1:1 to 1:2 phase-locking (Fig. 2, panel B, and Fig. 3).
Figure 3.
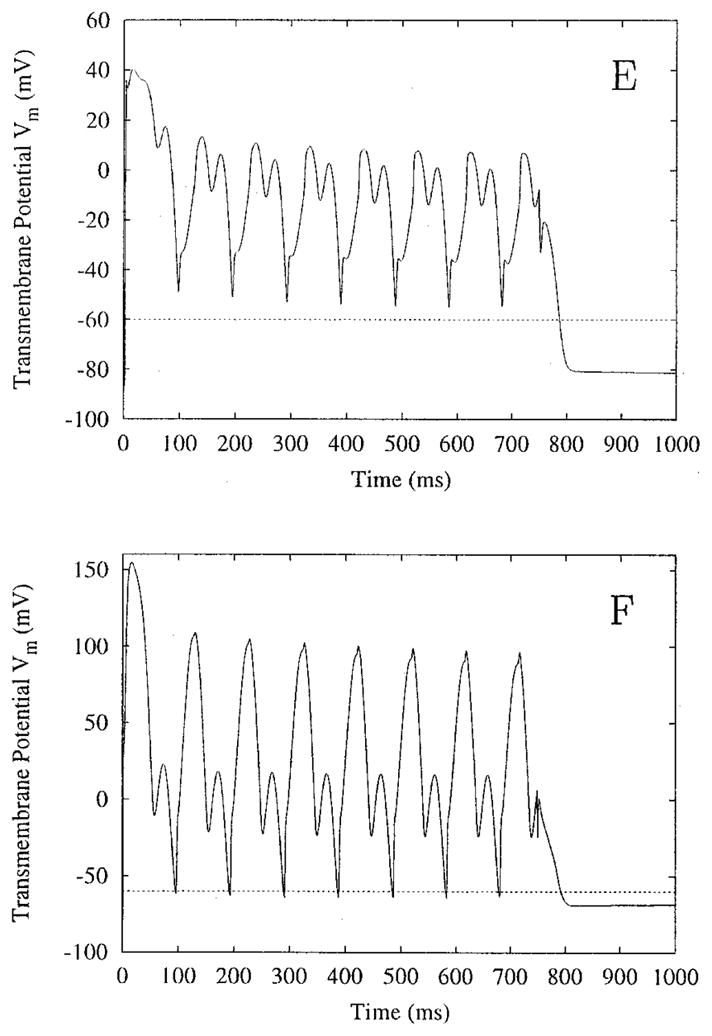
Transmembrane potential versus time, and sites E and F of Figure 2. Site E meets the criterion for sustained plateau, but site F does not. The field has a magnitude of 1,600 μA/cm and a frequency of 10 Hz, and is applied for 750 ms.
Figure 3 shows Vm versus time for points E and F shown in the middle panel of Figure 2 in another simulation (stimulus duration of 750 msec). Point E demonstrates sustained depolarization; point F does not, according to the criterion used here. Figures 2 and 3 demonstrate that there is a gradual change between a true sustained AP plateau (Fig. 2C) and the oscillatory membrane behavior under the electrode (Fig. 2A).
Even within a zone of extended APD, the appearance of plateau oscillations differs according to the location on the sheet (Fig. 2, panels C and D, shown in close-up in Fig. 4). The altered plateau oscillation shapes are due to the differences in the minimum Vm of the oscillations. Vm of the central node (panel C) only drops as low as −35 mV, while Vm of nodes along the sheet border (panel D) falls to −60 mV before depolarizing again. The lower Vm allows the sodium current channel to reset; thus, subsequent depolarization is stronger and more rapid. This results in the sharper upstroke of the plateau oscillation, similar to the initial activation of the node. Because Vm near the center of the sheet does not drop to as low a value, the subsequent rise in Vm is not as fast and has a more sinusoidal appearance.
Figure 4.
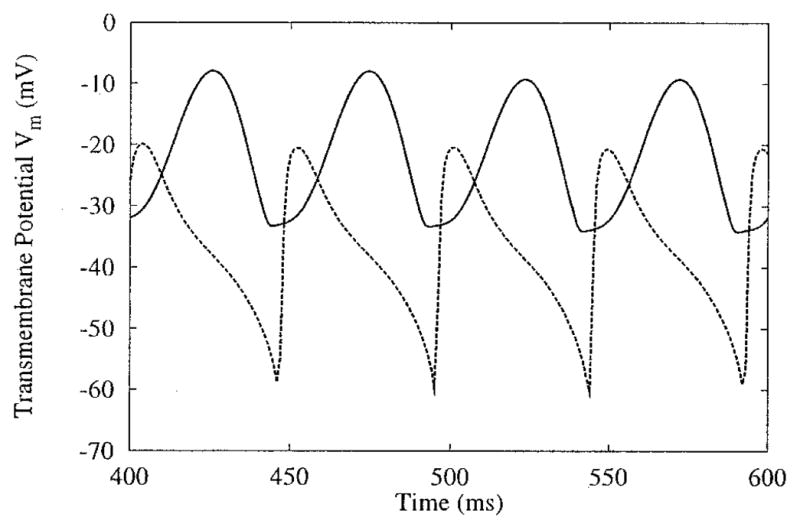
Differences in plateau oscillations across the sheet, and sites C and D of Figure 2. The two sites, one the exact center (C, solid line) and the other near the side border (D, dashed line) of the sheet, demonstrate 1:2 phase-locking. The plateau oscillations near the border display stronger initial depolarization. (See text for details on oscillation shape differences.)
When the stimulus field is terminated, the tissue returns to Vrest. The remaining active wavefronts disperse after encountering either the sheet borders or tissue that still is significantly refractory. There remains a strong depolarization at the boundaries under the electrodes (Vm = 0 mV). This represents the effects of electroporation, the damage to the membrane by the strong electrical shocks.29
Dependence of Sheet Response on Stimulus Amplitude
With the frequency fixed at 10 Hz, the amplitude of the stimulus is varied within the range of 800 to 3,200 μA/cm. The entire sheet remains entrained by the stimulus for all amplitude levels. The extent of the region of long APs and the stimulus amplitude are related. For instance, at site D of Figure 2, depolarization is not sustained at stimulus strengths below 1,600 μA/cm because the outer edges of the region of long APs have shrunk at this stimulus amplitude. However, at 3,200 μA/cm, the region in which depolarization is sustained has grown around the outer edges (Fig. 5, right middle panel), and the APD at site D is extended (Fig. 5, panel D). Within the region of sustained APs, the minimum Vm of the plateau oscillations increases as stimulus amplitude increases (Fig. 5, top row panels).
Figure 5.
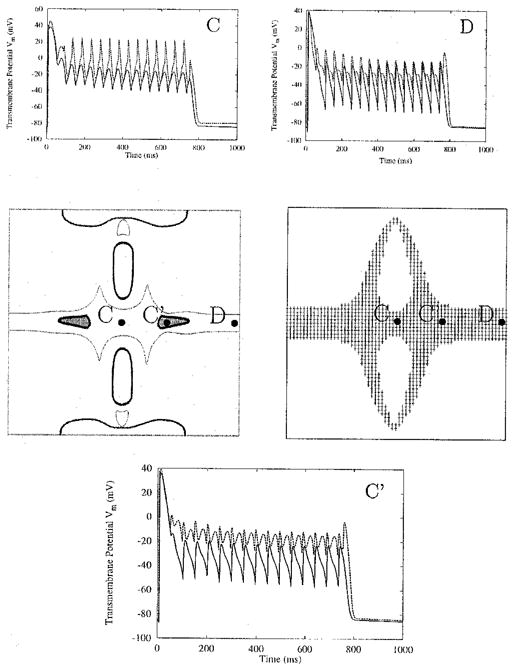
Change in sheet entrainment as stimulus strength increases. Frequency remains constant at 10 Hz, whereas stimulus amplitude increases from 800 (solid line) to 3,200 (dashed line) μA/cm. Middle panels depict types of entrainment (left) and sustained depolarization (right) at 3,200 μA/cm. In the left middle panel, thick outlines surround regions phase-locked at 1:1, thin outlines surround 1:2 entrained regions, and thick-bordered shaded regions are phase-locked at 1:4. Circles in the central panels refer to sites with extended action potential duration shown in the surrounding panels. The 3,200 μA/cm stimulus generates oscillation spikes with greater peak magnitudes (panels C and D), and oscillations with a more complex pattern (panel C′). AC stimulus is applied for 750 ms.
The shape of the oscillations varies with location as well. At the central location, site C of Figure 2, the oscillations at higher stimulus amplitudes have a “spike” appearance; at lower stimulus strengths, the oscillations resemble a rectified sine wave (Fig. 5, panel C). The change in shape with increase in stimulus amplitude also is evident in panel D of Figure 5.
The rate of phase-locking also is affected by the increase in stimulus strength. In the left middle panel of Figure 5, the regions of 1:1 phase-locking near the electrodes shrink dramatically at 3,200 μA/cm, whereas around the oppositely polarized virtual electrodes their area increases. Further, at a site on the central row 1 mm from the border, noted C′, an increase in the stimulus amplitude changes the phase-locking of the plateau oscillations (Fig. 5, panel C′). The 1:2 oscillations occurring at 800 μA/cm become 1:4 oscillations at 3,200 μA/cm; sites where 1:4 phase-locking takes place are marked by shaded regions in the left middle panel of Figure 5. Finally, the increase in stimulus amplitude typically increases APD at a given node (Fig. 5, panels C, C′, and D), because most sites are at a slightly higher Vm when the stimulus ends.
Dependence of Sheet Response on Stimulus Frequency
With the amplitude fixed at 1,600 μA/cm, the frequency of the applied stimulus is varied within the range from 10 to 60 Hz. The increase in stimulus frequency causes a loss of tissue entrainment along the side borders of the sheet. At 30 Hz, the “dog-bone pattern” of transmembrane potential distribution alters polarity very rapidly and begins to lose entrainment at sites most distant from the electrodes, namely, the central points of the vertical tissue borders. The area of no entrainment increases as stimulus frequency increases. The shaded regions on the sides of the lower left panel in Figure 6 indicate locations where the tissue is no longer entrained by the 60-Hz stimulus. The criterion to construct these gray areas is lack of regularity in the time course of the signal there. The transmembrane potential within these regions can be appreciated in Figure 6, panel G.
Figure 6.
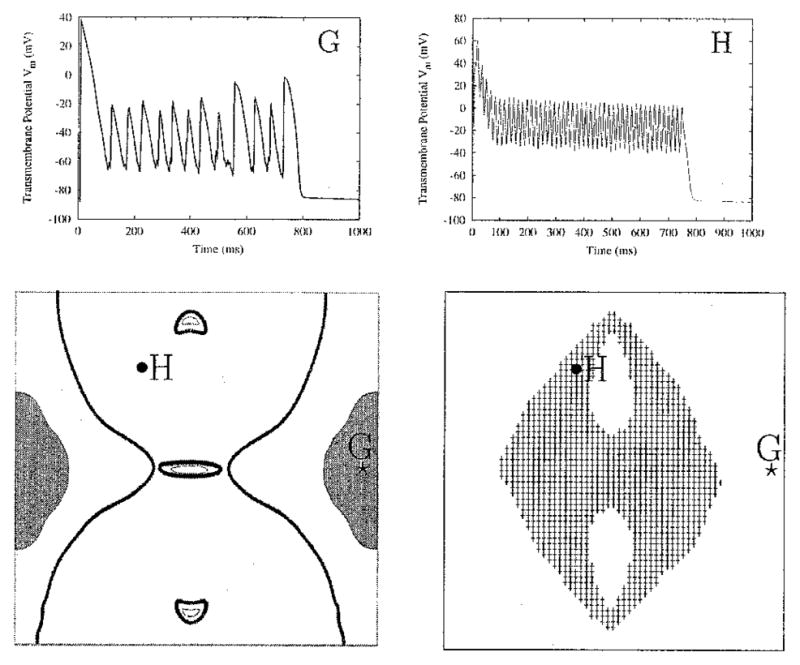
Loss of entrainment at high frequencies. For a stimulus of 1,600 μA/cm and 60 Hz, entrainment is lost along the side borders, in the gray areas on the sides of the lower left panel. The time course of Vm at site G within these areas is shown on the top right. Along the central portion of the tissue, thick outlines mark regions of 1:1 phase-locking, and thin outlines surround regions of 1:2 phase-locking. The shaded area in the lower right panel represents a region of extended action potentials (APs). The plateau oscillations of the extended AP at site H display 1:1 phase-locking.
The boundaries of the area of entrainment in which the AP is extended change as the applied frequency increases. At a frequency of 10 Hz, sustained depolarization appears predominantly in the central rows of the sheet (Fig. 2, right middle panel); at 60 Hz, it covers a noticeably wider area away from the central column of the sheet (Fig. 6, lower right panel). Interestingly, plateau oscillations within the newly incorporated gray area of extended APD demonstrate 1:1 phase-locking (Fig. 6, panel H). As the frequency increases, the regions demonstrating 1:1 phase-locking (regions within thick outlines in Fig. 6, bottom left panel) extend significantly further from the electrodes, covering much of the sheet that previously was intermediate between 1:1 and 1:2 phase-locking (Fig. 2, left middle panel). The regions of 1:2 phase-locking within the thin outlines in Figure 6, left bottom panel, also shrink. In contrast, the characteristics of the plateau oscillations at the very center of the sheet change little with an increase in frequency. As shown in Figure 7, at the central node of the sheet, the oscillations remain 1:2 phase-locked when the stimulus frequency is raised from 15 to 30 Hz. In the 30-Hz case, Vm oscillates over a smaller range of potentials compared with the 15-Hz case; the same response is seen in single-cell simulations.14 This decrease in oscillation amplitude as stimulus frequency increases is shown in Figure 8 for the central node and two other nodes along the center row.
Figure 7.
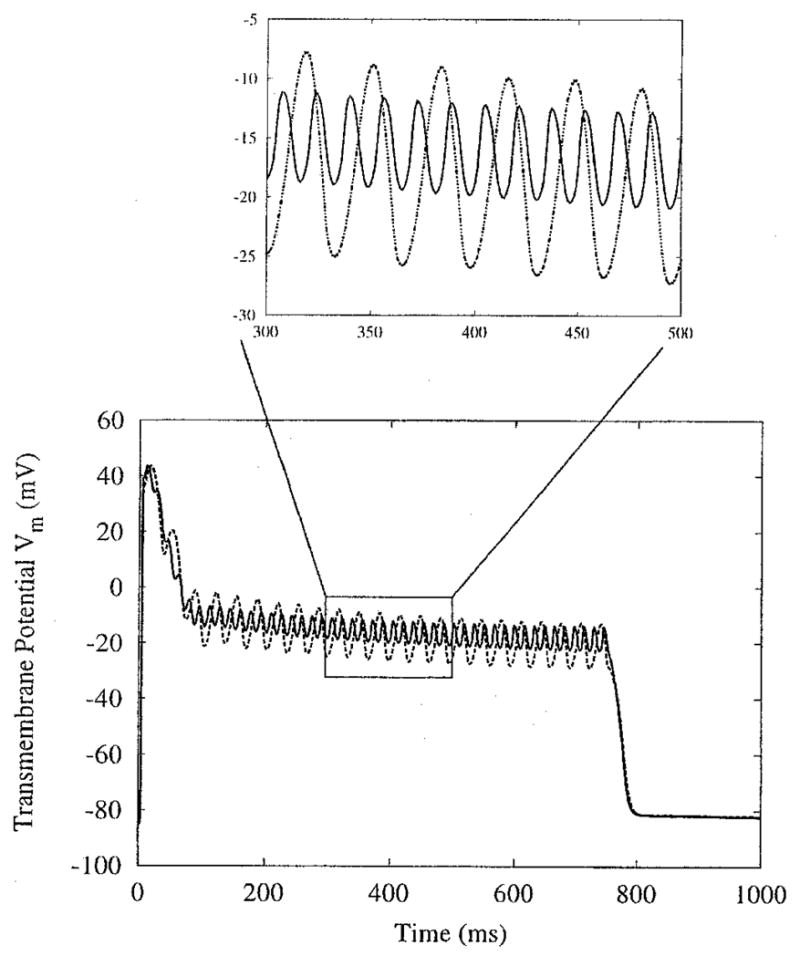
Response of node C from Figure 2 as field frequency changes. Amplitude remains constant at 1,600 μA/cm, whereas field frequency increases from 15 (dotted line) to 30 (solid line) Hz. Inset emphasizes the change in plateau oscillation amplitude.
Figure 8.
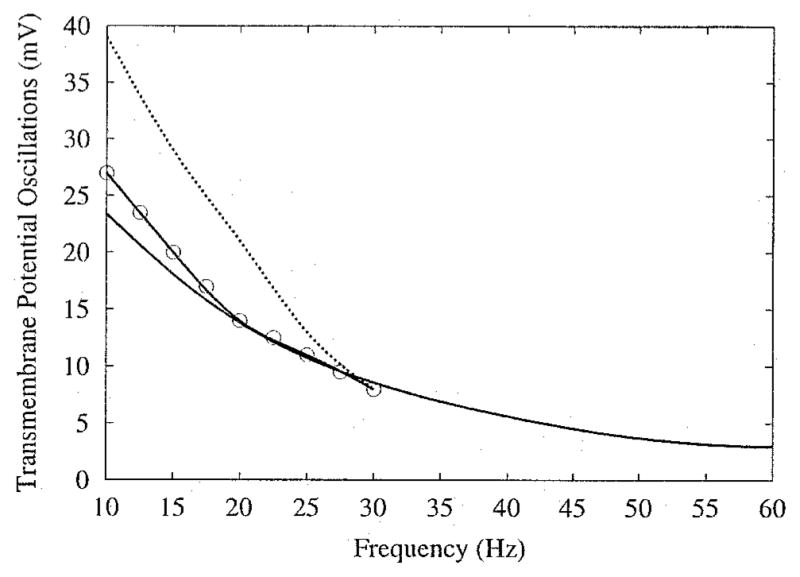
Change in amplitude of plateau oscillations as field frequency changes. Stimulus amplitude is 1,600 μA/cm. Lines correspond to nodes from Figure 5, node C (solid line), node C′ (solid line with circles), and node D (dotted line). Change in amplitude for the latter two nodes is not plotted over the entire frequency range due to loss of entrainment.
Discussion
AC Entrainment
Despite years of scientific and medical investigation, there remain significant problems with traditional cardiac defibrillation. The high energy needed to defibrillate can be damaging to cardiac tissue. Also, as reflected by the probabilistic nature of defibrillation, the shock can fail, making repeated shocks necessary. To overcome these problems, defibrillation research has concentrated on optimizing traditional waveform shape30–33 or improving the electric field distribution, for example, by changing the configuration of implanted electrodes.34 Although these approaches have the potential to decrease the defibrillation threshold and improve defibrillation efficacy, they are not based on mechanisms underlying the interaction of fibrillating tissue with the applied electric field.
Cardiac fibrillation results from spiral waves of electrical activity.35 Spiral waves are characteristic to many “excitable” systems and have been studied extensively both numerically and experimentally.36 In excitable systems, periodic forcing can result in various alterations in spatiotemporal dynamics.37 It has been shown that AC fields entrain the transmembrane voltage in isolated rabbit hearts, thus preventing the propagation of wavelets characteristic of fibrillation and possibly leading to defibrillation.12,13 This finding indicates that it is possible to implement AC defibrillation in a clinical setting, the specifics of which are based on the underlying tissue-field interaction mechanisms. Such a research avenue imposes the need to understand fully the mechanisms underlying tissue entrainment via AC field stimulation.
Our previous simulation study examined the effect of AC field stimulation on a single cell. It showed entrainment and APD extension caused by the variations in stimulus magnitude and polarity along the cell border that elicit opposite electrical responses from cell sides.14 Clearly, there is a difference between the electrical behavior of an isolated cardiac cell and the behavior of cells in tissue where electrotonic interactions take place. Therefore, to unravel the mechanisms responsible for the entrainment and AP extension seen in whole-heart experiments, examination of the response of cardiac tissue to AC stimulation was needed.12 The present study focuses on extracellular AC stimulation of a sheet of cardiac tissue represented as a bidomain. The tissue model has active membrane kinetics and is stimulated in diastole with a high-strength long-lasting AC waveform. Applying the external field in diastole demonstrates the basic mechanisms that underlie AC entrainment of the tissue without additional complications caused by the pre-shock activity. We chose a fiber orientation and electrode configuration that was used in previous studies18,26,38 for easier comparison with published results. For the chosen electrode configuration, we need to use a small sheet size (here, 4 mm per side) to ensure that the shock affects electrotonically the entire sheet. Indeed, both experimental39 and computational studies40 have demonstrated that shocks create VEP throughout the myocardium. Postshock activity is dependent on these VEPs established by the shock. To mimic the real situation and thus achieve a distribution of VEP that covers the entire preparation in a sheet with straight fibers subjected to point-source stimulation requires the use of a small sheet size. This is in accordance with the original experimental studies12,13 where entrainment at low frequencies was observed over a large portion of the heart surface.
Tissue Response to AC Fields
Entrainment occurs when cardiac tissue is subjected to long-duration AC extracellular stimulation. Shock-induced VEPs play a large role in the entrainment process, by inducing changes in Vm in areas not immediate to the electrodes. With typical defibrillation shocks, these VEP regions appear briefly and influence postshock activity.39,41–43 With long-duration AC shocks, however, the VEP patterns become synchronized with the stimulus; the VEP reverses polarity as the stimulus does so. Tissue entrainment is strongly dependent on stimulus frequency. At low frequencies, the entire sheet is entrained by the AC stimulus. As the stimulus frequency increases, entrainment is first lost at areas most distant from the electrodes (Fig. 6, left panel). This is because the VEPs established by a single half-period of the shock are present only until the shock polarity changes. At higher frequencies, the VEPs have an increasingly shorter amount of time to develop. This limits the extent to which the VEPs can affect the state of the underlying tissue. Regions that originally were under the weakest influence of the AC stimulus become free of entrainment altogether. However, these regions do not remain in diastole; wavefronts propagate through them (Fig. 6, panel G).
The characteristics of tissue entrainment vary with stimulus strength and frequency, and location on the sheet. Sites near the electrode respond with large oscillations in Vm (Fig. 2, panel A); often Vm can drop below Vrest and rise well above the normal AP amplitude. These oscillations are phase-locked 1:1 with the driving frequency. Further from the electrode, they can be phase-locked 1:1 with the stimulus (Fig. 2, region within thick outlines in the middle left panel) or 1:2 (Fig. 5, panel D, 800 μA/cm stimulus). At some entrained locations, depolarization is sustained for the duration of the stimulus, resulting in a single AP with an extended oscillatory plateau. The extended AP plateau oscillations most often occur phase-locked 1:2 with the stimulus frequency, although 1:1 and 1:4 phase-locked oscillations also can appear.
Within the areas of extended APs, the variations in the plateau oscillations reflect the different mechanisms that underlie sustained depolarization. These mechanisms can be classified into two groups: (1) mechanisms responsible for sustained depolarization in regions of weak transmembrane voltage gradients, and (2) mechanisms operating in regions of strong transmembrane voltage gradients. Both types are supported, directly or indirectly, by the VEP patterns that arise when electric shocks are delivered to cardiac tissue.
As mentioned previously, the strongest effect of the stimulus is present near the electrode, as in Figure 2, site A. Depolarization is not sustained in this region due to the anodal portion of the stimulus cycle that hyperpolarizes Vm. Further away from the electrode, the hyperpolarizing effect of the stimulus becomes weaker. Thus, with increase in stimulus frequency, the depth of the Vm oscillations decreases until extended APs with 1:1 plateau oscillations appear, such as the one recorded at site H of Figure 6, where a 60-Hz field creates oscillations at 60 Hz along the extended plateau. This extension of APD takes place in regions where there is not a strong VEP-induced transmembrane voltage gradient between adjacent regions. The cells in the region illustrated by site H have very little electrotonic influence on each other because they all follow the stimulus simultaneously. Therefore, their behavior is close to that of a membrane patch subjected to extracellular stimulation. A simulation study conducted by Vigmond et al.44 demonstrates that the membrane patch responds to AC fields with 1:1 plateau oscillations. This behavior is consistent with results of cardiac sucrose gap experiments where spatial effects between cardiac cells were eliminated.45
Similarly, strong voltage gradients are not present at the middle of the sheet. Instead, sustained depolarization there is caused by propagation of a wavefront from the cathode (Fig. 1). This wavefront encounters refractory tissue at the middle of the sheet; the mid-sheet tissue is too far from the virtual anode to be repolarized immediately. Propagation of the wavefront is blocked at the middle of the sheet. However, this depolarized tissue acts as a current source. Currents from the wavefront spread electrotonically across to the refractory tissue, raising Vm and delaying the normal repolarization process. When the stimulus cycle reverses, the tissue at the middle of the sheet is kept refractory by currents supplied by the new wavefront propagating from the new virtual cathode at the opposite end of the tissue. Thus, the constantly oscillating AC field creates a region of refractory tissue around the middle line of the sheet, which blocks wavefront propagation for the duration of the extracellular stimulus.
The plateau oscillations in the region of extended APs at the middle of the sheet are phase-locked at a rate of 1:2 with the driving frequency. However, as the stimulus amplitude is increased, 1:4 oscillations can occur along the middle rows, 1 mm from either border, but not around the center of the sheet (Fig. 5, left middle panel). Electrotonic currents flowing along the central rows between the border and the center of the sheet combine with the nonlinear membrane properties to cause this conversion into 1:4 entrainment rate. During the extended plateau, a difference exists between Vm at the center of the sheet and Vm at the border of the middle row (Fig. 5). As the stimulus amplitude is increased, the plateau oscillations at these locations increase in magnitude, which in turn causes the transverse transmembrane voltage gradient between them to grow larger. At high stimulus amplitudes, this gradient becomes large enough to produce electrotonic currents of significant strength at the sites located between the center and the borders of the sheet. This causes an additional depolarization in Vm there during each half-cycle of the stimulus, creating the 1:4 oscillations evident in Figure 5, panel C′. The 1:4 oscillations do not appear in simulations in which the AC field amplitude is within the range from 800 to 1,600 μA/cm.
Along the border between VEP regions directly adjacent to the electrode site, there exists a thin area only a few nodes thick; in this intermediate region, 1:2 oscillations develop (Fig. 2, left middle panel, two crescent areas within thin outlines). At the top and bottom of the sheet, the “dog-bone” VEP pattern creates a strongly depolarized region of tissue immediately adjacent to a strongly hyperpolarized region. The large gradient in transmembrane voltage drives electrotonic current from the depolarized region into the hyperpolarized region. The polarity reversal of the stimulus, twice every cycle, results in gradient-driven currents of direction alternating twice every cycle. Thus, the resulting plateau oscillations become 1:2 phase-locked. This mechanism is similar to the mechanism driving the plateau oscillations of a single cell subjected to AC field stimulation (see following).14
Comparison with Single-Cell Simulations and Experimental Results
A previous study demonstrated sustained oscillatory AP plateau in a computational model of a single cell under AC field stimulation.14 APD extension in this case is caused by the time-varying extracellular field gradient, which, once an AP is generated, results in depolarization at opposite ends of the cell during each consecutive phase, thus leading to an extended oscillatory plateau. The field gradient reverses polarity twice during each cycle, resulting in depolarizations twice each cycle, once at each end of the cell, and thus creating 1:2 plateau oscillations. This interaction is similar to mechanisms responsible for sustained plateau depolarization in portions of the sheet, namely, around the boundaries of the VEP, as discussed earlier. However, the time-varying voltage gradient responsible for extending the APD here is not in the extracellular potential Φe,1 4 as in the single-cell case, but instead in Vm.
Data from experiments using rabbit hearts demonstrated that entrainment of the heart by AC stimulation, and particularly the membrane potential oscillations during the extended plateau, are dependent on stimulus frequency and amplitude.12 The single-cell model showed frequency and amplitude dependence as well. However, the plateau oscillations in this model were 1:2 phase-locked for all frequency and amplitude values at which the single cell was entrained.14 The present two-dimensional sheet simulations demonstrated 1:1, 1:2, and 1:4 phase-locking of the plateau oscillations, which is in agreement with the whole-heart experimental results.12 This confirms an earlier hypothesis14 that entrainment and plateau oscillation patterns are the result of complex cell-to-cell interactions, which could not be represented by the model of a single cell.
Study Limitations
Although this study provides insight into the behavior observed experimentally,12 it is not without drawbacks. First, the cardiac tissue model used in the simulations is two dimensional. This simplification is necessary in order to reduce the computational expense of the simulations. Because the model implements active membrane kinetics and is subjected to a long-lasting AC stimulus (much greater than the typical 5 to 20 msec for DC shocks), it is necessary to find ways to decrease the computational complexity of the problem. Reducing the system from three to two dimensions made the problem computationally tractable.
The sheet model has a very simple fiber field: straight homogeneous fibers running in the direction of the bipolar stimulus electrode. This model does not include fiber curvature or anatomic obstacles (blood vessels, regions of scar tissue, etc.) that are present in real cardiac tissue. Curvature of the fibers causes more complex VEP patterns than the well-examined “dog-bone” pattern.15,16,27 The same holds true for VEP induced by more realistic defibrillation electrode configurations.40 Despite these simplifications, the model demonstrates the interaction of the AC stimulus with the tissue and provides explanation for the experimentally observed tissue entrainment and the regional variation of phase-locking of the AP plateau oscillations. The introduction of fiber curvature or other stimulus electrode configuration to the simulations would change the far-field distribution of VEP across the tissue, but the underlying mechanisms responsible for entrainment and extended APD demonstrated here would remain the same.
Acknowledgments
The authors are grateful to Dr. James Eason, Dr. Edward Vigmond, and Felipe Aguel for their constructive comments and invaluable technical support.
This work was supported by NIH Grant R01-HL63195 and NSF Grant DMF-9709754 to Dr. Trayanova, and a grant from The Cardiac Arrhythmia Research and Education (CARE) Foundation to Dr. Gray.
References
- 1.Walcott GP, Walker RG, Cates AW, Krassowska W, Smith WM, Ideker RE. Choosing the optimal monophasic and biphasic waveforms for ventricular defibrillation. J Cardiovasc Electrophysiol. 1995;6:737–750. doi: 10.1111/j.1540-8167.1995.tb00450.x. [DOI] [PubMed] [Google Scholar]
- 2.Tacker WA, editor. Defibrillation of the Heart: ICDs, AEDs, and Manual. Mosby; St. Louis: 1994. [Google Scholar]
- 3.Prevost JL, Batelli F. Death by electric currents (alternating current) C R Acad Sci . 1899;128:668. [Google Scholar]
- 4.Prevost JL, Batelli F. Some effects of electric discharge on the hearts of mammals. C R Acad Sci . 1899;129:1267. [Google Scholar]
- 5.Hooker D, Kouwenhoven W, Langworthy O. The effect of alternating electrical currents on the heart. Am J Physiol . 1933;103:444. [Google Scholar]
- 6.Ferris LP, King BG, Spence PW, Williams HB. Effect of electric shock on the heart. Electr Eng . 1936;55:498. [Google Scholar]
- 7.Beck C, Pritchard W, Feil H. Ventricular fibrillation of long duration abolished by electric shock. JAMA . 1947;135:985. doi: 10.1001/jama.1947.62890150005007a. [DOI] [PubMed] [Google Scholar]
- 8.Zoll PM, Linenthal AJ, Gibson W, Paul MH. Termination of ventricular fibrillation in man by externally applied countershock. N Engl J Med . 1956;254:727. doi: 10.1056/NEJM195604192541601. [DOI] [PubMed] [Google Scholar]
- 9.Witzel D, Geddes LA, McFarlane J, Nichols W. The influence of cycle frequency on the effectiveness of electrical defibrillation of the canine ventricles. Cardiovasc Res. 1967;5:112–118. [PubMed] [Google Scholar]
- 10.Ferris CD, Moore TW, Khazei AH, Cowley RA. A study of parameters involved in alternating current defibrillation. Med Biol Eng. 1969;7:17–29. doi: 10.1007/BF02474666. [DOI] [PubMed] [Google Scholar]
- 11.Tacker WA, Geddes LA. Electrical Defibrillation. CRC Press; Boca Raton: 1968. [Google Scholar]
- 12.Gray RA, Foster E, Jalife J. Entrainment of the intact ventricles using field stimulation. PACE. 1996;19(Pt II):666. [Google Scholar]
- 13.Gray RA, Jalife J. Low frequency sinusoidal waveform decreases defibrillation threshold: A computer study. PACE . 1997;20:1174. [Google Scholar]
- 14.Meunier JM, Trayanova NA, Gray RA. Sinusoidal stimulation of myocardial tissue: Effects on single cells. J Cardiovasc Electrophysiol. 1999;10:1619–1630. doi: 10.1111/j.1540-8167.1999.tb00226.x. [DOI] [PubMed] [Google Scholar]
- 15.Trayanova NA, Skouibine K, Aguel F. The role of cardiac tissue structure in defibrillation. Chaos. 1998;8:221–233. doi: 10.1063/1.166299. [DOI] [PubMed] [Google Scholar]
- 16.Trayanova NA, Skouibine K. Modelling defibrillation: Effects of fiber curvature. J Electrocardiol. 1998;31:23–29. doi: 10.1016/s0022-0736(98)90274-6. [DOI] [PubMed] [Google Scholar]
- 17.Trayanova NA, Skouibine K, Moore PK. Virtual electrode effects in defibrillation. Prog Biophys Mol Biol. 1998;69:387–403. doi: 10.1016/s0079-6107(98)00016-9. [DOI] [PubMed] [Google Scholar]
- 18.Skouibine K, Trayanova NA, Moore PK. Anode/cathode make and break phenomena in a model of defibrillation. IEEE Trans Biomed Eng. 1999;46:769–777. doi: 10.1109/10.771186. [DOI] [PubMed] [Google Scholar]
- 19.Lindblom AE, Roth BJ, Trayanova NA. Role of virtual electrodes in arrhythmogenesis: Pinwheel experiment revisited. J Cardiovasc Electrophysiol. 2000;11:274–285. doi: 10.1111/j.1540-8167.2000.tb01796.x. [DOI] [PubMed] [Google Scholar]
- 20.Henriquez CS. Simulating the electrical behavior of cardiac muscle using the bidomain model. Crit Rev Biomed Eng. 1993;21:1–77. [PubMed] [Google Scholar]
- 21.Krassowska W. Effects of electroporation on transmembrane potential induced by defibrillation shocks. PACE. 1995;18:1644–1660. doi: 10.1111/j.1540-8159.1995.tb06986.x. [DOI] [PubMed] [Google Scholar]
- 22.Skouibine K, Trayanova NA, Moore PK. A numerically efficient model for simulation of defibrillation in an active bidomain sheet of myocardium. Math Biosci. 2000;166:85–100. doi: 10.1016/s0025-5564(00)00019-5. [DOI] [PubMed] [Google Scholar]
- 23.Drouhard JP, Roberge FA. Revised formulation of the Hodgkin-Huxley representation of the sodium current in cardiac cells. Comput Biomed Res. 1987;20:333–350. doi: 10.1016/0010-4809(87)90048-6. [DOI] [PubMed] [Google Scholar]
- 24.DeBruin KA, Krassowska W. Modeling electroporation in a single cell: I. Effects of field strength and rest potential. Biophys J. 1999;77:1213–1224. doi: 10.1016/S0006-3495(99)76973-0. [DOI] [PMC free article] [PubMed] [Google Scholar]
- 25.DeBruin KA, Krassowska W. Modeling electroporation in a single cell: II. Effects of ionic concentrations. Biophys J. 1999;77:1225–1233. doi: 10.1016/S0006-3495(99)76974-2. [DOI] [PMC free article] [PubMed] [Google Scholar]
- 26.Aguel F, DeBruin KA, Krassowska W, Trayanova NA. Effects of electroporation on the transmembrane potential distribution in a two-dimensional bidomain model of cardiac tissue. J Cardiovasc Electrophysiol. 1999;10:701–714. doi: 10.1111/j.1540-8167.1999.tb00247.x. [DOI] [PubMed] [Google Scholar]
- 27.Roth BJ, Wikswo JP., Jr Electrical stimulation of cardiac tissue: A bidomain model with active membrane properties. IEEE Trans Biomed Eng. 1994;41:232–240. doi: 10.1109/10.284941. [DOI] [PubMed] [Google Scholar]
- 28.Jones JL, Jones RE, Milne KB. Refractory period prolongation by biphasic defibrillator waveforms is associated with enhanced sodium current in a computer model of the ventricular action potential. IEEE Trans Biomed Eng. 1994;41:60–68. doi: 10.1109/10.277272. [DOI] [PubMed] [Google Scholar]
- 29.DeBruin KA, Krassowska W. Electroporation as a mechanism of the saturation of transmembrane potential induced by large electric fields. Proceedings of the 18th Annual IEEEEMBS Conference; 1996. CD ROM. [Google Scholar]
- 30.Kroll M. A minimal model of the single capacitor biphasic defibrillation waveform. PACE. 1994;17:1782–1792. doi: 10.1111/j.1540-8159.1994.tb03746.x. [DOI] [PubMed] [Google Scholar]
- 31.Swerdlow CD, Fan W, Brewer JE. Charge-burping theory correctly predicts optimal ratios of phase duration for biphasic defibrillation waveforms. Circulation. 1996;94:2278–2284. doi: 10.1161/01.cir.94.9.2278. [DOI] [PubMed] [Google Scholar]
- 32.Yamanouchi Y, Brewer JE, Mowrey KA, Donohoo AM, Wilkoff BL, Tchou PJ. Optimal small-capacitor biphasic waveform for external defibrillation: Influence of phase-1 tilt and phase-2 voltage. Circulation. 1998;98:2487–2493. doi: 10.1161/01.cir.98.22.2487. [DOI] [PubMed] [Google Scholar]
- 33.Fishler M. Theoretical predictions of the optimal monophasic and biphasic defibrillation waveshapes. IEEE Trans Biomed Eng. 2000;47:59–67. doi: 10.1109/10.817620. [DOI] [PubMed] [Google Scholar]
- 34.KenKnight BH, Walker R, Ideker RE. Marked reduction of ventricular defibrillation threshold by application of an auxiliary shock to a catheter electrode in the left posterior coronary vein of dogs. J Cardiovasc Electrophysiol. 2000;11:900–906. doi: 10.1111/j.1540-8167.2000.tb00070.x. [DOI] [PubMed] [Google Scholar]
- 35.Gray RA, Pertsov A, Jalife J. Spatial and temporal organization during cardiac fibrillation. Nature. 1998;392:675–678. doi: 10.1038/32164. [DOI] [PubMed] [Google Scholar]
- 36.Gray RA, Jalife J. Spiral waves and the heart. Int J Bifurcat Chaos. 1996;6:415–435. [Google Scholar]
- 37.Carroll TL, Pecora LM. Using chaos to keep period multiplied systems in phase. Phys Rev E. 1993;48:2426–2436. doi: 10.1103/physreve.48.2426. [DOI] [PubMed] [Google Scholar]
- 38.Sepulveda NG, Wikswo JP., Jr Electric and magnetic fields from two-dimensional bisyncytia. Biophys J. 1987;51:557–568. doi: 10.1016/S0006-3495(87)83381-7. [DOI] [PMC free article] [PubMed] [Google Scholar]
- 39.Efimov IR, Cheng YN, Yamanouchi Y, Tchou PJ. Direct evidence of the role of virtual electrode-induced phase singularity in success and failure of defibrillation. J Cardiovasc Electrophysiol. 2000;11:861–868. doi: 10.1111/j.1540-8167.2000.tb00065.x. [DOI] [PubMed] [Google Scholar]
- 40.Trayanova NA, Hillebrenner M, Aguel F, Campbell C, Eason JC. Transmural post-shock arrhythmogenesis in the canine heart. PACE . 2001;24:670. [Google Scholar]
- 41.Wikswo JP., Jr . Tissue anisotropy, the cardiac bidomain, and the virtual cathode effect. In: Zipes DP, Jalife J, editors. Cardiac Electrophysiology: From Cell to Bedside. 2. WB Saunders; Philadelphia: 1994. pp. 348–361. [Google Scholar]
- 42.Wikswo JP, Jr, Lin SF, Abbas RA. Virtual electrodes in cardiac tissue: A common mechanism for anodal and cathodal stimulation. Biophys J. 1995;69:2195–2210. doi: 10.1016/S0006-3495(95)80115-3. [DOI] [PMC free article] [PubMed] [Google Scholar]
- 43.Efimov IR, Cheng YN, Biermann M, Van Wagoner DR, Mazgalev TN, Tchou PJ. Transmembrane voltage changes produced by real and virtual electrodes during monophasic defibrillation shock delivered by an implantable electrode. J Cardiovasc Electrophysiol. 1997;8:1031–1045. doi: 10.1111/j.1540-8167.1997.tb00627.x. [DOI] [PubMed] [Google Scholar]
- 44.Vigmond EJ, Trayanova NA, Malkin RA. Excitation of a cardiac muscle fiber by extracellularly applied sinusoidal current. J Cardiovasc Electrophysiol. 2001;12:1145–1153. doi: 10.1046/j.1540-8167.2001.01145.x. [DOI] [PMC free article] [PubMed] [Google Scholar]
- 45.Antoni H, Toppler J, Krause H. Polarization effects of sinusoidal 50-cycle alternating current on membrane potential of mammalian cardiac fibres. Pflugers Arch. 1970;314:274–291. doi: 10.1007/BF00592287. [DOI] [PubMed] [Google Scholar]


