

Abstract
Background: Although airway inflammation plays a major role in the pathophysiology of asthma, quantitative markers of airway nflammation are limited in clinical practice.
Objective: To determine if the levels of noninvasive markers of eosinophil‐catalyzed oxidation, lipid peroxidation, and nitric oxide (NO) production are associated with asthma.
Methods: Participants were enrolled from academic medical centers participating in the Severe Asthma Research Program. Clinical characteristics, laboratory data, pulmonary function tests, and the levels of the following noninvasive markers were obtained: urinary bromotyrosine (BrTyr), a marker of eosinophil‐catalyzed oxidation, urinary F2‐isoprostanes (F2‐lsoPs), markers of lipid peroxidation, and exhaled NO, a marker of airway inflammation.
Results: Fifty‐seven asthmatic participants and 38 healthy participants were enrolled. BrTyr, F2‐lsoPs, and exhaled NO were each significantly increased in asthmatic participants versus controls (p < 0.01). An elevated level (greater than the median) of any marker was associated with a significant 3‐ to 6‐fold greater odds of having asthma. Participants with two or more elevated marker levels showed an 18‐fold greater odds of having asthma. Relationships were also noted with airflow obstruction and bronchodilator response.
Conclusion: The findings from this pilot study indicate that urinary levels of BrTyr and F2‐lsoPs, in addition to exhaled NO levels, are associated with asthma.
Keywords: asthma, biomarkers, inflammation
Introduction
Asthma is a chronic inflammatory disorder of the airways characterized by recurrent episodes of wheezing, dyspnea, chest tightness, and cough.1 As airway inflammation and oxidative stress play integral roles in asthma pathophysiology, a directed assessment of the inflammatory pathways could be helpful in the evaluation and management of patients with asthma. 2 , 3 , 4
The inflammatory milieu of the airways in asthma can generate multiple distinct oxidant species that can cause tissue injury and produce bronchial hyperresponsiveness. 5 , 6 Although the labile nature of oxidant species makes them difficult to quantify in vivo, stable end products of distinct oxidation pathways may be used as reliable indices of airway oxidative stress. For example, we have shown in allergen‐induced asthma that when eosinophils are recruited to the airways and undergo respiratory bursts, they generate brominating oxidants such as hypobromous acid (HOBr) that promote posttranslational modification of protein tyrosine residues to form 3‐bromotyrosine (BrTyr). 7 , 8 Similarly, numerous oxidation pathways can initiate lipid peroxidation, forming F2‐isoprostanes (F2‐IsoPs), free‐radical oxidation products of arachidonic acid, which also serve as global indices of oxidative stress. Elevated levels of F2‐IsoPs have been detected in both urine and exhaled breath condensates of asthmatic patients. 9 , 10 Last, numerous studies have demonstrated increased nitric oxide (NO) production in the airways of asthmatic patients due, at least in part, to upregulation of inducible nitric oxide synthase (iNOS) in cells like bronchial epithelial cells and alveolar macrophages. 11 , 12 , 13 , 14 , 15 , 16
Protein bromination, lipid peroxidation, and NO production represent distinctbiochemicalpathways that have allbeen associated with the pathophysiology of asthma. 8 , 9 , 10 , 17 , 18 , 19 , 20 Furthermore, BrTyr, F2‐IsoPs, and NO serve as stable and quantifiable end products of these respective pathways. 7 , 8 , 16 In this study, we determined the levels of urinary BrTyr, urinary F2‐IsoPs (both 8‐epi‐PGF2α and its metabolite 2,3‐dinor‐8‐epi‐PGF2α), and exhaled NO in a cohort of asthmatic patients and healthy controls. We hypothesized that the levels of these markers of airway inflammation and oxidative stress would be higher in asthmatic patients than in controls, correlate with the presence and reversibility of airway obstruction, and predict asthma status, particularly when pooled together as a panel. The present results reveal that a panel of noninvasive inflammatory markers may have diagnostic and prognostic utility by evaluating the presence and activity of asthma.
Preliminary results from this study were previously reported in the form of an abstract. 21
Methods
Subject enrollment and characterization
Individuals enrolled in the Severe Asthma Research Program (SARP) were included in this cross‐sectional study. Participants were recruited by individual centers participating in the SARP and gave written informed consent by signing a consent document approved by the institutional review board at the enrolling center and the SARP Data Safety and Monitoring Board. Utilizing the definition of asthma described by the Proceedings of the American Thoracic Society Workshop on Refractory Asthma, 22 the participants were classified as healthy controls, nonsevere asthmatic patients, or severe asthmatic patients. Additional healthy controls were enrolled locally. The healthy controls lacked any cardiopulmonary symptoms and had normal baseline spirometry and methacholine challenge results. 3 , 23 The exclusion criteria for all participants included smoking within the past year, former smokers with ≥5 pack‐year total history, and/or pregnancy.
Measurement of lung function, NO, and atopy
Spirometry was performed with an automated spirometer, as described elsewhere, 23 consistent with the American Thoracic Society standards. 24 Exhaled NO was measured by an online method at a constant flow rate of 50 mL/s, consistent with the American Thoracic Society standards. 25 , 26 Atopy was determined by skin prick testing.
Laboratory analysis
Complete blood counts with differentials and IgE levels were performed under standard laboratory conditions at enrolling centers within the SARP.
For urine analyses, spot urine collections were obtained. The samples were spun to remove potential cellular debris and casts and then frozen at −80°C until the time of analysis. Urinary creatinine (Cr) levels were quantified on an Abbott Architect machine (Abbott Diagnostics, Abbott Park, IL, USA), according to the manufacturer's instructions.
Urinary free 3‐BrTyr levels were determined by stable isotope dilution HPLC with online electrospray ionization tandem mass spectrometry using turbidometric solid‐phase extraction coupled to a reverse‐phase analytic separation on a Cohesive Technologies Aria LX HPLC instrument (Franklin, MA, USA) interfaced to an API 4000 triple quadrupole mass spectrometer (Applied Biosystems, Foster City, CA, USA). Synthetic [13C6]‐BrTyr was used as an internal standard, and [13C9,15N1]‐tyrosine was included to simultaneously monitor potential artificial generation of analyte. Under the conditions employed for the assay, no artificial bromination was detected, the average spike and recovery was 101% and ranged from 98 to 105%, and assay precision of <7% was noted across all concentrations ranges examined.
Urinary levels of 8‐epi‐PGF2α and 2,3‐dinor‐8‐epi‐PGF2α were analyzed by stable isotope dilution HPLC with online electrospray ionization tandem mass spectrometry using a HPLC interfaced to a Micromass Ultima triple quadrupole mass spectrometer (Waters, Milford, MA, USA). Immediately after thawing, an internal standard (9α,llα,15S‐trihydroxy‐5Z,13E‐dien‐l‐oic‐3,3,4,4‐d4 acid; PGF2α‐d4; Cayman Chemical Company, Ann Arbor, MI, USA) was added to the sample. The average spike and recovery was 103% and ranged from 94 to 108% across low‐, mid‐, and high‐level control samples, and assay precision of <10% was noted across all concentrations ranges examined. To adjust for variations in urinary dilution, the results of BrTyr and F2‐IsoPs are reported as ratios with urine Cr concentrations.
Statistical analysis
Baseline characteristics and marker levels among the groups were compared with t‐test and analysis of variance for continuous normally distributed variables, the Wilcoxon rank‐sum test and Kruskal‐Wallis test for continuous nonnormally distributed variables, and the likelihood ratio χ2 test for categorical variables. Appropriate Bonferroni adjustments were made for pairwise comparisons. Correlations among marker levels and other variables were assessed using Spearman's rank‐sum correlation coefficients or Pearson's correlation coefficients, if the data was normally distributed. A p‐value ≥0.05 was defined as statistically significant. One asthmatic and one control subject were excluded from statistical analyses based upon the predetermined criteria of marker levels greater than 5 standard deviations above the mean. All statistical analyses were performed in JMP version 5.1 and SAS version 9.0 (SAS Institute, Cary, NC, USA).
Results
Fifty‐seven asthmatic and 38 control participants were included in this study. As noted in Table 1 , asthmatic patients were similar to controls with respect to age, gender, and BMI. Asthmatic patients had higher leukocyte counts (p = 0.006) and frequency of atopy (p= 0.03) than controls. As expected, asthmatic patients had greater airway obstruction and increased bronchodilator responsiveness than controls.
Table 1.
Features of study participants.
| Characteristic | Controls | Asthmatic patients | p‐value* |
|---|---|---|---|
| Number (%) | 38 (40) | 57 (60) | |
| Age (years) | 30.0 (25.0–43.0) | 28.5 (21.3–46.8) | 0.69 |
| Gender, M:F | 18:19 | 31:25 | 0.53 |
| BMI (kg/m2) | 25.2 (22.3–27.6) | 25.9 (22.3–35.3) | 0.29 |
| Total WBC × 106(serum)† | 5.5 (4.4–6.7) | 6.4 (5.3–8.9) | 0.006 |
| % Eosinophils | 2.5 (1.6–3.4) | 2.7 (1.3–5.5) | 0.45 |
| % Neutrophils | 57.0 (51.5–66.0) | 55.7 (45.6–66.2) | 0.70 |
| IgE (lU/mL) | 60.5 (33.3–130.0) | 93.0 (16.3–195.8) | 0.82 |
| Atopy)‡: | 0.0 (0.0–1.5) | 2.0 (0.0–4.0) | 0.03 |
| % Predicted FEV, | 106.0 (97.0–113.0) | 79.0 (62.0–91.0) | <0.001 |
| FEV1/FVC | 0.82 (0.75–0.88) | 0.69 (0.59–0.77) | <0.001 |
| % Change FEV1, post‐BD | 2.0 (0.0–4.2) | 10.3 (4.3–17.3) | <0.001 |
| BrTyr§ | 0.13 (0.05–0.20) | 0.19 (0.12–0.32) | 0.003 |
| 8‐epi‐PGF2α | 1.9 (1.3–3.9) | 3.4 (2.2–5.3) | 0.007 |
| 2,3‐dinor‐8‐epi‐PGF2α | 23.9 (17.2–48.9) | 46.9 (28.6–71.5) | 0.005 |
| Exhaled NO (ppb) | 15.9 (11.9–21.6) | 41.6 (16.4–83.1) | 0.004 |
All variables expressed as median (interquartile range), unless otherwise specified.
*p‐values calculated by unpooled f‐test for normally distributed data and Wilcoxon's rank‐sum test for nonnormally distributed data.
†Complete blood count with differentials and spirometry were performed on a random sampling of controls, N= 20 and 21, respectively.
‡Atopy is defined as the number of skin tests positive of 12 allergens tested.
§Urinary markers (BrTyr, 8‐epi‐PGF2α, and 2,3‐dinor‐8‐epi‐PGF2α) are measured in ng/mg creatinine.
BrTyr = bromotyrosine; NO = nitric oxide.
Asthmatic patients had significantly higher levels of each marker measured compared with healthy controls ( Table 1 ): BrTyr (p= 0.003), 8‐epi‐PGF2α (p= 0.007), 2,3‐dinor‐8‐epi‐PGF2α(p = 0.005), and exhaled NO (p= 0.04). Interestingly, higher levels of urinary BrTyr and exhaled NO each correlated with severer airway obstruction as monitored by % predicted forced expiratory volume in 1 second (FEV1) (R[p] of−0.30[0.02] and −0.30 [0.03] for BrTyr and NO, respectively) and the ratio of the forced expiratory volume in 1 second to the forced vital capacity (FEV/FVC) (R[p] of −0.35[0.006] and −0.29[0.04] for BrTyr and NO, respectively). Higher NO levels also correlated significantly with greater bronchodilator response ( Table 2 ). Leukocyte counts did not correlate with urinary biomarkers, including no correlation between urinary BrTyr and absolute eosinophil count. However, exhaled NO levels were strongly correlated with both increased eosinophils and serum IgE levels ( Table 2 ), consistent with previous reports. 27 , 28 Although F2‐IsoP levels did not demonstrate any correlation with leukocyte counts or indices of airway obstruction and bronchodilator responsiveness, they did correlate significantly with BMI, especially the urinary metabolite 2,3‐dinor‐8‐epi‐PGF2α. As expected, the levels of isoprostanes significantly correlated with one another ( Table 2 ).
Table 2.
Correlations of markers and indices of asthma severity.
| Characteristic | BrTyr* | 8‐epi‐PGF2α | 2,3‐dinor‐8‐epi‐PGF2α | NO | |
|---|---|---|---|---|---|
| BMI (kg/m2) | R† | 0.13 | 0.27 | 0.42 | 0.05 |
| P | 0.30 | 0.03 | <0.001 | 0.73 | |
| % Predicted FEV1 | R | −0.30 | 0.0002 | −0.15 | −0.30 |
| P | 0.02 | 1.00 | 0.23 | 0.03 | |
| FEV1/FVC | R | −0.35 | 0.17 | −0.03 | −0.29 |
| P | 0.006 | 0.18 | 0.83 | 0.04 | |
| % Change FEV1 | R | 0.23 | −0.14 | 0.05 | 0.51 |
| P | 0.08 | 0.25 | 0.68 | <0.001 | |
| IgE (lU/mL) | R | 0.02 | −0.01 | −0.20 | 0.44 |
| P | 0.87 | 0.91 | 0.09 | <0.001 | |
| Atopy‡ | R | 0.05 | 0.19 | 0.04 | 0.25 |
| P | 0.68 | 0.13 | 0.76 | 0.08 | |
| % Eosinophils | R | −0.06 | −0.02 | −0.13 | 0.43 |
| P | 0.66 | 0.85 | 0.28 | 0.001 | |
| % Neutrophils | R | 0.07 | −0.02 | 0.08 | −0.08 |
| P | 0.59 | 0.87 | 0.49 | 0.58 | |
| BrTyr | R | ‐ | 0.10 | 0.19 | 0.08 |
| P | ‐ | 0.35 | 0.07 | 0.57 | |
| 8‐epi‐PGF2α | R | ‐ | ‐ | 0.71 | 0.04 |
| P | <0.001 | 0.75 | |||
| 2,3‐dinor‐8‐epi‐PGF2α | R | ‐ | ‐ | ‐ | −0.10 |
| P | 0.48 |
*Urinary markers (BrTyr, 8‐epi‐PGF2α, and 2,3‐dinor‐8‐epi‐PGF2α) are measured in ng/mg creatinine; NO is measured in ppb.
†All R values represent Spearman's correlation coeffi cients; p‐value was calculated accordingly.
‡Atopy is defi ned as the number of skin tests positive of 12 allergens tested.
BrTyr = bromotyrosine; NO = nitric oxide.
The values for each noninvasive marker were dichotomized into above median levels and below median levels and evaluated for their ability to predict the presence of asthma and indices of airway obstruction and bronchodilator responsiveness ( Table 3 ). The median values were 0.16 ng/mg Cr for BrTyr, 2.86 ng/mg Cr for 8‐epi‐PGF2α, 37.2 ng/mg Cr for 2,3‐dinor‐8‐epi‐PGF2α, and 26.7 parts per billion (ppb) for NO. High (above median) levels of BrTyr, 8‐epi‐PGF2α, 2,3‐dinor‐8‐epi‐PGF2α, and NO were all individually associated with greater odds of asthma ( Table 3 and Figure 1 ). High NO levels were further associated with increased airway obstruction and bronchodilator responsiveness.
Table 3.
Odds ratios of asthma diagnosis and indices of asthma severity relative to marker levels.
| Condition | BrTyr* | 8‐epi‐PGF2α | 2,3‐dinor‐8‐epi‐PGF2α | NO | High levels ≥ 2 markers† |
|---|---|---|---|---|---|
| Asthma | 3.1 | 4.2 | 4.2 | 5.9 | 18.2 |
| (1.3–7.4) | (1.7–10.2) | (1.7–10.2) | (1.4–24.0) | (3.5–95.2) | |
| 0.01 | <0.001 | <0.001 | 0.007 | <0.001 | |
| % Predicted FEV, <80 | 1.8 | 0.6 | 0.8 | 3.1 | 4.2 |
| (0.6–5.3) | (0.2–1.5) | (0.3–2.3) | (0.9–10.2) | (1.1–15.8) | |
| 0.28 | 0.26 | 0.71 | 0.06 | 0.03 | |
| FEV1/FVC <0.70 | 2.8 | 0.5 | 0.6 | 5.3 | 4.2 |
| (0.9–8.3) | (0.2–1.5) | (0.2–1.7) | (1.5–18.7) | (1.1–15.8) | |
| 0.06 | 0.23 | 0.37 | 0.006 | 0.03 | |
| % Change FEV1 >12 | 1.8 | 0.8 | 2.3 | 9.0 | 7.1 |
| (0.6–5.9) | (0.3–2.5) | (0.7–7.1) | (1.7–46.9) | (1.4–37.7) | |
| 0.31 | 0.77 | 0.15 | 0.003 | 0.009 |
*Urinary markers (BrTyr, 8‐epi‐PGF2α, and 2,3‐dinor‐8‐epi‐PGF2α) are measured in ng/mg creatinine; NO is measured in ppb.
†High levels are defi ned as levels above the median: 0.16 ng/mg creatinine for BrTyr, 2.86 ng/mg creatinine for 8‐epi‐PGF2α, 37.19 ng/mg creatinine for 2,3‐dinor‐8‐epi‐PGF2α, and 26.7 ppb for NO. For this analysis, F2‐isoprostanes were considered as one marker with high levels, defi ned as 8‐epi‐PGF2α and/or 2,3‐dinor‐8‐epi‐PGF2α greater than median levels.
BrTyr = bromotyrosine; NO = nitric oxide.
Figure 1.
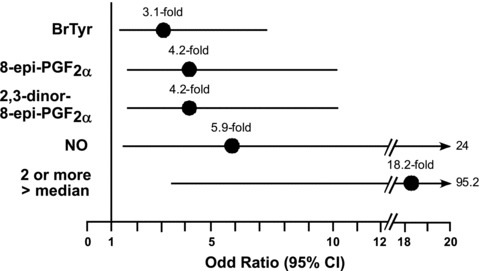
Odds ratios and 95% confidence intervals for the association between the presence of elevated marker levels, individually and in combination, versus the diagnosis of asthma. Results shown represent the odds ratio (filled circle) and 95% confidence interval (line) of having the diagnosis of asthma for a participant possessing a high level (above median) of the indicated marker or combination of markers compared with subjects possessing below median levels of the indicated marker(s). When calculating the odds ratio for having two or more markers above median levels, three marker classes were used (i.e., NO, BrTyr, and a composite F2‐isoP score) to avoid overweighting the highly correlated 8‐epi‐PGF2α, and 2,3‐dinor‐8‐epi‐PGF2α. The F2‐lsoP score was considered “high” if levels of 8‐epi‐PGF2α, and/or 2,3‐dinor‐8‐epi‐PGF2α, were greater than their respective median levels. Median levels of markers within the cohort were 0.16 ng/mg Cr for BrTyr, 2.86 ng/mg Cr for 8‐epi‐PGF2α, 37.19 ng/mg Cr for 2,3‐dinor‐8‐epi‐PGF2α, and 26.7 ppb for NO.
In order to assess whether a panel of markers in aggregate predicted asthma and indices of airway obstruction and bronchodilator responsiveness, individuals with two or more markers above median (“high”) values were compared with those with one or no high values. Exhaled NO and BrTyr were each considered one marker. Elevated isoprostanes, 8‐epi‐PGF2α and/or 2,3‐dinor‐8‐epi‐PGF2α, were considered together as a third marker, given their strong correlation with one another. Subjects with two or more high levels of noninvasive markers were approximately 18 times as likely to have asthma, 4 times more likely to have airway obstruction, and 7 times as likely to have bronchial responsiveness to bronchodilator ( Table 3 and Figure 1 ).
Discussion
Current guidelines from the National Institutes of Health emphasize the need for not only symptom control but also reduction of airway inflammation in the treatment of asthma. 1 However, current standards of practice depend on clinical history, physical examination, and pulmonary function tests to determine the presence and severity of asthma, none of which quantifiably measure airway inflammation. Utilizing a panel of markers to diagnose asthma and monitor asthma severity directly in terms of airway inflammation could allow clinicians to gauge disease activity at the molecular level and optimize the effectiveness of anti‐inflammatory treatment regimens.
Exhaled NO is an FDA‐cleared diagnostic that has been used previously to measure airway inflammation. 29 Many studies have demonstrated decreases in exhaled NO with treatment of asthma, corresponding with improved symptoms and lung function. 30 , 31 However, the measurement of exhaled NO requires special equipment, which is not readily available at most primary care physician offices. Moreover, although titrating treatment to reach normal NO levels may provide a metric for anti‐inflammatory therapy, recent studies demonstrate that this treatment strategy does not necessarily reduce the rate of asthma exacerbations. 31 , 32 , 33 One potential mechanism for this shortcoming is the diversity of inflammatory processes at play in asthmatic airways in addition to those monitored by exhaled NO. In addition, exhaled NO is affected by various factors, including diet, time relative to exacerbations and spirometric testing, technique (rate of exhalation and airway resistance), and contamination of the sample with upper airway (nasal) secretions. 14 , 22 Thus, identification of other markers is of considerable interest.
Previous findings support the possibility that end products of protein bromination, for example, BrTyr, may be used as molecular fingerprints of eosinophil activation, 7 , 8 , 19 , 34 including in subjects with status asthmaticus. 19 Elevated levels of F2‐IsoPs, global markers of oxidative stress, have been reported in asthmatic subjects in some studies, 9 , 10 though the relationship of these markers to indices of asthma severity and alternative noninvasive markers of inflammation and oxidative stress such as NO and BrTyr have not been reported.
Despite serving as a marker for eosinophil‐mediated oxidative pathways, BrTyr did not correlate with percent eosinophils. This result emphasizes the notion that eosinophil‐mediated oxidation is not specifically a function of eosinophil concentration, but rather of eosinophil activation by a variety of inflammatory stimuli, which facilitates the respiratory burst and release of eosinophil peroxidase. 8 F2‐IsoPs also did not correlate with percent eosinophils; however, F2‐IsoPs are not specific markers of eosinophil‐mediated oxidative pathways, but rather are general markers of oxidative stress, which can be induced by myriad inflammatory cells and mediators. 16
The results of the present pilot study demonstrate that urinary levels of BrTyr and F2‐IsoPs (both 8‐epi‐PGF2α and 2,3‐dinor‐8‐epi‐PGF2α), in addition to exhaled NO, demonstrate significant associations with the presence of asthma. Of particular clinical relevance, higher levels of more than one of the three general classes of noninvasive markers (BrTyr, F2‐IsoPs, or NO) was associated with markedly increased odds of having asthma. Despite uniformly predicting asthma status, the markers measured in this study demonstrated variability in predicting airway obstruction and bronchodilator response. Higher levels of all markers except F2‐IsoPs were associated with increased odds of airway obstruction and/or reversibility of airway obstruction. Pooling the markers amplified this effect.
It is important to note that all participants had samples and clinical data collected only at baseline and not during an exacerbation. As all of the asthmatic patients were at a relatively stable baseline at the time of data collection, how these findings may vary during an acute exacerbation is not yet known. However, it should be noted that modest increases in urinary F2‐IsoPs have been reported in a small cohort of subjects following allergen challenge, 9 and dramatic increases in bronchoalveolar lavage levels of BrTyr have been observed following whole‐lung allergen challenge, segmental allergen challenge, and asthma exacerbation. 8 , 19 The majority of the asthmatic patients in this study were being treated with inhaled corticosteroids, which may have attenuated the strength of the relationships observed. In particular, the percentage of eosinophils was not significantly higher in asthmatic patients compared with controls, which may have been a result of inhaled corticosteroid use. 1 The study's sample size was not large enough to provide a range of normal values or shapes of the distributions of marker levels in control and asthmatic populations.
Conclusion
Findings from this pilot study indicate that urinary levels of BrTyr and F2‐IsoPs, in addition to exhaled NO levels, are associated with asthma. These results provide evidence supporting the potential utility of a panel of noninvasive markers of inflammation and oxidative stress in asthma. Additional studies are required to investigate more thoroughly the clinical utility of BrTyr and F2 ‐IsoPs in asthmatic patients. As discoveries of newer metabolic and inflammatory pathways in asthma emerge, additional markers may be identified to expand noninvasive panels and strengthen their predictive values. In addition, a better understanding of asthmas pathogenesis may allow researchers to pinpoint specific inflammatory pathways that are associated with particular clinical phenotypes, responses to therapeutic interventions, or demographic subgroups of asthmatic patients, leading to more specifically targeted anti‐inflammatory treatments. Indeed, although the availability of high‐sensitivity mass spectrometric techniques maybe currently limited in clinical settings, refinement of a sensitive and specific noninvasive panel of markers that directly reflects the underlying pathophysiologic milieu for the diagnosis of asthma and monitoring of (and possibly even predicting) therapeutic efficacy may prove to be a useful and cost‐effective adjunct to standard clinical care. It is clear that a shift in our current paradigm of asthma diagnosis and management is needed toward one that allows for objective monitoring of not only airway hyperreactivity but also airway inflammation. The use of a panel of noninvasive molecular markers of distinct inflammatory and oxidative processes holds promise for a fuller integration of the clinical picture of asthma with its pathobiologic and molecular foundations.
Conflict of Interest
Mr. Wedes, Dr. Khatri, and Dr. Zhang report no conflicts of interest. Dr. Wu reports that he hasbeen named as co‐inventor on patents held by the Cleveland Clinic relating to diagnostic tests in asthma and other inflammatory disorders. Dr. Wu also reports that he is employed by PrognostiX, Inc., a diagnostics company that developed the urinary bromotyrosine assay. Dr. Comhair reports that she has been named as co‐inventor on patents held by the Cleveland Clinic relating to diagnostic tests in asthma. Dr. Wenzel reports that she has no conflicts of interest. Dr. Teague reports that he has received speaking honoraria from Merck. Dr. Israel reports that he has no conflicts of interest. Dr. Erzurum reports that she participated in the Asthmatx Study of Bronchial Thermoplasty but received no compensation. Dr. Hazen reports that he has been named as co‐inventor on patents held by the Cleveland Clinic relating to diagnostic tests in asthma and other inflammatory disorders. Dr. Hazen reports that he is the scientific founder of PrognostiX, Inc., has received speaking honoraria from Pfizer, AstraZeneca, Merck, Merck Schering Plough, BioSite, Lilly, Wyeth, and Abbott, has received research grant support from Abbott Diagnostics, Pfizer, Merck, PrognostiX, Inc., Hawaii Biotech, ArgiNOx, Sanofi, and Takeda, and has received consulting fees from Abbott Diagnostics, Pfizer, PrognostiX Inc, Wyeth, BioPhysical, and AstraZeneca. No other disclosures were reported.
Acknowledgments
Supported by National Institutes of Health grants P01HL081064–020003,P01HL087018–020001, and R01 HL69170 and the Case Western Reserve University/Cleveland Clinic CTSA (1KL2RR024990 and 1UL1RR024989). Urinary bromotyrosine levels were determined by PrognostiX, Inc., Cleveland, OH.
References
- 1. NHLBI . Expert Panel Report 3: Guidelines for the diagnosis and management of asthma—full report. NHLBI , Bethesda , MD , USA , 2007. Available at: http://www.nhlbi.nih.gov/guidelines/asthma. Accessed February 10, 2009.
- 2. Comhair SA, Bhathena PR, Farver C, Thunnissen FB, Erzurum SC. Extracellular glutathione peroxidase induction in asthmatic lungs: evidence for redox regulation of expression in human airway epithelial cells. FASEB J. 2001; 15(1): 70–78. [DOI] [PubMed] [Google Scholar]
- 3. Comhair SA, Ricci KS, Arroliga M, Lara AR, Dweik RA, Song W, Hazen SL, Bleecker ER, Busse WW, Chung KF, Gaston B, Hastie A, Hew M, Jarjour N, Moore W, Peters S, Teague WG, Wenzel SE, Erzurum SC. Correlation of systemic superoxide dismutase deficiency to airflow obstruction in asthma. Am J Respir Crit Care Med. 2005; 172(3): 306–313. [DOI] [PMC free article] [PubMed] [Google Scholar]
- 4. Busse WW, Rosenwasser U. Mechanisms of asthma. J Allergy Gin Immunol. 2003; 111(3 Suppl) S799–S804. [DOI] [PubMed] [Google Scholar]
- 5. Rahman I, Morrison D, Donaldson K, MacNee W. Systemic oxidative stress in asthma, COPD, and smokers. Am J Respir Crit Care Med. 1996; 154(4 Pt 1): 1055–1060. [DOI] [PubMed] [Google Scholar]
- 6. Comhair SA, Bhathena PR, Dweik RA, Kavuru M, Erzurum SC. Rapid loss of superoxide dismutase activity during antigen‐induced asthmatic response. Lancet. 2000; 355(9204): 624. [DOI] [PubMed] [Google Scholar]
- 7. Wu W, Chen Y, Hazen SL. Eosinophil peroxidase nitrates protein tyrosyl residues. Implications for oxidative damage by nitrating intermediates in eosinophilic inflammatory disorders. J Biol Chem 1999; 274(36): 25933–25944. [DOI] [PubMed] [Google Scholar]
- 8. Wu W, Samoszuk MK, Comhair SA, Thomassen MJ, Farver CF, Dweik RA, Kavuru MS, Erzurum SC, Hazen SL. Eosinophils generate brominating oxidants in allergen‐induced asthma. J Clin Invest. 2000; 105(10): 1455–1463. [DOI] [PMC free article] [PubMed] [Google Scholar]
- 9. Dworski R, Roberts U, 2nd , Murray JJ, Morrow JD, Hartert TV, Sheller JR. Assessment of oxidant stress in allergic asthma by measurement of the major urinary metabolite of F2‐isoprostane, 15‐F2t‐lsoP (8‐iso‐PGF2alpha). Clin Exp Allergy. 2001; 31(3): 387–390. [DOI] [PubMed] [Google Scholar]
- 10. Paredi P, Kharitonov SA, Barnes PJ. Analysis of expired air for oxidation products. Am J Respir Crit Care Med. 2002; 166(12 Pt 2): S31‐S37. [DOI] [PubMed] [Google Scholar]
- 11. Dweik RA, Comhair SA, Gaston B, Thunnissen FB, Farver C, Thomassen MJ, Kavuru M, Hammel J, Abu‐Soud HM, Erzurum SC. NO chemical events in the human airway during the immediate and late antigen‐induced asthmatic response. Proc Natl Acad Sci USA. 2001; 98(5): 2622–2627. [DOI] [PMC free article] [PubMed] [Google Scholar]
- 12. Dweik RA, Laskowski D, Abu‐Soud HM, Kaneko F, Hutte R, Stuehr DJ, Erzurum SC. Nitric oxide synthesis in the lung. Regulation by oxygen through a kinetic mechanism. J Clin Invest. 1998; 101(3): 660–666. [DOI] [PMC free article] [PubMed] [Google Scholar]
- 13. Kharitonov SA, Yates D, Robbins RA, Logan‐Sinclair R, Shinebourne EA, Barnes PJ. Increased nitric oxide in exhaled air of asthmatic patients. Lancet. 1994; 343(8890): 133–135. [DOI] [PubMed] [Google Scholar]
- 14. Khatri SB, Hammel J, Kavuru MS, Erzurum SC, Dweik RA. Temporal association of nitric oxide levels and airflow in asthma after whole lung allergen challenge. J AppI Physiol. 2003; 95(1): 436–440. [DOI] [PubMed] [Google Scholar]
- 15. Khatri SB, Ozkan M, McCarthy K, Laskowski D, Hammel J, Dweik RA, Erzurum SC. Alterations in exhaled gas profile during allergen‐induced asthmatic response. Am J Respir Crit Care Med. 2001; 164(10 Pt 1): 1844–1848. [DOI] [PubMed] [Google Scholar]
- 16. Montuschi P, Kharitonov SA, Ciabattoni G, Corradi M, Van Rensen L, Geddes DM, Hodson ME, Barnes PJ. Exhaled 8‐isoprostane as a new non‐invasive biomarker of oxidative stress in cystic fibrosis. Thorax. 2000; 55(3): 205–209. [DOI] [PMC free article] [PubMed] [Google Scholar]
- 17. Colon‐Semidey AJ, Marshik P, Crowley M, Katz R, Kelly HW. Correlation between reversibility of airway obstruction and exhaled nitric oxide levels in children with stable bronchial asthma. Pediatr Pulmonol. 2000; 30(5): 385–392. [DOI] [PubMed] [Google Scholar]
- 18. Deykin A, Belostotsky O, Hong C, Massaro AF, Lilly CM, Israel E. Exhaled nitric oxide following leukotriene E(4) and methacholine inhalation in patients with asthma . Am J Respir Crit Care Med. 2000; 162(5): 1685–1689. [DOI] [PubMed] [Google Scholar]
- 19. MacPherson JC, Comhair SA, Erzurum SC, Klein DF, Lipscomb MF, Karuru MS, Samoszuk MK, Hazen SL. Eosinophils are a major source of nitric oxide‐derived oxidants in severe asthma: characterization of pathways available to eosinophils for generating reactive nitrogen species. J Immunol. 2001; 166(9): 5763–5772. [DOI] [PubMed] [Google Scholar]
- 20. Rahman I, MacNee W. Oxidative stress and regulation of glutathione in lung inflammation. Eur Respir J. 2000; 16(3): 534–554. [DOI] [PubMed] [Google Scholar]
- 21. Wedes SH, Zhang R, Wu W, Comhair SAA, Erzurum SC, Hazen SL. Urinary bromotyrosine and F2‐isoprostanes as noninvasive markers of airway inflammation in asthma [abstract]. Am J Respir Crit Care Med. 2007; 175: A152. [Google Scholar]
- 22. American Thoracic Society . Proceedings of the ATS workshop on refractory asthma. Current understanding, recommendations, and unanswered questions. Am J Respir Crit Care Med. 2000; 162:2341–2351. [DOI] [PubMed] [Google Scholar]
- 23. Moore WC, Bleecker ER, Curran‐Everett D, Erzurum SC, Ameredes BT, Bacharier L, Calhoun WJ, Castro M, Chung KF, Clark MP, Dweik RA, Fitzpatrick AM, Gaston B, Hew M, Hussain I, Jarjour NN, Israel E, Levy BD, Murphy JR, Peters SP, Teague WG, Meyers DA, Busse WW, Wensel SE; National Heart, Lung, Blood Institute's Severe Asthma Research Program . Characterization of the severe asthma phenotype by the National Heart, Lung, and Blood Institute's Severe Asthma Research Program. J Allergy Clin Immunol. 2007; 119(2): 405–413. [DOI] [PMC free article] [PubMed] [Google Scholar]
- 24. American Thoracic Society . Standardization of spirometry: 1994 update. Am J Respir Crit Care Med. 1994; 152: 1107–1136. [DOI] [PubMed] [Google Scholar]
- 25. ATS Workshop Proceedings . Exhaled nitric oxide and nitric oxide oxidative metabolism in exhaled breath condensate: executive summary. Am J Respir Crit Care Med. 2006; 173: 811–813. [DOI] [PubMed] [Google Scholar]
- 26. Fitzpatrick AM, Gaston BM, Erzurum SC, Teague WG. Features of severe asthma in school‐age children: atopy and increased exhaled nitric oxide. J Allergy Clin Immunol. 2006; 118(6): 1218–1225. [DOI] [PMC free article] [PubMed] [Google Scholar]
- 27. Silvestri M, Sabatini F, Sale R, Defilippi AC, Fregonese L, Battistini E, Biraghi MG, Rossi GA. Correlations between exhaled nitric oxide levels, blood eosinophilia, and airway obstruction reversibility in childhood asthma are detectable only in atopic individuals. Pediatr Pulmonol. 2003; 35(5): 358–363. [DOI] [PubMed] [Google Scholar]
- 28. Simpson A, Custovic A, Pipis S, Adisesh A, Faragher B, Woodcock A. Exhaled nitric oxide, sensitization, and exposure to allergens in patients with asthma who are not taking inhaled steroids. Am J Respir Crit Care Med. 1999; 160(1): 45–49. [DOI] [PubMed] [Google Scholar]
- 29. Silkoff PE. Noninvasive measurement of airway inflammation using exhaled nitric oxide and induced sputum. Current status and future use. Clin Chest Med. 2000; 21(2): 345–360. [DOI] [PubMed] [Google Scholar]
- 30. Kharitonov SA, Yates DH, Barnes PJ. Inhaled glucocorticoids decrease nitric oxide in exhaled air of asthmatic patients. Am J Respir Crit Care Med. 1996; 153(1): 454–457. [DOI] [PubMed] [Google Scholar]
- 31. Smith AD, Cowan JO, Brassett KP, Herbison GP, Taylor DR. Use of exhaled nitric oxide measurements to guide treatment in chronic asthma [see comment]. N Engi J Med. 2005; 352(21): 2163–2173. [DOI] [PubMed] [Google Scholar]
- 32. Pijnenburg MW, Bakker EM, Hop WC, De Jongste JC. Titrating steroids on exhaled nitric oxide in children with asthma: a randomized controlled trial. Am J Respir Crit Care Med. 2005; 172(7): 831–836. [DOI] [PubMed] [Google Scholar]
- 33. Shaw DE, Berry MA, Thomas M, Green RH, Brightling CE, Wardlaw AJ, Pavord ID. The use of exhaled nitric oxide to guide asthma management: a randomized controlled trial. Am J Respir Crit Care Med. 2007; 176(3): 231–237. [DOI] [PubMed] [Google Scholar]
- 34. Wu W, Chen Y, D’Avignon A, Hazen SL. 3‐Bromotyrosine and 3,5‐dibromotyrosine are major products of protein oxidation by eosinophil peroxidase: potential markers for eosinophil‐dependent tissue injury in vivo. Biochemistry. 1999; 38(12): 3538–3548. [DOI] [PubMed] [Google Scholar]