Abstract
Recent identification of a counterregulatory axis of the renin-angiotensin system, called angiotensin-converting enzyme 2-angiotensin-(1–7) [ANG-(1–7)]-Mas receptor, may offer new targets for the treatment of renal fibrosis. We hypothesized that therapy with ANG-(1–7) would improve glomerulosclerosis through counteracting ANG II in experimental glomerulonephritis. Disease was induced in rats with the monoclonal anti-Thy-1 antibody, OX-7. Based on a three-dose pilot study, 576 μg·kg−1·day−1 ANG-(1–7) was continuously infused from day 1 using osmotic pumps. Measures of glomerulosclerosis include semiquantitative scoring of matrix proteins stained for periodic acid Schiff, collagen I, and fibronectin EDA+ (FN). ANG-(1–7) treatment reduced disease-induced increases in proteinuria by 75%, glomerular periodic acid Schiff staining by 48%, collagen I by 24%, and FN by 25%. The dramatic increases in transforming growth factor-β1, plasminogen activator inhibitor-1, FN, and collagen I mRNAs seen in disease control animals compared with normal rats were all significantly reduced by ANG-(1–7) administration (P < 0.05). These observations support our hypothesis that ANG-(1–7) has therapeutic potential for reversing glomerulosclerosis. Several results suggest ANG-(1–7) acts by counteracting ANG II effects: 1) renin expression in ANG-(1–7)-treated rats was dramatically increased as it is with ANG II blockade therapy; and 2) in vitro data indicate that ANG II-induced increases in mesangial cell proliferation and plasminogen activator inhibitor-1 overexpression are inhibited by ANG-(1–7) via its binding to a specific receptor known as Mas.
Keywords: renin-angiotensin system, Mas receptor, renal fibrosis
activation of the renin-angiotensin system (RAS) and generation of angiotensin (ANG) II have long been known to play a crucial role in the pathogenesis of renal fibrosis (8, 23). Formation of ANG II involves two main steps: the aspartyl protease renin cleaves angiotensinogen to form the decapeptide ANG I, and ANG I is then converted by ANG-converting enzyme (ACE) to ANG II. ANG II interacts with its type 1 (AT1) and type 2 (AT2) receptors (AT1R and AT2R) on kidney cells to induce responses that affect the structure and function of the kidney. Numerous experimental studies, using pharmacological or genetic means to manipulate the action of the classic axis of RAS, the ACE-ANG II-AT1R axis, as well as clinical studies, have shown that blockade of this axis reduces renal injury and fibrosis (19, 35, 46). Therapy with an ACE inhibitor (ACEi) or an AT1R blocker (ARB) is now the first-line strategy to reduce the progression of renal disease.
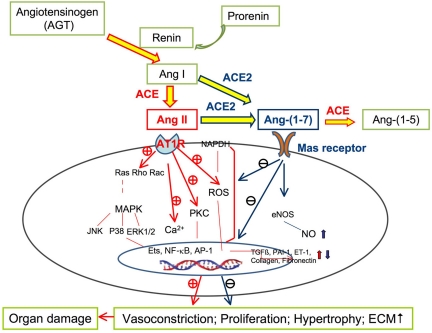
Recently, a new axis of RAS, called ACE2-ANG-(1–7)-Mas receptor axis, has been established (as summarized in Fig. 9) (4, 31, 32). In this axis, ANG I is converted to ANG-(1–7) by the catalytic activity of ACE2. ACE2 is a homolog of ACE that can directly form ANG-(1–7) through hydrolysis of ANG II or indirectly through hydrolysis of ANG I to ANG-(1–9), with subsequent conversion to ANG-(1–7) by ACE. ANG-(1–7) is then further metabolized by ACE to ANG-(1–5) (31). It has been shown that ANG-(1–7) has its own unique receptor, Mas, a G-protein-coupled receptor identified originally as a protooncogene (33). It is likely that actions of ACE and ACE2 in balancing ANG II and ANG-(1–7) expression influence the RAS in the kidney. Kidney diseases have been associated with a reduction in renal ACE2 expression. Low ACE2 levels have been reported in established renal disease, in the 5/6ths nephrectomy model of renal insufficiency, and in diabetic animal models and patients where ACE is significantly increased (15, 20, 29, 43, 47). The resulting high ACE-to-ACE2 ratio in diseased kidney may result in accelerated formation and accumulation of ANG II and increased catabolism of ANG-(1–7), thereby facilitating the damaging effects of ANG II in the progression of renal disease. Conversely, higher ACE2 relative to ACE may decrease ANG II and increase ANG-(1–7), facilitating ANG-(1–7) generation, which, in turn, may provide protection against the development of renal disease.
Fig. 9.
Schematic of how ANG-(1–7) may protect against ANG II-induced organ damage. AT1 receptor was stimulated by ANG II and the subsequent cellular signaling, including NAPDH oxidase activation, reactive oxygen species (ROS) generation, protein kinase C (PKC) activation, calcium (Ca2+) loading, and phosphorylation of mitogen-activated protein kinase (MAPK). Many deleterious effects of ANG II in organ damage are implicated, which can be reduced or prevented by ANG-(1–7) through stimulating vasodilatation and decreasing proliferation, hypertrophy, and fibrosis. Endothelins (ETs), nuclear factor-κ light-chain-enhancer of activated B cells (NF-κB), and activator protein-1 (AP-1) are nuclear transcription factors. NO, nitric oxide; eNOS, endothelial nitric oxide synthase; ET-1, endothelin 1; +, stimulates. −, inhibits.
Increasing data indicate that ANG-(1–7) acts as a vasodilator, which antagonizes AT1R stimulation-mediated vasoconstriction (5, 18, 38). Infusion of exogenous ANG-(1–7) or oral administration of AVE-0991, a nonpeptide analog of ANG-(1–7), not only attenuated heart failure, but also reversed ANG II-induced cardiac myocyte hypertrophy and interstitial fibrosis (7, 9, 37). Furthermore, the inhibition of cellular signaling in the cardiovascular system by ANG-(1–7) was blocked by antisense oligonucleotides against Mas (37). Mas-deficient mice also showed an impairment of cardiac functions and increased collagen and fibronectin (FN) content in heart tissue (30), suggesting that these cardioprotective effects of ANG-(1–7) are at least partially mediated by stimulation of the Mas receptor, independent of blood pressure. Taken together, these results suggest that ANG-(1–7) may act as a counterregulator of ANG II, producing a blood-pressure-lowering effect and an organ-protective effect.
ANG-(1–7) has been measured in the kidney. It is present in concentrations comparable to ANG II (25). The role of ANG-(1–7) in the regulation of renal hemodynamics and pathogenesis of renal fibrosis is incompletely understood, and data are conflicting (5). However, ANG II blockade with ACEi or ARBs increases endogenous ANG-(1–7) significantly (18), suggesting that ANG-(1–7) may be responsible for at least some of the benefit of ACEi and ARB treatment in renal disease. At this point, we hypothesized that therapy with ANG-(1–7) would ameliorate glomerulosclerosis in the anti-Thy-1 rat nephritis model. In vitro studies on renal mesangial cells (MCs) were then designed to test whether addition of ANG-(1–7) could directly limit the profibrotic effects of ANG II on MCs. Investigation of this hypothesis is of clinical relevance, because it should provide direction for further studies determining the efficacy of adding ANG-(1–7) therapy to ACEi or ARB therapy.
MATERIALS AND METHODS
Reagents
ANG-(1–7) and the inactive analog (d-Ala7)-ANG-(1–7) were purchased from Bachem Biosciences (Torrance, CA). The monoclonal anti-Thy-1 antibody, OX-7, was obtained from NCCC, Biovest International (Minneapolis, MN). Unless specified, all other reagents were purchased from Sigma Chemical (St. Louis, MO).
Study 1. In vivo Studies of the Therapeutic Effect of ANG-(1–7) in Experimental Glomerulonephritis
Animals.
Experiments in vivo were performed on male Sprague-Dawley rats (180–200 g) obtained from the SASCO colony of Charles River Laboratories (Wilmington, MA). Animal housing and care were in accordance with the National Institutes of Health Guide for the Care and Use of Laboratory Animals. The animal studies were approved by the Animal Care Committee of University of Utah. Glomerulonephritis was induced by tail vein injection of 1.75 mg/kg of the monoclonal anti-Thy-1 antibody, OX-7. OX-7 binds to a Thy-1-like epitope on the surface of MCs, causing immune-mediated, complement-dependent cell lysis, followed by exuberant matrix synthesis and deposition. Normal control animals were injected with the same volume of PBS (14).
Experimental design.
Groups of six rats were assigned and treated as normal control, disease control, and nephritic rats treated with ANG-(1–7) at doses of 144, 288, and 576 μg·kg−1·day−1, respectively, based on previous reports (9, 17, 21). ANG-(1–7) was administrated by continuous subcutaneous infusion via osmotic pumps (model 2004, Alzet, Cupertino, CA) implanted under the dorsal skin of rats from day 1 (24 h after OX-7 injection) to day 5. Untreated normal control and nephritic rats served as control. The urinary protein excretion was measured by the Bradford method (Bio-Rad Protein Assay; Bio-Rad Laboratories Hercules, CA) on urine collected from rats housed in metabolic cages for 24 h from day 5 to day 6.
On day 6, animals were anesthetized, 5–10 ml of blood were drawn from the lower abdominal aorta, and kidneys were perfused with 30 ml ice-cold PBS. For histological examination, cortical tissue was snap frozen for frozen sectioning or fixed in 10% neutral-buffered formalin for periodic acid Schiff (PAS) staining. Glomeruli were isolated by graded sieving, as described previously (27). Five thousand glomeruli per milliliter per well were resuspended and cultured in serum-free RPMI 1640, supplemented with 0.1 U/ml insulin, 100 U/ml penicillin, 100 μg/ml streptomycin, and 25 mmol/l HEPES buffer. After a 48-h incubation at 37°C/5% CO2, the supernatant was harvested and stored at −70°C until analysis of glomerular production of transforming growth factor-β1 (TGF-β1) by ELISA, as described previously (27).
Plasma renin activity.
Plasma renin activity was determined as the ability of a sample to generate ANG I from nephrectomized rat serum substrate (containing angiotensinogen) as described (14). ANG I generated was quantitated using a commercially available RIA kit (Phoenix Pharmaceuticals, Belmont, CA).
Histological analyses.
All microscopic examinations were performed in a blinded fashion. Three-micrometer sections of paraffin-embedded tissues were stained with PAS. The images (×400 magnification) of 20 random glomeruli per slide were captured using a Nikon D50 digital camera (Inkley's-Ritz Camera, Salt Lake City, UT, www.ritzcamera.com; Nikon Capture 4, version 4.3, Nikon, Melville, NY), and the area of PAS-positive material in each glomerulus was quantified using a computer-assisted color image analysis system (ImageJ 1.38 for Windows; National Institutes of Health, http://rsb.info.nih.gov). The PAS-positive material area in the mesangium was divided by that in the total glomerular tuft area to obtain the rates of mesangial matrix, as indicated previously (11). Immunofluorescent (IF) staining for matrix proteins was performed on frozen sections and evaluated in 20 glomeruli from each rat. The percentage of positive area occupying each glomerulus was rated on a scale from 0 to 4, where 0 represents no positive staining; 1+ represents positive staining of <25% of the glomerulus; and 2+, 3+, and 4+ represent positive staining of 25–50, 50–75, and >75% of the glomerulus, respectively. A whole kidney average positive staining for matrix protein was obtained by averaging scores from all glomeruli (12).
RNA preparation and Northern hybridization.
Total RNA was extracted immediately from isolated glomeruli using Trizol Reagent (Gibco BRL, Gaithersburg, MD), according to the manufacturer's instructions. RNA from each group was pooled, and Northern analysis of TGF-β1, plasminogen activator inhibitor-1 (PAI-1), FN, and type I collagen (Col I) mRNA expression was performed as previously described (12). Three blots per probe were performed. Autoradiographic films were scanned on a Bio-Rad GS-700 imaging densitometer (Bio-Rad Laboratories, Hercules, CA). For quantitative densitometric measurements of Northern blots, all of the signals were normalized compared with GAPDH levels used for equal loading. Glomerular renin, ACE, and ACE2 mRNA expression was determined by real-time RT/PCR, as described below.
Study 2. In Vitro Studies of the Effect of ANG-(1–7) on ANG II-Induced Cell Proliferation and PAI-1 Overexpression by MCs
Cell culture.
Primary MCs derived from intact rat glomeruli of 4- to 6-wk-old male Sprague-Dawley rats were used between passages 5 and 8. Cells were maintained in RPMI 1640 medium supplemented with 20% fetal bovine serum (FBS) (Hyclone Laboratory, Logan, UT), 100 U/ml penicillin, 100 μg/ml streptomycin, 0.1 U/ml insulin, and 25 mM HEPES buffer at 37°C in a 5% CO2 incubator. Subconfluent cells seeded on six-well plates were made quiescent in serum-free RPMI 1640 medium for 48 h before experimental studies.
ANG-(1–7) binding assay.
To determine specific binding of ANG-(1–7) to rat MCs, initial experiments were first performed to determine whether rat MCs express Mas gene by RT-PCR, identified as the receptor for ANG-(1–7). The binding studies were then performed on intact adherent rat MCs grown to confluence on 96-well culture plates, as described previously (16). Cells were incubated with a rhodamine-labeled ANG-(1–7) (Phoenix Pharmaceuticals, Belmont, CA) for 90 min at 4°C under serum-free medium. Saturation binding assay was performed with 0.5–10 nM rhodamine-labeled ANG-(1–7). Competition binding assay was performed by incubating 1.95 nM labeled ANG-(1–7) with increasing concentrations (10−10-10−5 M) of unlabeled ANG-(1–7). After incubation, cells were washed with cold PBS at 4°C and then submitted to a fluorescence microplate reader (BioTek, Winooski, Vermont). The nonspecific binding was determined in the presence of an overdose of unlabeled ANG-(1–7) (10−5 M) and subtracted from each assay. The binding parameters were generated with GraphPad Prism software (version 3.00, GraphPad Prism Software, San Diego, CA).
Cellular proliferation.
MC mitotic activity was evaluated using the MTT [3-(4,5-dimethylthiazol-2-yl)-2, 5-diphenyltetrazolium bromide] cell proliferation assay, according to the manufacturer's instructions, as described (13). The number of viable cells corresponds to the amount of MTT reduced by mitochondrial dehydrogenase in living cells. A preliminary study confirmed a significant correlation between counted cell numbers and optical density values at 520 nm. Each experiment was typically performed with n = 8 separate wells of MCs in 96-well plates under identical conditions. The administration of 10% FBS was used as the positive control.
PAI-1 Western blot analysis.
After 36-h treatment, the cultured cell supernatant was harvested and centrifuged immediately at 2,000 rpm for 5 min to remove any floating cells or fragments. The equal volume of supernatant (40 μl) without concentration mixed with 13.3 μl of 4× loading buffer was then separated by 10% Tris-glycine gel electrophoresis (Novex Tris-Glycine Gels, Invitrogen Life Technologies, Carlsbad, CA) and transferred to a 0.45-μm immobilon-P transfer membrane (Millipore, Bedford, MA). The subsequent protein immunohybridization was performed as previously described (10). The rabbit-anti-rat PAI-1 IgG (stock solution: 250 μg/ml; American Diagnostica, Greenwich, CT, diluted 1:200 in 5% BSA in TBS/0.1% Tween-20 with 0.02% NaN3) was used as the primary antibody. The goat anti-rabbit horseradish peroxidase (stock solution: 400 μg/ml; Santa Cruz Biotechnology, Santa Cruz, CA, diluted 1:2,000 in 5% nonfat milk powder in Tris-buffered saline) was used as the secondary antibody. Bound antibodies on the membrane were detected by developing the blots in ECL Western blotting detection reagents (Amersham Pharmacia Biotech, Piscataway, NJ) for 1 min. Quantitation of the bands on autoradiograms was performed using a Bio-Rad GS-700 imaging densitometer (Bio-Rad Laboratories, Hercules, CA).
Cellular RNA isolation and real-time RT-PCR.
Total cellular RNA was isolated immediately from cultured MCs using Trizol Reagent (Gibco BRL, Gaithersburg, MD), according to the manufacturer's instructions. Two micrograms of total RNA were reverse-transcribed using the superscript III first-stand synthesis system for RT-PCR kit (Invitrogen). Real-time RT-PCR was performed using a SYBR green dye I (Applied Biosystems, Foster City, CA) with the ABI 7900 Sequence Detection System (PE Applied Biosystems). cDNA was first denatured at 95°C for 15 min and then amplified through 40 amplification cycles, according to the manufacturer's protocol as follows: denatured at 95°C for 15 s, and annealed/extended at 60°C for 30 s. Fluorescence signals were recorded in each cycle. Relative quantitation of gene expression was carried out using the standard curve method and analyzed with RQ-manager 1.2 (ABI 7900 Sequence Detection System, Applied Biosystems). Samples were run as triplicates in separate tubes to permit quantification of the target gene normalized to GAPDH used for equal loading. Sequences of primers used are listed in Table 1. The specificity of the PCR products was confirmed on a 1.5% agarose gel by showing a specific single band with the expected size.
Table 1.
Primers used for real time RT-PCR
| Gene | Primer | Location (Complementary to Nucleotides) | Sequence 5′-3′ |
|---|---|---|---|
| Rattus ACE (NM_012544) | Forward | 2428–2447 | GAG CCA TCC TTC CCT TTT TC |
| Reverse | 2674–2693 | CCA CAT GTT CCC TAG CAG GT | |
| Rattus ACE2 (NM_001012006) | Forward | 168–187 | GGA GAA TGC CCA AAA GAT GA |
| Reverse | 429–448 | CGT CCA ATC CTG GTT CAA GT | |
| Rattus Renin (NM_012642) | Forward | 811–834 | GAT CAC CAT GAA GGG GGT CTC TGT |
| Reverse | 1061–1084 | GTT CCT GAA GGG ATT CTT TTG CAC | |
| Rattus PAI-1 (M24067) | Forward | 681–700 | TGG TGA ACG CCC TCT ATT TC |
| Reverse | 909–928 | GAG GGG CAC ATC TTT TTC AA | |
| Rattus GAPDH (NM_017008) | Forward | 29–48 | AGA CAG CCG CAT CTT CTT GT |
| Reverse | 151–170 | TTC CCA TTC TCA GCC TTG AC |
ACE, angiotensin-converting enzyme; PAI-1, plasminogen activator inhibitor-1.
Statistical Analysis
All data are expressed as means ± SD. Statistical analyses of differences between the groups were performed by ANOVA and subsequent Student-Newman-Keuls or Dunnett testing for multiple comparisons. Comparisons with a P value < 0.05 were considered significantly different. In study 1, the disease-induced increase in a variable was defined as the mean value for the disease control group minus the mean value of the normal control group (100%). The percent reduction in disease severity in an ANG-(1–7)-treated group was calculated as follows: {1 − [ANG-(1–7)-treated group mean − Normal control group mean]/[Disease control group mean − Normal control group mean]} × 100. In study 2, duplicate wells were analyzed for each experiment, and each experiment was performed independently a minimum of three times.
RESULTS
Study 1: Therapeutic Efficacy of ANG-(1–7)
Rat body weight.
There were no significant differences among all animal groups in body weight during the experiment (Table 2).
Table 2.
Body weight
| Group | Body Weight on Day of Injection | Body Weight on Day of Sacrifice |
|---|---|---|
| NC | 240 ± 5 | 271 ± 11 |
| DC | 239 ± 9 | 268 ± 15 |
| Dose 1 | 241 ± 5 | 268 ± 6 |
| Dose 2 | 240 ± 5 | 267 ± 9 |
| Dose 3 | 243 ± 7 | 263 ± 6 |
Values are means ± SD in g; n = 6 in each group. NC, normal control rats; DC, untreated diseased rats; Dose 1, Dose 2, and Dose 3: diseased rats treated with angiotensin-(1–7) at doses of 144, 288, and 576 μg·kg−1·day−1 respectively.
Dose effect of ANG-(1–7) on glomerular expression of mRNAs for TGF-β1, PAI-1, FN, and Col I.
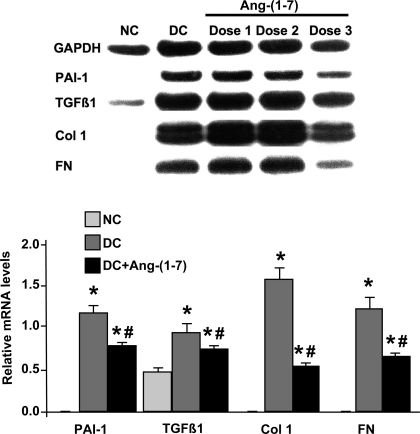
A pilot study was first carried out to determine an effective dose of ANG-(1–7) in nephritic rats by measuring the reduction in glomerular mRNA expression after treatment. As shown in Fig. 1, glomerular mRNA analysis revealed a robust increase in TGF-β1, PAI-1, FN, and Col I mRNA expression in disease control rats compared with normal rats, characteristic of anti-Thy-1 nephritis (27). Among the three doses of ANG-(1–7), only the high dose of 576 μg·kg−1·day−1 significantly reduced the levels of TGF-β1, PAI-1, FN, and Col I mRNAs, by 32, 42, 65, and 47%, respectively (P < 0.01). Therefore, the dose of 576 μg·kg−1·day−1 was chosen as an effective dose of ANG-(1–7) in this disease model. Other measures of disease severity were analyzed in the group treated with this dose of ANG-(1–7).
Fig. 1.
Effect of angiotensin (ANG)-(1–7) treatment on glomerular mRNA expression in anti-Thy-1 nephritis at day 6. Top: representative northern blot is shown. Bottom: the relative levels of glomerular mRNA expression of transforming growth factor (TGF)-β1, plasminogen activator inhibitor-1 (PAI-1), fibronectin (FN), and collagen type I (Col I) were standardized to GAPDH mRNA levels. Dose 1, Dose 2, and Dose 3: diseased rats treated with ANG-(1–7) [DC+ANG-(1–7)] at doses of 144, 288, and 576 μg·kg−1·day−1, respectively. *P < 0.05 vs. normal control (NC). #P < 0.05 vs. disease control (DC).
Effects of ANG-(1–7) on urinary volume and urinary protein excretion in anti-Thy-1 nephritis.
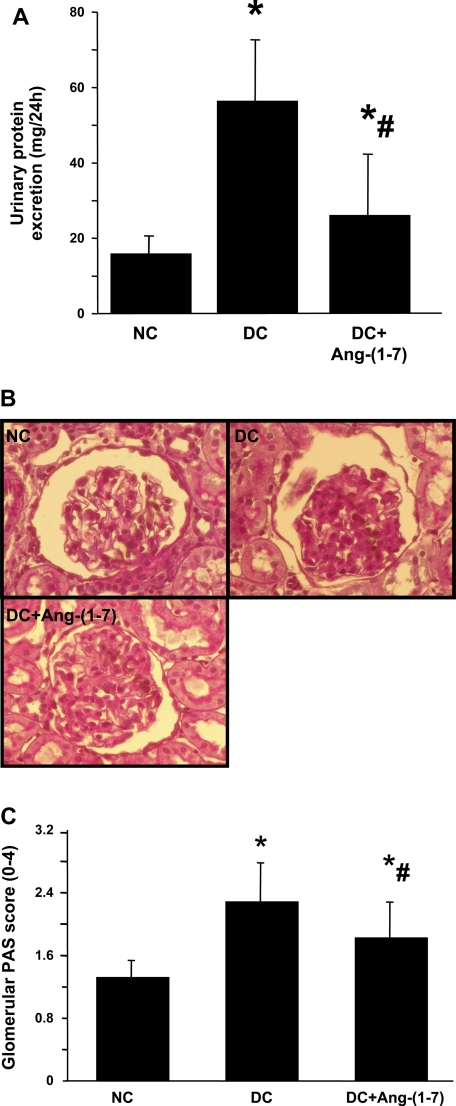
Twenty-four-hour urine and urinary protein excretions were measured from day 5 to day 6. Nephritic rats exhibited a similar urinary volume for 24 h compared with normal rats (12.2 ± 2.68 vs. 12.3 ± 3.88 ml/rat, P > 0.05), but infusion of ANG-(1–7) resulted in significant increases in urinary volume compared with untreated disease rats (25.6 ± 12.58 vs. 12.2 ± 2.68 ml/rat, P < 0.02). As shown in Fig. 2A, disease induced a dramatic increase in urinary protein excretion, and this induction of urinary protein excretion was reduced 75.6% by ANG-(1–7) treatment (26 ± 16 vs. 57 ± 15 mg/24 h, P < 0.05).
Fig. 2.
Effect of ANG-(1–7) treatment on urinary protein excretion (A) and glomerular matrix protein accumulation (B and C). A: 24-h urinary protein excretion from days 5 and 6. B: representative photomicrographs of glomeruli from NC, DC, and DC+ANG-(1–7)-treated nephritic rats at day 6. C: graphic representation of glomerular matrix score. *P < 0.05 vs. NC. #P < 0.05 vs. DC.
PAS staining.
Representative glomeruli stained with PAS are shown in Fig. 3B. The glomeruli from the disease control rats showed marked accumulation of extracellular matrix (ECM) expressed as PAS-positive material at day 6 (Fig. 2B, DC) compared with normal glomeruli (Fig. 2B, NC). Treatment with ANG-(1–7) resulted in much less mesangial matrix accumulation in glomeruli at day 6 [Fig. 2B, DC+ANG-(1–7)]. Figure 2C shows a graphical representation of the mean ± SD of PAS matrix score for each group. PAS score increased from 1.31 ± 0.2 in normal control rats to 2.28 ± 0.48 in disease control rats as a result of nephritis. ANG-(1–7) treatment decreased matrix score significantly (P < 0.05) from 2.28 ± 0.48 in the disease control group to 1.82 ± 0.44. This is a 47% reduction in the disease-induced increase in PAS staining score.
Fig. 3.
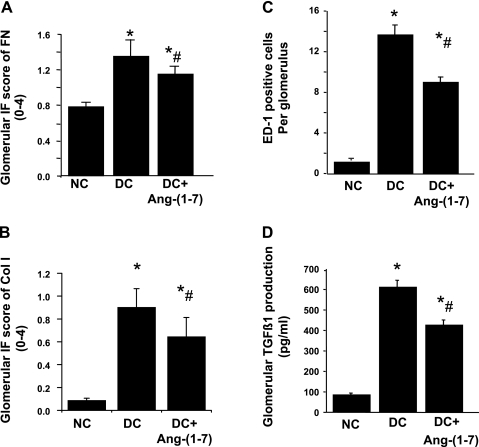
Glomerular inmmunofluorescent staining score for extracellular matrix (ECM) proteins (A and B), number of monocytes/macrophages infiltrating glomeruli (C), and glomerular production of TGF-β1 (D) in anti-Thy-1 nephritis at day 6. IF, immunofluorescent. *P < 0.05 vs. NC. #P < 0.05 vs. DC.
IF staining.
The results of the semiquantitative analysis of IF staining for matrix proteins are shown in Fig. 3. Compared with the disease control group, the staining score was significantly lower in the ANG-(1–7)-treated group at day 6 for FN-EDA+ (1.34 ± 0.18 vs. 1.14 ± 0.08; P < 0.01; Fig. 3A) and Col I (0.90 ± 0.16 vs. 0.64 ± 0.16; P < 0.01; Fig. 3B). These represent decreases in disease-induced ECM accumulation of 35% for FN and 31% for Col I.
Effects of ANG-(1–7) on monocyte/macrophages infiltration in anti-Thy-1 nephritis.
The number of monocyte/macrophages was determined in kidney sections from all rats in each group (Fig. 3C). Nephritic glomeruli from disease control rats contained higher numbers of monocyte/macrophages than did glomeruli from normal control rats (13.6 ± 0.7 vs. 0.98 ± 0.1, P < 0.001). The average number of monocyte/macrophages per glomerular cross section in nephritic rats treated with ANG-(1–7) was 37% lower than that for disease controls (8.9 ± 0.5 vs. 13.6 ± 0.7, P < 0.05).
Effects of ANG-(1–7) on glomerular production of TGF-β1.
OX-7 administration resulted in 7.3-fold increases in TGF-β1 production of glomeruli isolated at day 6 (Fig. 3D). TGF-β1 production was reduced with ANG-(1–7) by 34% (P < 0.01).
Plasma renin activity and renal renin, ACE, and ACE2 mRNA expression in anti-Thy-1 nephritis.
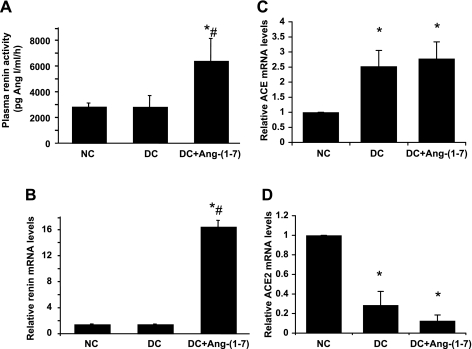
As shown in Fig. 4A, there were no significant differences in plasma renin activity between nephritic and normal rats. Administration of ANG-(1–7) resulted in a significant increase in plasma renin activity by 2.3-fold (P < 0.05). Similarly, glomerular renin mRNA expression did not differ between nephritic rats and normal rats. Administration of ANG-(1–7) resulted in a dramatic 16-fold increase in glomerular renin mRNA expression at day 6 (Fig. 4B). Disease significantly increased ACE expression by 2.5-fold (Fig. 4C), while ACE2 expression was dramatically decreased by 3.5-fold in nephritic glomeruli compared with normal glomeruli (Fig. 4D) (both, P < 0.01). The ratio of ACE to ACE2 was 8.8-fold higher in diseased compared with normal rats. Glomerular ACE2 mRNA expression was further reduced in ANG-(1–7)-treated nephritic rats, but the decrease did not reach statistical significance (P = 0.071). Administration of ANG-(1–7) had no effect on glomerular ACE mRNA expression compared with untreated disease group (P = 0.066).
Fig. 4.
Effect of ANG-(1–7) treatment on plasma renin activity and renal renin and ANG-converting enzyme (ACE)/ACE2 mRNA expression in anti-Thy-1 nephritis at day 6. A: plasma renin activity at day 6. Glomerular mRNA expression of renin (B), ACE (C), and ACE2 (D) was measured by real-time RT-PCR and standardized to GAPDH levels. Relative values are expressed relative to the NC, which was set at unity. *P < 0.05 vs. NC. #P < 0.05 vs. DC.
Study 2: Effects of ANG-(1–7) on the Action of ANG II in Vitro in Cultured MCs
Characteristics of ANG-(1–7) binding to cultured MCs.
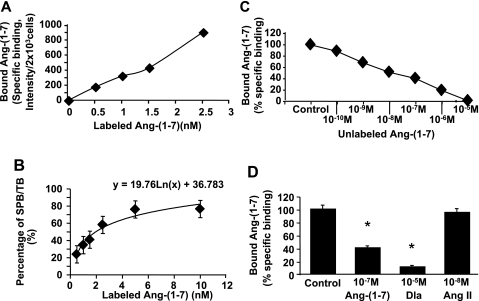
Using RT-PCR analysis, we showed that that Mas mRNA was present in rat MCs (data not shown). Incubation of MCs with labeled ANG-(1–7) at 4°C revealed that ANG-(1–7) bound MCs in a concentration-dependent manner (Fig. 5A). This binding was significantly inhibited by the unlabeled ANG-(1–7) in a dose-dependent manner (Fig. 5C). A similar inhibition of ANG-(1–7)-specific binding was further observed with the inactive analog of ANG-(1–7) acting as the Mas receptor antagonist, (d-Ala7)-ANG-(1–7) (Dla) (44), but not with ANG II (Fig. 5D). Scatchard analysis from both specific binding data revealed the existence of one high-affinity binding site of ANG-(1–7) with an apparent Kd = 1.95 nM for MCs (around 2 × 10³ cells per well, determined by dye counting) (Fig. 5B). These studies confirm the presence of a specific, Mas receptor-mediated binding site for ANG-(1–7) on these cells.
Fig. 5.
Binding characteristics of rhodamine-labeled ANG-(1–7) to rat mesangial cells (MCs). A: saturation binding curve of labeled ANG-(1–7). B: percentage of specific binding (SPB) in total binding (TB) of labeled ANG-(1–7). C: competition for labeled ANG-(1–7) binding by unlabeled ANG-(1–7). D: effect of different agents on labeled ANG-(1–7) binding to rat MCs. *P < 0.05 vs. specific binding control of ANG-(1–7) (control), which was set up 100%. Dla, (d-Ala7)-ANG-(1–7).
Effects of ANG-(1–7) on ANG II-induced MC proliferation.
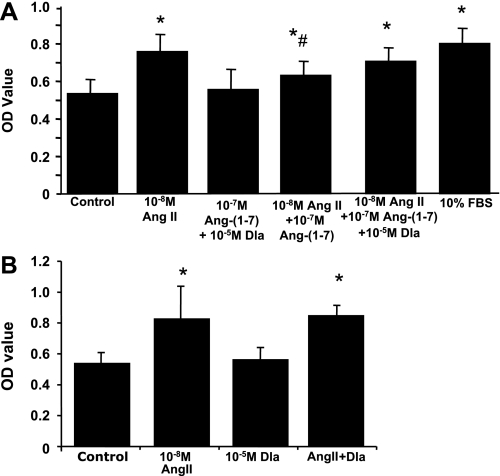
In a previous report (13), our laboratory observed that primary cultures of MCs in RPMI 1640 with 10% FBS grew quickly, reaching ∼90% confluence by 24 h. Addition of ANG II in serum-free RPMI 1640 increased cell proliferation rates, seen in Fig. 6 (left 2 bars). In contrast, addition of ANG-(1–7) at 10−7 M had no effect on MC proliferation. When both ANG-(1–7) and ANG II were added together for 24 h, the cell proliferation seen with ANG II was partially inhibited by ANG-(1–7). This inhibition was significantly reversed by additional coadministration of 10−5 M Dla, while Dla alone or together with ANG-(1–7) had no effect on MC proliferation, or Dla alone had no effect on ANG II-induced cell proliferation (Fig. 6). These results indicate that ANG-(1–7) inhibits ANG II-mediated MC proliferation via the Mas receptor.
Fig. 6.
Effect of ANG-(1–7) (A) or Dla (B) on ANG II-induced rat MC proliferation. Quiescent rat MCs were treated with or without 10−7 M of ANG-(1–7), or 10−5 M Dla, or 10−7 M of ANG-(1–7) plus 10−5 M Dla, in addition to 10−8 M of ANG II for 24 h (n = 8). The administration of 10% FBS was used as the positive control. The proliferative response was evaluated by 3-(4, 5-dimethylthiazol-2-yl)-2, 5-diphenyltetrazolium bromide (MTT) assay. Results were expressed as the mean optical density (OD) of MTT absorbance in control and treated wells. *P < 0.05 compared with the untreated control. #P < 0.05 compared with the ANG II alone treated cells.
Effects of ANG-(1–7) on ANG II-induced PAI-1 mRNA expression and protein production by MCs.
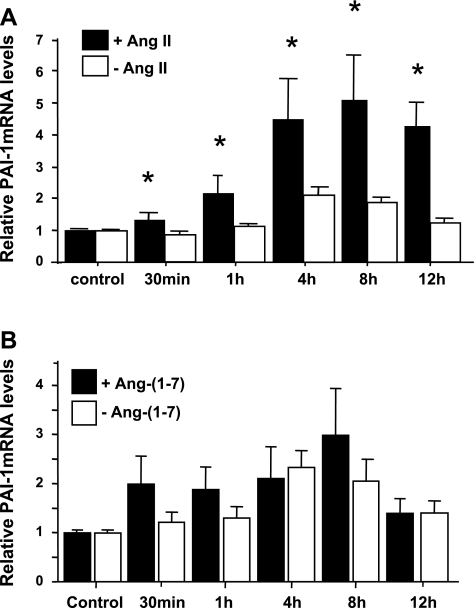
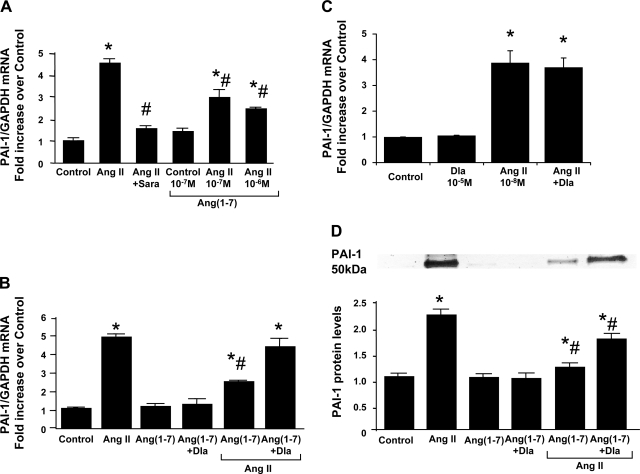
PAI-1 mRNA expression was elevated significantly by 10−8 M ANG II from 1 h to at least 12 h (with a peak of 5-fold at 8 h) (Fig. 7A). In contrast, 10−7 M ANG-(1–7) had no significant effect on PAI-1 mRNA expression compared with medium alone (Fig. 7B). The 8-h incubation was then chosen for further treatments with ANG II. Rat MCs cotreated with 10−8 M ANG II and 10−7-10−6 M ANG-(1–7) for 8 h showed significantly reduced induction of PAI-1 mRNA with ANG II treatment, and this effect is dependent on the dose of ANG-(1–7) added (Fig. 8A). The ability of ANG-(1–7) to reduce ANG II-induced PAI-1 mRNA overexpression was decreased by adding 10−5 M Dla, the Mas receptor antagonist, although Dla alone had no effect on PAI-1 expression (Fig. 8B), or Dla alone had no effect on ANG II-induced PAI-1 overexpression (Fig. 8C). Similarly, ANG II at 10−8 M induced a more than twofold increase in PAI-1 protein production by MCs at 24-h incubation. This induction of PAI-1 production was also blocked by pretreatment of MCs with 10−7 M ANG-(1–7), an effect further reversed by 54.4% by coadministration of 10−5 M Dla (Fig. 8D). These results indicate that ANG-(1–7) inhibits ANG II-mediated PAI-1 overexpression via the Mas receptor.
Fig. 7.
Time course effects of ANG II and ANG-(1–7) on PAI-1 mRNA expression by rat MCs. Quiescent rat MCs were incubated in the absence (open bars) or presence (solid bars) of 10−8 M ANG II (A) or 10−7 M ANG-(1–7) (B) for the indicated times, and real-time RT-PCR was performed. Relative values of PAI-1 mRNA expression by rat MCs are expressed relative to the no-additive, zero-time control, which was set at unity. *P < 0.05 compared with the untreated control.
Fig. 8.
Effect of ANG-(1–7) on ANG II-induced PAI-1 mRNA and protein overexpression by rat MCs. A: dose effect of ANG-(1–7). Quiescent rat MCs were treated with or without 10−6 M to 10−7 M of ANG-(1–7) in addition to 10−8 M of ANG II for 8 h. The administration of 10−6 M saralasin (Sara), AT receptor blocker, was used as the inhibitory control on ANG II-induced PAI-1 mRNA expression. B: effect of the inactive analog of ANG-(1–7), Dla, on ANG-(1–7)'s inhibitory effect. C: effect of the inactive analog of ANG-(1–7), Dla, on ANG II-induced PAI-1 mRNA expression. Quiescent rat MCs were treated with or without 10−7 M of ANG-(1–7) or 10−7 M of ANG-(1–7) plus 10−5 M Dla, in addition to 10−8 M of ANG II for 8 h. PAI-1 mRNA was measured by real-time RT-PCR. D: effect of ANG-(1–7) and its inactive analog Dla on ANG II-induced PAI-1 protein expression. Quiescent rat MCs were treated with or without 10−7 M of ANG-(1–7) or 10−7 M of ANG-(1–7) plus 10−5 M Dla, in addition to 10−8 M of ANG II for 36 h. PAI-1 protein was measured in cultured supernatant by Western blot assay. Relative values are expressed relative to the no-additive control, which was set at unity. *P < 0.05 compared with the untreated control. #P < 0.05 compared with the ANG II alone treated cells.
DISCUSSION
Our in vivo data clearly indicate that exogenous infusion of ANG-(1–7) into nephritic rats at an effective dose has a diuretic effect and significantly reduces disease, as measured by proteinuria, pathological ECM expansion, matrix components (FN and collagen) deposition, glomerular macrophage infiltration, and mRNA expression and protein production of profibrotic molecules. These results indicate that increasing ANG-(1–7) levels produces antifibrotic effects in diseased glomeruli, and these effects may be independent of blood pressure, since the model of nephritis in rats is normotensive (22, 24). Similar protective effects of ANG-(1–7) are reported in renal wrap hypertensive rats, where ANG-(1–7) infusion prevented the aggravating effects of ovariectomy on glomerular and tubulointerstitial fibrosis, independent of blood pressure (17). In addition, infusion of ANG-(1–7) was also shown to prevent activation of NADPH oxidase and renal vascular dysfunction in diabetic hypertensive rats or spontaneously hypertensive rats treated with the nitric oxide synthesis inhibitor NG-nitro-l-arginine methyl ester (2, 3). Moreover, a new finding in the present study, revealed by reduced glomerular macrophage infiltration after treatment of ANG-(1–7), indicates that ANG-(1–7) may have anti-inflammatory effects in the kidney. These observations suggest that long-term treatment with ANG-(1–7) in patients with kidney disease could be effective in subsequent prevention of renal injury by regulating blood pressure, by limiting production of reactive oxygen species, renal inflammation, and ECM proteins, as observed in the heart (1, 38, 42). In contrast, chronic infusion of ANG-(1–7) into rats with streptozotocin-induced diabetes was reported to accelerate renal injury (34). In addition, ANG-(1–7) infusion had no protective effect against renal injury in an adriamycin-induced nephrotic syndrome rat model (34), while the oral AVE 0991 ANG-(1–7) analog exerted renoprotective and anti-inflammatory effects in the same model in mice (36). While differences in dose and experimental design could contribute to these discrepancies, further study with a higher dose of ANG-(1–7) given for a longer term is needed.
In the anti-Thy-1 nephritis model, ACEi or ARB therapy consistently and repeatedly reduces glomerulosclerosis, suggesting that local renal RAS is activated and renal ANG II generation and action are increased (26, 27, 46). Here we show that glomerular ACE mRNA expression is increased, and ACE2 expression is decreased, resulting in a significant increase in the ACE-to-ACE2 ratio in diseased rats, consistent with previous observations in the kidneys or glomeruli and proximal tubular cells of both diabetic animals and patients (20, 29, 43). In nephritic glomeruli, this increased ACE and decreased ACE2 may result in accumulation of ANG II and less generation of ANG-(1–7). While increased ANG II is clearly a key factor in the progression of renal diseases, little is known about the effect of reduced renal ANG-(1–7) concentration in disease. Since we show here that directly increasing ANG-(1–7) has a protective role in renal fibrosis, the present study suggests that a reduction in renal expression of ANG-(1–7) may exacerbate renal injury. Increasing local ANG-(1–7) by exogenous infusion does not affect renal ANG II concentration, since it did not affect plasma ANG II levels (data not shown) and had no effect on increased ACE or decreased ACE2 expression observed in nephritic glomeruli. However, increased ANG-(1–7) significantly stimulated plasma and renal renin activation and generation, which is often known to happen when ANG II's action is reduced in vivo through a RAS feedback mechanism. Thus the protective effects of ANG-(1–7) in renal fibrosis may be mediated by inhibiting ANG II's action. Recently, it was found that ANG-(1–7) levels are significantly increased (5- to 25-fold) by chronic treatment with ACEi and ARBs (18). Our results further indicate that the increased ANG-(1–7) may contribute at least partially to the beneficial effects of these drugs by inhibiting ANG II's action. However, the cellular and molecular mechanisms involved in the renal protective effects of ANG-(1–7) at this point are not fully understood.
The in vitro binding study, together with the finding that renal MCs express Mas receptor mRNA, revealed that ANG-(1–7) specifically binds renal MCs via the Mas receptor. That ANG II competes poorly with ANG-(1–7) for the binding sites on MCs suggests that the binding receptor of ANG-(1–7) on these cells has a low affinity for ANG II and is distinct from the AT1R and AT2R. ANG II-induced increases in cell proliferation and PAI-1 overexpression are inhibited by ANG-(1–7) via activation of the Mas receptor, suggesting that ANG-(1–7) may act by reversing the profibrotic effects of ANG II. This idea is supported by previous studies showing that genetic deletion of the Mas receptor in mice led to glomerular hyperfiltration, microalbuminuria, and increased expression of scaring proteins in both renal mesangium and interstitium (28). It has been reported that ANG-(1–7) also binds AT1R with a very low affinity compared with the Mas receptor (33). This binding requires micromolar plasma concentrations of ANG-(1–7). The concentration of ANG-(1–7) obtained by infusion in the present study should be <10 nM. Data from other groups also suggest that the plasma concentration of ANG-(1–7) in rats receiving a similar infusion dose of ANG-(1–7) is around 1 nM (39). In addition, a high concentration of the inactive analog of ANG-(1–7), Dla (10−5 M) had no effect on ANG II's action in cultured MCs. It appears unlikely that binding of ANG-(1–7) to the AT1R is involved in the therapeutic effects of ANG-(1–7) observed in the present study. Clearly further work is necessary to understand the signaling and downstream effects of ANG-(1–7) in counteracting the ANG II-induced renal injury.
Of interest in the kidney is that MCs primarily generate ANG II when incubated with ANG I, since MCs have limited ACE2 (43). In contrast, glomerular podocytes predominantly leads to ANG-(1–9) and ANG-(1–7) formation and ANG II catabolism, since podocytes express ACE2 but limited ACE (40, 41). It has been found that injection of the monoclonal anti-Thy-1 antibody (OX-7) rapidly induced podocyte foot process swelling, podocyturia, and MC proliferation (6, 45), which may be a response to the reduced ACE2 and increased ACE expression in nephritic glomeruli observed in this model of the present study. Our findings in vitro raise the possibility that exogenous administration of ANG-(1–7) to diseased glomeruli could be effective in reducing glomerulosclerosis through restoring the altered glomerular balance between ANG II and ANG-(1–7) and counteracting the actions of increased ANG II locally. Thus this study suggests that ANG-(1–7) may help regulate tissue repair in glomeruli.
In summary, the in vitro and in vivo data presented here extend previous work in the heart and kidney and support the notion that increasing ANG-(1–7) is therapeutic in reducing renal fibrosis. The mechanism may involve ANG-(1–7) binding to the Mas receptor and counteracting the profibrotic effects of ANG II, as summarized in the scheme in Fig. 9. However, further studies are needed to determine whether additional increases in ANG-(1–7) levels by exogenous administration are beneficial for reducing renal fibrosis when ACEi or ARB is being used and endogenous ANG-(1–7) is being increased significantly.
GRANTS
This work was supported by National Institutes of Health Grants KDK077955A (Y. Huang), DK081815 (Y. Huang), and DK43609 (W. A. Border). J. Zhang was supported by Chinese National Scientific Foundation C30900343.
DISCLOSURES
All of the authors declared no competing interests.
ACKNOWLEDGMENTS
We thank Linda Hoge for excellent technical assistance with animal studies.
REFERENCES
- 1.Al-Maghrebi M, Benter IF, Diz DI. Endogenous angiotensin-(1–7) reduces cardiac ischemia-induced dysfunction in diabetic hypertensive rats. Pharmacol Res 59: 263–268, 2009 [DOI] [PMC free article] [PubMed] [Google Scholar]
- 2.Benter IF, Yousif MH, Anim JT, Cojocel C, Diz DI. Angiotensin-(1–7) prevents development of severe hypertension and end-organ damage in spontaneously hypertensive rats treated with l-NAME. Am J Physiol Heart Circ Physiol 290: H684–H691, 2006 [DOI] [PubMed] [Google Scholar]
- 3.Benter IF, Yousif MH, Dhaunsi GS, Kaur J, Chappell MC, Diz DI. Angiotensin-(1–7) prevents activation of NADPH oxidase and renal vascular dysfunction in diabetic hypertensive rats. Am J Nephrol 28: 25–33, 2008 [DOI] [PubMed] [Google Scholar]
- 4.Chappell MC. Emerging evidence for a functional angiotensin-converting enzyme 2-angiotensin-(1–7)-MAS receptor axis: more than regulation of blood pressure? Hypertension 50: 596–599, 2007 [DOI] [PubMed] [Google Scholar]
- 5.Dilauro M, Burns KD. Angiotensin-(1–7) and its effects in the kidney. Scientific World Journal 9: 522–535, 2009 [DOI] [PMC free article] [PubMed] [Google Scholar]
- 6.Ebrahim H, Evans DJ. Antibody induced injury to podocytes with proteinuria and foot process swelling in a transgenic (T16) mouse. Int J Exp Pathol 80: 77–86, 1999 [DOI] [PMC free article] [PubMed] [Google Scholar]
- 7.Ferreira AJ, Oliveira TL, Castro MC, Almeida AP, Castro CH, Caliari MV, Gava E, Kitten GT, Santos RA. Isoproterenol-induced impairment of heart function and remodeling are attenuated by the nonpeptide angiotensin-(1–7) analogue AVE 0991. Life Sci 81: 916–923, 2007 [DOI] [PubMed] [Google Scholar]
- 8.Gaedeke J, Peters H, Noble NA, Border WA. Angiotensin II, TGF-β and renal fibrosis. Contrib Nephrol 135: 153–160, 2001 [DOI] [PubMed] [Google Scholar]
- 9.Grobe JL, Mecca AP, Lingis M, Shenoy V, Bolton TA, Machado JM, Speth RC, Raizada MK, Katovich MJ. Prevention of angiotensin II-induced cardiac remodeling by angiotensin-(1–7). Am J Physiol Heart Circ Physiol 292: H736–H742, 2007 [DOI] [PubMed] [Google Scholar]
- 10.Huang W, Xu C, Kahng KW, Noble NA, Border WA, Huang Y. Aldosterone and TGF-β1 synergistically increase PAI-1 and decrease matrix degradation in rat renal mesangial and fibroblast cells. Am J Physiol Renal Physiol 294: F1287–F1295, 2008 [DOI] [PubMed] [Google Scholar]
- 11.Huang Y, Border WA, Yu L, Zhang J, Lawrence DA, Noble NA. A PAI-1 mutant, PAI-1R, slows progression of diabetic nephropathy. J Am Soc Nephrol 19: 329–338, 2008 [DOI] [PMC free article] [PubMed] [Google Scholar]
- 12.Huang Y, Haraguchi M, Lawrence DA, Border WA, Yu L, Noble NA. A mutant, noninhibitory plasminogen activator inhibitor type 1 decreases matrix accumulation in experimental glomerulonephritis. J Clin Invest 112: 379–388, 2003 [DOI] [PMC free article] [PubMed] [Google Scholar]
- 13.Huang Y, Noble NA, Zhang J, Xu C, Border WA. Renin-stimulated TGF-beta 1 expression is regulated by a mitogen-activated protein kinase in mesangial cells. Kidney Int 72: 45–52, 2007 [DOI] [PubMed] [Google Scholar]
- 14.Huang Y, Wongamorntham S, Kasting J, McQuillan D, Owens RT, Yu L, Noble NA, Border W. Renin increases mesangial cell transforming growth factor-beta 1 and matrix proteins through receptor-mediated, angiotensin II-independent mechanisms. Kidney Int 69: 105–113, 2006 [DOI] [PubMed] [Google Scholar]
- 15.Ingelfinger JR. Angiotensin-converting enzyme 2: implications for blood pressure and kidney disease. Curr Opin Nephrol Hypertens 18: 79–84, 2009 [DOI] [PubMed] [Google Scholar]
- 16.Iwata M, Cowling RT, Gurantz D, Moore C, Zhang S, Yuan JX, Greenberg BH. Angiotensin-(1–7) binds to specific receptors on cardiac fibroblasts to initiate antifibrotic and antitrophic effects. Am J Physiol Heart Circ Physiol 289: H2356–H2363, 2005 [DOI] [PubMed] [Google Scholar]
- 17.Ji H, Menini S, Zheng W, Pesce C, Wu X, Sandberg K. Role of angiotensin-converting enzyme 2 and angiotensin(1–7) in 17 beta-oestradiol regulation of renal pathology in renal wrap hypertension in rats. Exp Physiol 93: 648–657, 2008 [DOI] [PubMed] [Google Scholar]
- 18.Katovich MJ, Grobe JL, Raizada MK. Angiotensin-(1–7) as an antihypertensive, antifibrotic target. Curr Hypertens Rep 10: 227–232, 2008 [DOI] [PubMed] [Google Scholar]
- 19.Laviades C, Varo N, Diez J. Transforming growth factor beta in hypertensives with cardiorenal damage. Hypertension 36: 517–522, 2000 [DOI] [PubMed] [Google Scholar]
- 20.Mizuiri S, Hemmi H, Arita M, Ohashi Y, Tanaka Y, Miyagi M, Sakai K, Ishikawa Y, Shibuya K, Hase H, Aikawa A. Expression of ACE and ACE2 in individuals with diabetic kidney disease and healthy controls. Am J Kidney Dis 51: 613–623, 2008 [DOI] [PubMed] [Google Scholar]
- 21.Moritz KM, Campbell DJ, Wintour EM. Angiotensin-(1–7) in the ovine fetus. Am J Physiol Regul Integr Comp Physiol 280: R404–R409, 2001 [DOI] [PubMed] [Google Scholar]
- 22.Narita I, Border WA, Ketteler M, Ruoslahti E, Noble NA. l-Arginine may mediate the therapeutic effects of low protein diets. Proc Natl Acad Sci USA 92: 4552–4556, 1995 [DOI] [PMC free article] [PubMed] [Google Scholar]
- 23.Noble NA, Border WA. Angiotensin II in renal fibrosis: should TGF-b rather than blood pressure be the therapeutic target? Semin Nephrol 17: 455–466, 1997 [PubMed] [Google Scholar]
- 24.Okuda S, Nakamura T, Yamamoto T, Ruoslahti E, Border WA. Dietary protein restriction rapidly reduces transforming growth factor b1 expression in experimental glomerulonephritis. Proc Natl Acad Sci USA 88: 9765–9769, 1991 [DOI] [PMC free article] [PubMed] [Google Scholar]
- 25.Pendergrass KD, Averill DB, Ferrario CM, Diz DI, Chappell MC. Differential expression of nuclear AT1 receptors and angiotensin II within the kidney of the male congenic mRen2 Lewis rat. Am J Physiol Renal Physiol 290: F1497–F1506, 2006 [DOI] [PubMed] [Google Scholar]
- 26.Peters H, Border WA, Noble NA. Angiotensin II blockade and low-protein diet produce additive therapeutic effects in experimental glomerulonephritis. Kidney Int 57: 1493–1501, 2000 [DOI] [PubMed] [Google Scholar]
- 27.Peters H, Border WA, Noble NA. Targeting TGF-beta overexpression in renal disease: maximizing the antifibrotic action of angiotensin II blockade. Kidney Int 54: 1570–1580, 1998 [DOI] [PubMed] [Google Scholar]
- 28.Pinheiro SV, Ferreira AJ, Kitten GT, DA Silveira KD, DA Silva DA, Santos SH, Gava E, Castro CH, Magalhaes JA, DA Mota RK, Botelho-Santos GA, Bader M, Alenina N, Santos RA, Simoes E, Silva AC. Genetic deletion of the angiotensin-(1–7) receptor Mas leads to glomerular hyperfiltration and microalbuminuria. Kidney Int 75: 1184–1193, 2009 [DOI] [PubMed] [Google Scholar]
- 29.Reich HN, Oudit GY, Penninger JM, Scholey JW, Herzenberg AM. Decreased glomerular and tubular expression of ACE2 in patients with type 2 diabetes and kidney disease. Kidney Int 74: 1610–1616, 2008 [DOI] [PubMed] [Google Scholar]
- 30.Santos RA, Castro CH, Gava E, Pinheiro SV, Almeida AP, Paula RD, Cruz JS, Ramos AS, Rosa KT, Irigoyen MC, Bader M, Alenina N, Kitten GT, Ferreira AJ. Impairment of in vitro and in vivo heart function in angiotensin-(1–7) receptor MAS knockout mice. Hypertension 47: 996–1002, 2006 [DOI] [PubMed] [Google Scholar]
- 31.Santos RA, Ferreira AJ. Angiotensin-(1–7) and the renin-angiotensin system. Curr Opin Nephrol Hypertens 16: 122–128, 2007 [DOI] [PubMed] [Google Scholar]
- 32.Santos RA, Ferreira AJ, Simoes ESAC. Recent advances in the angiotensin-converting enzyme 2-angiotensin(1–7)-Mas axis. Exp Physiol 93: 519–527, 2008 [DOI] [PubMed] [Google Scholar]
- 33.Santos RA, Simoes e Silva AC, Maric C, Silva DM, Machado RP, de Buhr I, Heringer-Walther S, Pinheiro SV, Lopes MT, Bader M, Mendes EP, Lemos VS, Campagnole-Santos MJ, Schultheiss HP, Speth R, Walther T. Angiotensin-(1–7) is an endogenous ligand for the G protein-coupled receptor Mas. Proc Natl Acad Sci USA 100: 8258–8263, 2003 [DOI] [PMC free article] [PubMed] [Google Scholar]
- 34.Shao Y, He M, Zhou L, Yao T, Huang Y, Lu LM. Chronic angiotensin (1–7) injection accelerates STZ-induced diabetic renal injury. Acta Pharmacol Sin 29: 829–837, 2008 [DOI] [PubMed] [Google Scholar]
- 35.Sharma K, Eltayeb BO, McGowan TA, Dunn SR, Alzahabi B, Rohde R, Ziyadeh FN, Lewis EJ. Captopril-induced reduction of serum levels of transforming growth factor-beta 1 correlates with long-term renoprotection in insulin-dependent diabetic patients. Am J Kidney Dis 34: 818–823, 1999 [DOI] [PubMed] [Google Scholar]
- 36.Silveira KD, Santos RA, Barroso LC, Lima CX, Teixeira MM, Silva AC. The oral agonist of angiotensin-(1–7) Mas receptor, AVE 0991, exerts renoprotective and anti-inflammatory effects in an experimental model of nephrotic syndrome (Abstract). In: World Congress of Nephrology 2009, Milan, Italy, p. M388 [Google Scholar]
- 37.Tallant EA, Ferrario CM, Gallagher PE. Angiotensin-(1–7) inhibits growth of cardiac myocytes through activation of the mas receptor. Am J Physiol Heart Circ Physiol 289: H1560–H1566, 2005 [DOI] [PubMed] [Google Scholar]
- 38.Trask AJ, Ferrario CM. Angiotensin-(1–7): pharmacology and new perspectives in cardiovascular treatments. Cardiovasc Drug Rev 25: 162–174, 2007 [DOI] [PubMed] [Google Scholar]
- 39.van der Wouden EA, Henning RH, Deelman LE, Roks AJ, Boomsma F, de Zeeuw D. Does angiotensin (1–7) contribute to the anti-proteinuric effect of ACE-inhibitors. J Renin Angiotensin Aldosterone Syst 6: 96–101, 2005 [DOI] [PubMed] [Google Scholar]
- 40.Velez JC, Bland AM, Arthur JM, Raymond JR, Janech MG. Characterization of renin-angiotensin system enzyme activities in cultured mouse podocytes. Am J Physiol Renal Physiol 293: F398–F407, 2007 [DOI] [PubMed] [Google Scholar]
- 41.Velez JC, Ryan KJ, Harbeson CE, Bland AM, Budisavljevic MN, Arthur JM, Fitzgibbon WR, Raymond JR, Janech MG. Angiotensin I is largely converted to angiotensin (1–7) and angiotensin (2–10) by isolated rat glomeruli. Hypertension 53: 790–797, 2009 [DOI] [PMC free article] [PubMed] [Google Scholar]
- 42.Wenzel UO, Thaiss F, Panzer U, Schneider A, Schwietzer G, Helmchen U, Stahl RA. Effect of renovascular hypertension on experimental glomerulonephritis in rats. J Lab Clin Med 134: 292–303, 1999 [DOI] [PubMed] [Google Scholar]
- 43.Ye M, Wysocki J, William J, Soler MJ, Cokic I, Batlle D. Glomerular localization and expression of angiotensin-converting enzyme 2 and angiotensin-converting enzyme: implications for albuminuria in diabetes. J Am Soc Nephrol 17: 3067–3075, 2006 [DOI] [PubMed] [Google Scholar]
- 44.Yoshida M, Naito Y, Urano T, Takada A, Takada Y. l-158,809 and [d-Ala(7)]-angiotensin I/II (1–7) decrease PAI-1 release from human umbilical vein endothelial cells. Thromb Res 105: 531–536, 2002 [DOI] [PubMed] [Google Scholar]
- 45.Yu D, Petermann A, Kunter U, Rong S, Shankland SJ, Floege J. Urinary podocyte loss is a more specific marker of ongoing glomerular damage than proteinuria. J Am Soc Nephrol 16: 1733–1741, 2005 [DOI] [PubMed] [Google Scholar]
- 46.Yu L, Border WA, Anderson I, McCourt M, Huang Y, Noble NA. Combining TGF-β inhibition and angiotensin II blockade results in enhanced anti-fibrotic effect. Kidney Int 66: 1774–1784, 2004 [DOI] [PubMed] [Google Scholar]
- 47.Zhang H, Wada J, Hida K, Tsuchiyama Y, Hiragushi K, Shikata K, Wang H, Lin S, Kanwar YS, Makino H. Collectrin, a collecting duct-specific transmembrane glycoprotein, is a novel homolog of ACE2 and is developmentally regulated in embryonic kidneys. J Biol Chem 276: 17132–17139, 2001 [DOI] [PubMed] [Google Scholar]


