

Abstract
Objective:
The goal of this study is to determine if regional brain perfusion, as measured by arterial spin labeling (ASL) MRI, is correlated with clinical measures of amyotrophic lateral sclerosis (ALS) disease severity. The presence of such a relationship would indicate a possible role for ASL perfusion as a marker of disease severity and upper motor neuron involvement in ALS.
Methods:
Disease severity was assessed in 16 subjects with ALS (age 54 ± 11) using the Amyotrophic Lateral Sclerosis Functional Rating Scale (ALSFRS) and the pulmonary function measure, forced vital capacity (FVC). Upper motor neuron involvement was assessed by testing rapid tapping of the fingers and feet. Magnetic resonance perfusion images were coregistered with structural T1-weighted MRI, corrected for partial volume effects using the structural images and normalized to a study-specific atlas. Correlations between perfusion and ALS disease severity were analyzed, using statistical parametric mapping, and including age as a factor. Analyses were adjusted for multiple clusters.
Result:
ALS severity, as measured by the ALSFRS and FVC, was correlated with gray matter perfusion. This correlation was predominantly observed in the hemisphere contralateral to the more affected limbs. ALSFRS scores correlated with perfusion in the contralateral frontal and parietal lobe (p < 0.001) and ipsilateral frontal lobe (p < 0.02). FVC scores correlated with gray matter perfusion in contralateral frontal lobe (p < 0.001). Upper motor neuron involvement, as measured by rapid finger tapping, correlated bilaterally with perfusion in the middle cingulate gyrus (p < 0.001).
Conclusion:
Amyotrophic lateral sclerosis (ALS) severity is correlated with brain perfusion as measured by arterial spin labeling (ASL) perfusion. This correlation appears to be independent of brain atrophy. ASL perfusion may be a useful tool for monitoring disease progression and assessing treatment effects in ALS.
GLOSSARY
- ALS
= amyotrophic lateral sclerosis;
- ALSFRS
= Amyotrophic Lateral Sclerosis Functional Rating Scale;
- ASL
= arterial spin labeling;
- BA
= Brodmann areas;
- FDG PET
= fluorodeoxyglucose PET;
- FVC
= forced vital capacity;
- HMPAO SPECT
= Tc-hexamethylpropyleneamine oxime SPECT;
- NAA
= N-acetylaspartate;
- VBM
= voxel-based morphometry.
Amyotrophic lateral sclerosis (ALS) is a neurodegenerative disorder that results in the loss of motor neurons both in the brain and spinal cord leading to paralysis and ultimately death. There is no definitive marker for ALS and both diagnosis and assessment of disease progression are currently based on clinical data. While lower motor neuron abnormalities can be easily evaluated by clinical electrodiagnostic examination, there is no reliable biomarker for the upper motor neuron abnormality. The development of a surrogate marker for disease progression would be useful for accurate diagnosis and for monitoring treatment effects.
Traditional MRI methods are mainly useful in ruling out diseases that mimic ALS. Several MRI techniques have helped to identify ALS-related brain changes. Two voxel-based morphometry (VBM) studies reported atrophy in ALS. One study reported global atrophy as well as regional atrophy in the right motor cortex and left precentral gyrus.1 The other reported frontal lobe atrophy bilaterally in Brodmann areas (BA) 8, 9, and 10.2 Magnetic resonance spectroscopy techniques have also been used to identify changes in ALS. One study found decreased N-acetylaspartate (NAA) both in the motor and frontal cortex3; another study reported decreased NAA and increased creatine and choline.4 NAA is a compound that is concentrated in neuronal cell bodies and processes, but absent from non-neuronal tissue. NAA concentration is thus considered an indicator of neuronal density. These differences were greatest in the motor cortex, but also present in other regions of the frontal and parietal lobes.
Functional imaging studies showed decreased brain glucose metabolism and perfusion in ALS using methods such as fluorodeoxyglucose PET (FDG PET) and Tc-hexamethylpropyleneamine oxime SPECT (HMPAO SPECT). One SPECT study reported bilateral frontal hypoperfusion,5 while a second study examining 3 related individuals with familial ALS reported frontal and parietal hypoperfusion in all 3 that was more prominent in the left hemisphere and thalamic hypoperfusion in 2.6 For clinical purposes, however, PET and SPECT have several disadvantages, including injection of radioactive tracers, requirement for arterial blood sampling when performed quantitatively, and limited availability in comparison to MRI scans. Arterial spin label (ASL) perfusion is a noninvasive, rapidly repeatable method used to assess brain perfusion without exposure to radioactive tracers. Additionally, structural and perfusion images can be acquired during the same imaging session. The goal of this research was to assess ASL perfusion as a possible marker of disease severity in ALS.
METHODS
Subjects.
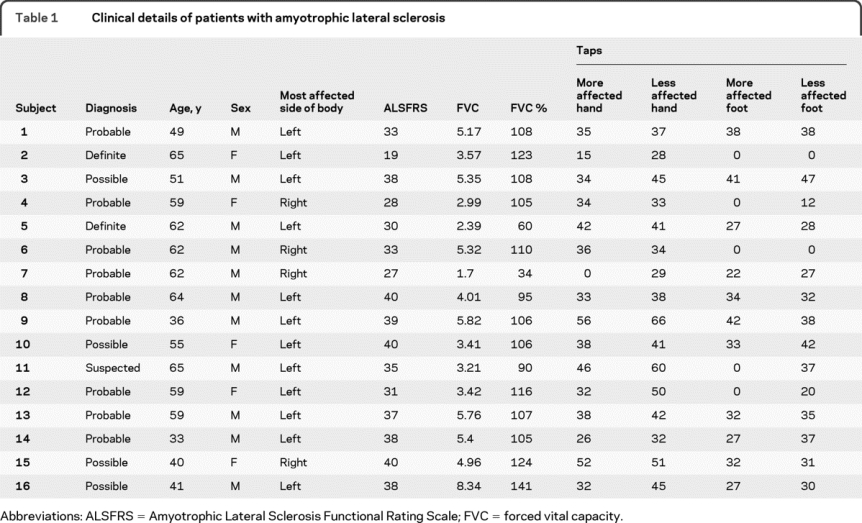
This study was approved by the Committees on Human Research at the University of California, California Pacific Medical Center, and the VA Medical Center, San Francisco, and all subjects provided written informed consent prior to MRI examination. Data were collected from 16 patients with ALS (age 54 ± 11 years). The diagnosis of ALS was established based on the El Escorial criteria (table 1).7 In 12 of the 16 patients with ALS, the left side of the body was identified as being more affected by clinical examination.
Table 1 Clinical details of patients with amyotrophic lateral sclerosis
Clinical measurement of disease severity.
ALS disease severity was assessed by the ALS Functional Rating Scale (ALSFRS) and the forced vital capacity (FVC). The ALSFRS is a measure of functional impairment in ALS. Individuals are rated using a 5-point scale (0 = cannot do, 4 = normal ability) on 10 everyday tasks (e.g., walking, writing, speaking, breathing). FVC is the total amount of air measured in liters that can be forcibly exhaled after full inhalation. Upper motor function was specifically assessed using rapid finger and foot tapping. This was the number of finger or foot taps the subject was able to complete in 10 seconds.
Image acquisition.
Images were acquired using a standard 1.5 Tesla magnetic resonance system (Vision; Siemens, Erlangen, Germany) by using a circularly polarized head coil for radiofrequency transmission and reception. Labeled and reference images of ASL were collected in 6 contiguous 9-mm-thick slices along the AC/PC line with the most inferior slice at the level of the third ventricle using a pulsed arterial spin labeling sequence (postlabeling delay = 1,200 msec, repetition time/echo time = 2,500/15 msec, flip angle = 180o). The labeling delay was 1,200 msec. The field of view was 320 mm × 320 mm and the in-plane resolution was 5.0 mm × 2.5 mm. For brain tissue segmentation and for image registration to a reference brain template, a volumetric T1-weighted gradient echo MRI scan of the entire brain was acquired (echo time, 4 msec; repetition time, 10 msec; flip angle, 15°; 1.0 × 1.0 mm2 in-plane resolution; acquisition time, 7 minutes) that was angled perpendicular to the AC-PC line with a 1.5-mm effective slice thickness.
Image processing.
Prior to processing, all images from the 4 individuals identified as having more involvement of the right side of the body were reversed, allowing group analyses of the ipsilateral and contralateral brain hemispheres relative to the more affected body side. For each subject, the perfusion image was coregistered with the T1-weighted image by using the mutual information coregistration algorithm within a statistical parametric mapping program (SPM2; Wellcome Department of Cognitive Neurosciences, London, UK). A stepwise coregistration was used. First labeled and reference images were registered, then these images together were registered to the T1-weighted image. Once these 3 images were coregistered, the perfusion-weighted image was calculated by subtracting the labeled from the reference image. Perfusion images were corrected for intersubject intensity variations in coil loading and signal amplification. This was done by first calculating image brightness (BR) using the following formula: BR = FTscale × 10RG/20, where FTscale accounts for coil loading and RG is the receiver gain, i.e., amplification of the signal. The T1 images were then segmented into gray matter, white matter, and CSF probabilistic masks using SPM's segmentation algorithm.
The gray matter probabilistic mask was resectioned to the same resolution as the perfusion image and converted to a binary mask thresholded at 40% probability to exclude voxels with small amounts of gray matter. The perfusion image was multiplied by the binary gray mask resulting in an image of predominantly gray matter perfusion.
A study-specific gray matter template was created by using the gray matter probability masks of all ALS and control subjects. This was accomplished by segmenting the T1-weighted images for each subject after affine normalization to the SPM T1 template, taking the mean of all gray matter probability masks, and smoothing the resultant image using an 8-mm full width at half maximum Gaussian kernel.8
The images were then spatially normalized, to the study-specific gray matter template, by using the normalization parameters generated by spatially normalizing each subject's T1-weighted image to this template using an affine transformation.
Correcting for partial volume effects.
After spatial normalization, information about the proportion of gray matter, white matter, and CSF within perfusion voxels was used to correct perfusion data for regions where gray matter atrophy has resulted in perfusion voxels with greater volume fractions of white matter and CSF. We assumed that all contributions to perfusion are from brain tissue—that is, gray matter and white matter—and CSF contributes nothing.9 To account for partial volumes of gray matter and white matter in perfusion voxels, we assumed that the perfusion to gray matter is 2.5 times the perfusion to white matter.10 Based on these assumptions, partial volume effects are corrected using the following formula: Icorr = Iuncorr/(GM + 0.4 × WM), where Icorr and Iuncorr are the corrected and uncorrected perfusion intensity values, GM is the probability of the voxel containing gray matter, and WM is the probability of the voxel containing white matter with GM + WM + CSF = 1. To avoid unreasonable high Icorr values due to image misregistrations, an upper limit was set of 2 standard deviations above the mean value of Iuncorr for all voxels containing at least 95% gray matter.
Statistical analysis.
Voxel-wise statistical analyses were conducted using SPM2. Images were smoothed with a 12-mm full width at half maximum kernel prior to statistical analysis to normalize the distribution of perfusion data. Correlations were evaluated using a multiple regression analysis with subject age included as a variable in the model. SPM's threshold masking function was used to eliminate voxels with very small intensity values (<0.5) from the analysis. Results were thresholded at p < 0.001 for voxel analysis and clusters were only included if they were at least 100 significant voxels large. Analyses were conducted on the entire subject group. Clusters were only reported if they were significant after correcting for multiple clusters using SPM's cluster-level analysis. Reported correlation coefficients were calculated by using the transform extension from the SPM2 VBM2 toolbox (http://dbm.neuro.uni-jena.de).
RESULTS
Perfusion and ALS severity.
ALSFRS.
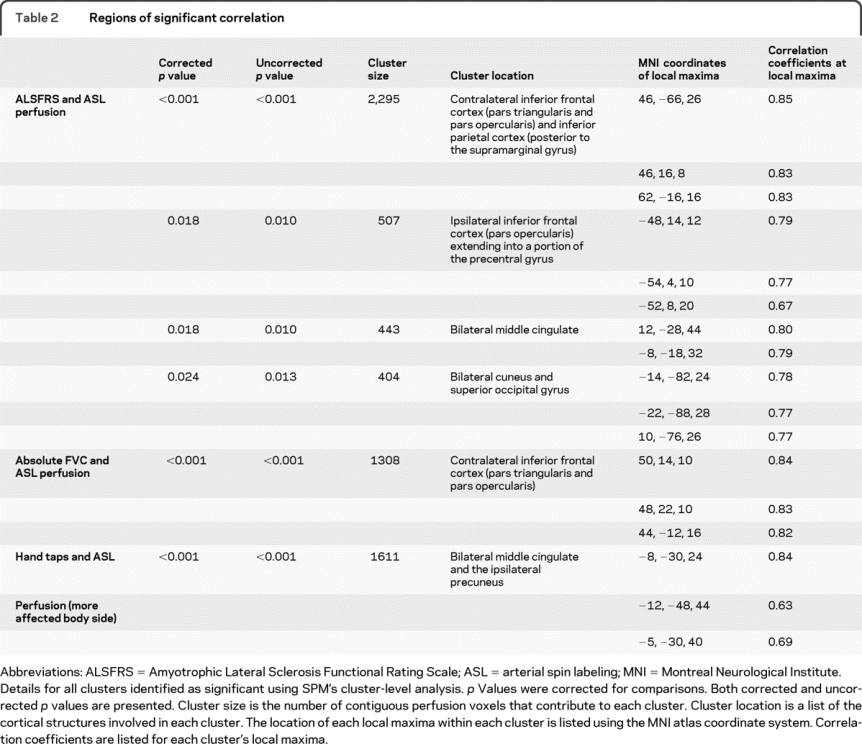
A linear regression analysis of motor functioning as measured by score on the ALSFRS (and age as a covariate) reveals that motor functioning increases with ASL brain perfusion in several cortical areas. This correlation was predominantly observed in the hemisphere contralateral to the more affected limbs. One very large cluster was observed in the hemisphere contralateral to the more affected body side. One cluster was observed in the ipsilateral hemisphere and 2 clusters traversed the interhemispheric fissure. The contralateral cluster extended from pars triangularis in the inferior frontal lobe to the supramarginal gyrus in the inferior parietal lobe. The ipsilateral cluster mirrored the prefrontal local maxima of the contralateral cluster but was smaller in extent. One bilateral cluster was located in the middle cingulate and the other was located in the cuneus and superior occipital cortex (figure 1, table 2).

Figure 1 Finger tapping positive correlation with arterial spin labeling (ASL) perfusion (left = ipsilateral)
Voxels exhibiting increased ASL perfusion with increased Amyotrophic Lateral Sclerosis Functional Rating Scale. Voxels were only included if they were in clusters of at least 100 voxels (p < 0.001). The images in A project these voxels onto a 3-dimensional rendering of the Montreal Neurological Institute atlas. The images in B display these same data as a maximum intensity projection on a transparent “glass brain.” The dashed lines indicate the extent of the brain that was covered by the ASL perfusion images.
Table 2 Regions of significant correlation
FVC.
A linear regression analysis of lung capacity as measured by FVC (and controlling for age) reveals a cluster in the contralateral inferior frontal cortex (figure 2, table 2).

Figure 2 Absolute forced vital capacity (FVC) positive correlation with arterial spin labeling (ASL) perfusion (left = ipsilateral)
Voxels exhibiting increased ASL perfusion with increased absolute FVC. Voxels were only included if they were in clusters of at least 100 voxels (p < 0.001). The images in A project these voxels onto a 3-dimensional rendering of the Montreal Neurological Institute atlas. The images in B display these same data as a maximum intensity projection on a transparent “glass brain.” The dashed lines indicate the extent of the brain that was covered by the ASL perfusion images.
Tapping.
Significant correlations between tapping of the hand on the more affected side of the body were observed bilaterally in the middle cingulate extending into the ipsilateral precuneus (figure 3, table 2). No clusters reached criteria when looking at the less affected hand or either foot.

Figure 3 Amyotrophic Lateral Sclerosis Functional Rating Scale positive correlation with arterial spin labeling (ASL) perfusion (left = ipsilateral)
Voxels exhibiting increased ASL perfusion with increased number of finger taps. Voxels were only included if they were in clusters of at least 100 voxels (p < 0.001). The images in A project these voxels onto a 3-dimensional rendering of the Montreal Neurological Institute atlas. The images in B display these same data as a maximum intensity projection on a transparent “glass brain.” The dashed lines indicate the extent of the brain that was covered by the ASL perfusion images.
DISCUSSION
Increased ALS severity was correlated with a regional pattern of decreased gray matter perfusion. Decreased perfusion was primarily observed in the frontal cortex, but also in medial cortex, middle cingulate, and precuneus; these results have been corrected for atrophy and thus do not appear to be the result of correlations between cortical atrophy and disease severity. Correlations were more extensive in the hemisphere contralateral to the side of the body more affected by ALS.
These correlations are consistent with atrophy that has been observed by using both voxel-based morphometry11 and volumetric analysis.12
The frontal cluster in the ipsilateral hemisphere, and to a lesser extent the frontal cluster in the contralateral hemisphere, included a portion of motor cortex, which corresponds to the upper motor neuron degeneration that occurs in ALS. The full extent of motor cortex involvement cannot be assessed as the superior regions of motor cortex were outside of the perfusion image. Moreover, these frontal lobe abnormalities are consistent with the presence of executive function deficits in ALS.13–15
The asymmetric distribution of the correlations between ALSFRS and ASL perfusion are similar to recently reported results. One SPECT study reports correlations between the ALSFRS and perfusion that are more prominent in the left hemisphere.16 The authors of that study did not categorize subjects by affected body side so it is not possible to directly compare this to the current findings. It is important to note that while ALSFRS and FVC measure complex bilateral behavior, the correlations with ALS perfusion display hemispheric asymmetry. The correlated brain regions are not necessarily directly affecting performance on the clinical measures but it is likely that the affected brain regions are being influenced by the same disease processes responsible for the clinical deficits observed.
While degeneration of the frontal lobe is more frequently reported in ALS than are changes in posterior regions, the correlations we found in parietal cortex are consistent with the findings of MRS changes4,17 in ALS and atrophy in both ALS and primary lateral sclerosis.18,19
To determine the usefulness of this measure, longitudinal studies are needed to determine how perfusion changes over time in ALS. Additionally, future research should use a perfusion sequence with fuller coverage of regions known to be affected by ALS (e.g., motor cortex and prefrontal cortex). No cognitive testing was conducted with this group of patients with ALS. Given the presence of correlations between disease severity and perfusion in extramotor cortical regions, further research is needed into the relationship of disease severity, perfusion, and cognitive function.
This study has a number of limitations. First, there is no control group. Therefore the relationship between imaging and functioning observed in ALS cannot be compared to the relationship, if any, in individuals without ALS. Second, in the current implementation of ASL, brain coverage was limited to superior brain regions and coverage of the superior brain was incomplete. Portions of the brain implicated in other studies of ALS, including primary motor cortex and prefrontal cortex, were only partially covered. Finally, perfusion measurements were based on a simple model of water perfusion, in which instantaneous exchange of water from intravascular to extravascular space was assumed. In addition, variable arterial transit times and variations in T1 relaxation of the water labels were not considered. To the extent that these factors systematically vary with ALS severity, perfusion may have been overstated or understated.
The current findings, while preliminary, are promising. The relationship between ALS severity and brain perfusion suggests that brain perfusion decreases with ALS severity. Therefore brain perfusion may be a useful tool for monitoring disease progression and assessing treatment effects in ALS.
AUTHOR CONTRIBUTIONS
Statistical analysis was conducted by Dr. R.R. Rule.
DISCLOSURE
Dr. Rule served on a scientific advisory board and served as a consultant for Posit Science Corporation and received research support from the NIH (NHLBI K01 HL73152 [PI]). Dr. Schuff has received travel expenses for educational activities not funded by industry and receives research support from Synarc Inc., the NIH (P41 RR 023953 [Co-I], R01 AG032306 [Co-I]), the US Department of Defense (W81XWH-05 [PI]), and the Michael J. Fox Foundation. Dr. Miller serves on the editorial board of the ALS Journal; received a speaker honorarium from the AANEM; served as a consultant to Celgene, Knopp Neurosciences Inc., Teva Pharmaceutical Industries Ltd., Taiji Biomedical, Inc., Sanofi-Aventis, Novartis, and Neuraltus; and receives research support from the NIH (R01 NS 44887 [PI]) and the Muscular Dystrophy Association (PI). Dr. Weiner serves on scientific advisory boards for Bayer Schering Pharma, Eli Lilly and Company, CoMentis, Inc., Neurochem Inc, Eisai Inc., Avid Radiopharmaceuticals Inc., Aegis Therapies, Genentech, Inc., Allergan, Inc., Lippincott Williams & Wilkins, Bristol-Myers Squibb, Forest Laboratories, Inc., Pfizer Inc, McKinsey & Company, Mitsubishi Tanabe Pharma Corporation, and Novartis; has received funding for travel from Nestlé and Kenes International and to attend conferences not funded by industry; serves on the editorial board of Alzheimer's & Dementia; has received honoraria from the Rotman Research Institute and BOLT International; serves as a consultant for Elan Corporation; receives research support from Merck & Co., Radiopharmaceuticals Inc., the NIH (U01AG024904 [PI], P41 RR023953 [PI], R01 AG10897 [PI], P01AG19724 [Co-I], P50AG23501 [Co-I], R24 RR021992 [Co-I], R01 NS031966 [Co-I], and P01AG012435 [Co-I]), the US Department of Defense (DAMD17-01-1-0764 [PI]), the Veterans Administration (MIRECC VISN 21 [Core PI]), and the State of California; and holds stock in Synarc and Elan Corporation.
Address correspondence and reprint requests to Dr. Randall R. Rule, 4150 Clement Street (114Q), San Francisco, CA 94121 randall.rule.phd@gmail.com
e-Pub ahead of print on February 10, 2010, at www.neurology.org.
Disclosure: Author disclosures are provided at the end of the article.
Received January 2, 2009. Accepted in final form January 5, 2010.
REFERENCES
- 1.Kassubek J, Unrath A, Huppertz HJ, et al. Global brain atrophy and corticospinal tract alterations in ALS, as investigated by voxel-based morphometry of 3-D MRI. Amyotroph Lateral Scler Other Motor Neuron Disord 2005;6:213–220. [DOI] [PubMed] [Google Scholar]
- 2.Ellis CM, Simmons A, Jones DK, et al. Diffusion tensor MRI assesses corticospinal tract damage in ALS. Neurology 1999;53:1051–1058. [DOI] [PubMed] [Google Scholar]
- 3.Abe K, Takanashi M, Watanabe Y, et al. Decrease in N-acetylaspartate/creatine ratio in the motor area and the frontal lobe in amyotrophic lateral sclerosis. Neuroradiology 2001;43:537–541. [DOI] [PubMed] [Google Scholar]
- 4.Rule RR, Suhy J, Schuff N, et al. Reduced NAA in motor and non-motor brain regions in amyotrophic lateral sclerosis: a cross-sectional and longitudinal study. Amyotroph Lateral Scler Other Motor Neuron Disord 2004;5:141–149. [DOI] [PMC free article] [PubMed] [Google Scholar]
- 5.Beall DP, Martin D, Chin BB. Decreased bilateral frontal lobe perfusion in dementia of amyotrophic lateral sclerosis. Clin Nucl Med 1998;23:855–856. [DOI] [PubMed] [Google Scholar]
- 6.Kumar M, Abdel-Dayem HM. Three generations of amyotrophic lateral sclerosis in a family: SPECT brain perfusion findings. Clin Nucl Med 1999;24:539–540. [DOI] [PubMed] [Google Scholar]
- 7.Brooks BR, Miller RG, Swash M, Munsat TL. El Escorial revisited: revised criteria for the diagnosis of amyotrophic lateral sclerosis. Amyotroph Lateral Scler Other Motor Neuron Disord 2000;1:293–299. [DOI] [PubMed] [Google Scholar]
- 8.Good CD, Johnsrude IS, Ashburner J, et al. A voxel-based morphometric study of ageing in 465 normal adult human brains. Neuroimage 2001;14:21–36. [DOI] [PubMed] [Google Scholar]
- 9.Meltzer CC, Leal JP, Mayberg HS, Wagner HN, Jr., Frost JJ. Correction of PET data for partial volume effects in human cerebral cortex by MR imaging. J Comput Assist Tomogr 1990;14:561–570. [DOI] [PubMed] [Google Scholar]
- 10.Roberts DA, Detre JA, Bolinger L, Insko EK, Leigh JJ. Quantitative magnetic resonance imaging of human brain perfusion at 1.5 T using steady-state inversion of arterial water. Proc Natl Acad Sci USA 1994;91:33–37. [DOI] [PMC free article] [PubMed] [Google Scholar]
- 11.Chang JL, Lomen-Hoerth C, Murphy J, et al. A voxel-based morphometry study of patterns of brain atrophy in ALS and ALS/FTLD. Neurology 2005;65:75–80. [DOI] [PubMed] [Google Scholar]
- 12.Ellis CM, Suckling J, Amaro E, Jr., et al. Volumetric analysis reveals corticospinal tract degeneration and extramotor involvement in ALS. Neurology 2001;57:1571–1578. [DOI] [PubMed] [Google Scholar]
- 13.Santhosh J, Bhatia M, Sahu S, Anand S. Quantitative EEG analysis for assessment to ‘plan’ a task in amyotrophic lateral sclerosis patients: a study of executive functions (planning) in ALS patients. Brain Res Cogn Brain Res 2004;22:59–66. [DOI] [PubMed] [Google Scholar]
- 14.Abrahams S, Leigh PN, Harvey A, et al. Verbal fluency and executive dysfunction in amyotrophic lateral sclerosis (ALS). Neuropsychologia 2000;38:734–747. [DOI] [PubMed] [Google Scholar]
- 15.Abrahams S, Goldstein LH, Al-Chalabi A, et al. Relation between cognitive dysfunction and pseudobulbar palsy in amyotrophic lateral sclerosis. J Neurol Neurosurg Psychiatry 1997;62:464–472. [DOI] [PMC free article] [PubMed] [Google Scholar]
- 16.Habert MO, Lacomblez L, Maksud P, et al. Brain perfusion imaging in amyotrophic lateral sclerosis: extent of cortical changes according to the severity and topography of motor impairment. Amyotroph Lateral Scler 2007;8:9–15. [DOI] [PubMed] [Google Scholar]
- 17.Pioro EP, Antel JP, Cashman NR, Arnold DL. Detection of cortical neuron loss in motor neuron disease by proton magnetic resonance spectroscopic imaging in vivo. Neurology 1994;44:1933–1938. [DOI] [PubMed] [Google Scholar]
- 18.Kuipers-Upmeijer J, de Jager AE, Hew JM, Snoek JW, van Weerden TW. Primary lateral sclerosis: clinical, neurophysiological, and magnetic resonance findings. J Neurol Neurosurg Psychiatry 2001;71:615–620. [DOI] [PMC free article] [PubMed] [Google Scholar]
- 19.Peretti-Viton P, Azulay JP, Trefouret S, et al. MRI of the intracranial corticospinal tracts in amyotrophic and primary lateral sclerosis. Neuroradiology 1999;41:744–749. [DOI] [PubMed] [Google Scholar]