

Abstract
Drawing inspiration from the adhesion abilities of a leaf beetle found in nature, we have engineered a switchable adhesion device. The device combines two concepts: The surface tension force from a large number of small liquid bridges can be significant (capillarity-based adhesion) and these contacts can be quickly made or broken with electronic control (switchable). The device grabs or releases a substrate in a fraction of a second via a low-voltage pulse that drives electroosmotic flow. Energy consumption is minimal because both the grabbed and released states are stable equilibria that persist with no energy added to the system. Notably, the device maintains the integrity of an array of hundreds to thousands of distinct interfaces during active reconfiguration from droplets to bridges and back, despite the natural tendency of the liquid toward coalescence. We demonstrate the scaling of adhesion strength with the inverse of liquid contact size. This suggests that strengths approaching those of permanent bonding adhesives are possible as feature size is scaled down. In addition, controllability is fast and efficient because the attachment time and required voltage also scale down favorably. The device features compact size, no solid moving parts, and is made of common materials.
Keywords: bioinspired design, controlled wet adhesion, electroosmotic pump, leaf beetle, volume scavenging
Creatures that exhibit extraordinary adhesion in daily activities employ a variety of strategies to do so. Prominent among these creatures is the gecko, whose nano-fibrillar contacts are thought to rely on dry adhesion via van der Waals forces (1). Wet adhesion strategies can also be found in nature, either relying on protein-based glues (2, 3) or a fluid mechanics-based bond via viscosity or surface tension (4–6). Combined strategies have also been proposed for manmade devices (7). In this paper, inspiration comes from a leaf beetle, an insect that achieves adhesion forces (approximately 33 mN) exceeding 100 times its body weight. This is accomplished through the parallel action of surface tension across many micron-sized droplet contacts (8).
A liquid droplet caught between two glass slides pulls the slides together. The liquid surface tension σ acts along the perimeter of the wetted contact areas to give a force ≈σπϵ for a single contact where ϵ is the contact diameter*. In defending itself by adhesion, the beetle establishes a large number N of small contacts, each of wetted area Awet. The beetle “feet” project a total net area (i.e., including dry area between contacts) about equal to this letter “o,” Anet ≈ 2 mm2, and can deploy N ≈ 105 contacts of ϵ ≈ 2 μm. The net perimeter force scales as Nσπϵ, consistent with the measured adhesion of the beetle (8). To emphasize the geometric advantage of packing perimeter into a fixed area, we introduce a contact packing density ϕ ≡ NAwet/Anet. Using ϕ to eliminate N yields the perimeter force as F ≈ Anet(ϕ/ϵ2)σϵ, showing that F ∝ 1/ϵ for fixed Anet. This amplification of the perimeter force by 1/ϵ illustrates the great benefit (e.g., ref. 10) of packing a large number of small contacts into a fixed net area.
Just as remarkable as the beetle’s strength of adhesion is its quick switching of this bond on and off. Each contact can be thought of as switchable, and the beetle reconfigures its array of 105 contacts in < 1 s. The beetle thus proves the functionality of large arrays of small-scale capillary contacts for switchable adhesion. However, to mimic the beetle’s control mechanism of peeling by muscular action† brings formidable challenges. Rather than mimic, we introduce electronic control.
Rapid and repeatable electromagnet-like attachment/detachment to wood, brick, linoleum, plastics, metals, and other surfaces of various roughness has clear benefits. Conventional techniques to grab surfaces use a vacuum/suction strategy but these suffer an intrinsic limit of adhesion strength—1 atm (approximately 100 kPa)—due to their principle of operation. Further disadvantages of a vacuum device are bulkiness and high power required to initiate and sustain attachment. Alternate mechanisms for switchable adhesion have been recently demonstrated; control of surface chemistry by temperature or pH result in transitions that can take from minutes to hours to realize (11–13).
Adhesion Device
We first describe the concept for a switchable electronically-controlled capillary adhesion device (SECAD). The mechanism of control of grab/release by the SECAD is illustrated in the cyclical sequence of Fig. 1A. A liquid droplet protrudes from a hole with the liquid/gas interface pinned at the orifice edge. Solid spacers extend above the face plane of the orifice to prevent contact between the droplet and the substrate. Thus, in the “detached” state, the device takes on the nonwetting characteristics of the dry spacer. In grabbing, liquid is pumped out of the face pad until contact is made with the substrate and a liquid bridge forms between device and substrate. In releasing, liquid is pumped back into the device until the bridge becomes unstable and breaks. The spacer is crucial to the release because it fixes the bridge length, enabling the bridge to neck in until it pinches off and breaks (14, 15). This is akin to separating two glass slides with a drop between; easily done with spacers present but difficult if the slides can make contact. Both the attached and detached states persist indefinitely with no additional energy added to the system. Grab-and-release is activated by a pump driven by electoosmosis (EO) [e.g., (16)] within a liquid-saturated porous material located beneath the field-of-view of Fig. 1A. The EO pump moves liquid efficiently against the resisting capillary pressure of the gas/liquid surfaces, using the same principle as the electroosmotic droplet switch (14).
Fig. 1.

Switchable wet adhesion concept and demonstrations (also see Movies S1 and S2). (A) Concept: Top and bottom states are static equilibria, characterized by zero power consumption. Moving from one equilibria to the other is accomplished by pumping liquid into or out of the device (pump not shown). (B) Substrate-pendant experiment, with device (Upper Left) holding a Plexiglas substrate (2 cm × 2 cm, arrow points to substrate). Oscilloscope shows “attach” voltage pulse. (C) Device-pendant experiment, with device (arrow points to top surface, visible through Plexiglas substrate) holding its own weight plus a payload for over 7 min at zero voltage. (D) Substrates successfully tested in (B), left to right: plywood, sandpaper, linoleum, brick, and roof shingle. (E) Slim-profile device: 2 cm wide, 1.1 mm thick, ϵ = 300 μm, and ϕ = 0.1. Electrode interconnects to either side, filling port extends down the middle, and no spacer is present here.
We now demonstrate the functionality of the SECAD. When the device is fixed in the lab frame, facing downward, the substrate is brought up to the face pad and the pad grabs the substrate, referred to as the “substrate-pendant” test. Alternatively, the substrate is fixed and the device, face pad upward, is brought up to the substrate, referred to as the “device-pendant” test. Fig. 1B and Movie S1 show the SECAD in a substrate-pendant test. Initially, in the absence of applied voltage, the substrate does not stick to the SECAD face pad. Then, an applied voltage initiates adhesion. The substrate hangs at zero voltage against gravity until a “release” voltage pulse of opposite sign is applied. The SECAD is able to adhere repeatedly to substrates with a variety of roughness and wettability (Fig. 1D). In contrast, Fig. 1C and Movie S2 show the SECAD in a device-pendant test. Devices are able to adhere against their own weight plus a payload (the sum is called “capacity”) for several minutes before the detachment pulse is applied. The SECAD has compact size down to approximately 1 mm thick (Fig. 1E), no solid moving parts, and is made of common materials like water, glass, silicon, plastic, epoxy, and gold.
The main components of the assembled SECAD are shown in Fig. 2A. The top plate consists of an array of orifice holes from which the droplets protrude. The bottom plate includes a liquid reservoir and inlet port. The middle porous layer (for the experiments reported here, a glass frit) has a sufficiently large zeta potential to serve as EO pump‡ for controlling the volume of the droplets protruding from the top plate. The device is filled with distilled water as the working fluid. The metallized inner surfaces of the top and bottom plates serve as electrodes, to apply an electric field across the sandwiched middle layer. For all devices reported in this paper, a single pump feeds many holes while the concept includes the possibility of having an individually addressable pump for each hole, or many holes per pump and many pumps per device. See SI Text for more details.
Fig. 2.

SECAD schematic and operation. (A) Main components in cutaway (not to scale for clarity). Primary layers are labeled to the right. Letters indicate: (a) spacers; (b) holes from which droplets/bridges protrude; (c) wire interconnects to power supply; (d) electrodes; (e) epoxy seal; (f) fluid reservoir; (g) luer connector as reservoir continuation and filling port; (h) reservoir meniscus, depending on configuration; and (i) representative support post. (B) Operation of device with no substrate present. Also see Movie S3. (B.i.) is just before voltage pulse, t = 0 s, (B.ii.) is at t = 2.0 s. Device has ϵ = 440 μm, N = 100, V ≈ 12.5 V ( ).
).
Devices are fabricated in two ways: of hard plastic using a traditional machine shop (MS) approach, used for basic testing; and of silicon wafers (SW) by standard photolithography techniques, used to achieve compact size. Typical device dimensions are 2 × 2 cm, with thinness of 3–4 mm for SW devices. The smallest holes tested presently are ϵ = 150 μm, with N = 4876 for ϕ = 0.4. For a sense of the broad engineering challenges faced in the design, fabrication and actuation of a large array of droplets in unison, the reader is referred to Materials and Methods and SI Text.
Next we summarize pump theory and design. EO pumping arises from the electric double layer at a solid–liquid interface so that a material with large surface-area-to-volume is favored for the pump. Furthermore, according to the Smoluchowski approximation (17), pump pressures scale with the inverse square of pore size, favoring small pores. In the SECAD, successful switching between the attached and detached states requires a pump strength  sufficient to push out and pull back liquid,
  , where
 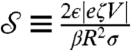 is a dimensionless measure of the EO driving force against the resistance to flow by capillarity. Here, e is the electric permittivity of the liquid, ζ is the zeta potential of the liquid/porous material, V is the electric potential drop across the pump, β is a scaling factor of order unity (see SI Text), and R is the effective pore radius of the pumping material (see Table S1 for typical values). Note that
  does not depend on N due to the parallel action of pressure across all holes in the top plate. In the absence of a substrate and for N = 2, the predictive capability of
  has been demonstrated in (14).
The time τ to switch between the attached and detached states is the time to move a requisite volume by the imposed flow rate of the pump. τ can be approximated by independently known parameters, 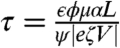 (see SI Text). Here α is the nondimensional spacer height (Fig. 1A, typical value is α ≈ 0.2), L the porous layer thickness, μ the liquid viscosity, and ψ the pump porosity. In the absence of a substrate and for N = 2, the basic scaling of τ with the inverse of V when
  has been demonstrated in (14).
Results
Basic EO control of the droplets is shown in Fig. 2B (i and ii) and Movie S3. Initially, the array of droplets extends barely above the top plate. A 12.5 V pulse applied to the pump for 2 s results in large droplets; no substrate is present. The observed EO flow takes about 180 ms for the droplets to reach hemispherical volume compared to a predicted τ = 150 ms. Fig. 2B suggests applications beyond adhesion. For example, surface properties other than wettability [e.g., optical properties such as absorbtion/reflection or optical lensing (18)] might be modified in real-time, or precise amounts of fluid might be delivered in microfluidic applications. Configurations like that in Fig. 2B (ii) are unstable over long times due to volume scavenging (14, 19). However, scavenging can be suppressed by designing a high interdroplet flow resistance; for example, by choosing a small pore size for the pump material.
Fig. 3A (Inset) shows the SECAD adjacent to the underside of a force transducer. This test measures time traces of force directly. The valve is set so that the device is subject to the free surface pressure which, for our test, is the ambient atmospheric pressure. Results from a typical experiment are shown in Fig. 3A (also see Fig. S1). Here, a 40 V “grab” pulse is applied to the electrodes for 100 ms (compare to predicted τ = 75 ms), after which the applied voltage is zeroed to allow for equilibration, and then a 400 ms release pulse of voltage of opposite polarity is applied. The corresponding time trace of the force shows an initial rapid rise during attachment as contacts are being made, followed by a slow rise over a second while the bridge shapes equilibrate with each other and with the free surface. After all bridges are broken the force returns to zero, as expected. The spike in force to 70 mN at the beginning of the release pulse is due to negative curvature as the “necked-in” bridges approach their breaking instability (compare to Fig. 1A Releasing).
Fig. 3.

Force-transducer experiment. (A) Force (Upper Plot) felt by substrate over time due to voltage pulses applied (Lower Plot). Inset: experimental setup. (B) Still image from attached state in (A). Also see Movie S4. The view is through the Plexiglas substrate, as indicated in (A Inset). Device has ϵ = 500 μm, N = 448, ϕ = 0.4, α = 0.16.
Fig. 3B is a corresponding still shot of the liquid bridge array, looking from an oblique angle through the Plexiglas substrate as indicated in the setup schematic (compare to beetle attachment in (8), Fig. 2F; also see Movie S4). No significant change in bridge appearance can be seen beyond the first ≈100 ms of attachment. Here 439 connections are made out of the possible 448 holes in the pad. Taking the water/Plexiglas contact angle into account (measured value of θc = 68°), we expect a force of F = Nσπϵ sin θc = 46 mN and measure ≈39 mN.
Results from the force-transducer experiments are collected in Fig. 4. This ensemble represents a variety of hole sizes, packing densities, fabrication techniques, control methods, and device-to-substrate gaps. Liquid bridge contact size can differ from hole size, so the ensemble average ϵmeas of their diameters is measured by image analysis. Normalization of the data to adhesion strength F/Ameas permits comparison (see Materials and Methods). The scatter in the data likely arises from several factors, such as slight variations in surface tension due to contamination or errors in measuring ϵmeas. However, all the data follow the basic trend of the perimeter force model, F/Ameas = 4σ sin θc/ϵmeas. For the curve in Fig. 4, we use measured values of θc = 68° and σ ≈ 55 mN/m (see SI Text) that is consistent with water contaminated by contact with plastic tubing and rubber syringes.
Fig. 4.

Adhesion strength F/Ameas versus contact size ϵmeas, using normalized values. Legend: fabrication type is silicon wafer (SW) or machine shop (MS); control is electroosmosis (EO) or manual syringe (syr).
It should be noted that the series of experiments reported in Fig. 4 gives further verification of the expression for τ given above. τ generally scales as expected when varying its dependent parameters, though the prediction does not show an accuracy better than 20%. A comparison of measurements to predictions can be found in Fig. S2.
Discussion
In addition to the perimeter force, surface tension can generate a force via the Young–Laplace pressure equal to σπκϵ2/4 per contact, where κ is the sum of the principal curvatures of the surface. In contrast to the perimeter force, which for bridges can only pull the substrate toward the liquid, the Young–Laplace force can either push or pull depending on the sign of κ. When pressure enhances perimeter adhesion, as occurs for necked-in bridges, we refer to this contribution as “shape suction.” An example of shape suction is the force-spike seen during release in Fig. 3A. By clamping the force at such a peak, for example by a valve closure or pump action, the adhesion strength of the SECAD can be amplified tenfold. Such an array of necked-in bridges can still be a stable equilibrium, so that no additional energy (beyond the energy necessary to decrease the volume and close the valve) is required to freeze the system at this elevated force.
Magnitudes of adhesion capacity are modest (order of 10 g) for the tested devices, but the scaling of adhesion strength verified in Fig. 4 suggests that much greater strengths are possible, even without shape suction. The general expression for adhesion strength (normal stress acting over net device area) based only on contact perimeter is:
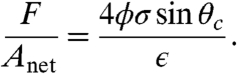 |
[1] |
The scaling laws presented here are illustrated in Table 1 and Table S2. Adhesion of 1 bar is predicted for a hole size between 1 and 10 μm. At the smallest droplet sizes, the adhesion strengths are competitive with synthetic bioinspired tapes or commercial adhesives and even approach the yield strength of plastics and aluminum, none of which enjoy the benefits of controlled grab/release.
Table 1.
Adhesion device scaling
| Hole size ϵ (μm) | Number N | Strength N/cm2 | Capacity (g) | Switch time τ (ms) |
| 1000 | 64 | 0.013 | 1.3 | 570 |
| 500 | 250 | 0.026 | 2.7 | 290 |
| 300 | 710 | 0.044 | 4.4 | 170 |
| 100 | 6400 | 0.13 | 13 | 57 |
| 10 | 6.4 × 10⁵ | 1.3 | 130 | 5.7 |
| 1 | 6.4 × 10⁷ | 13 | 1.3 kg | 0.57 |
| 0.1 | 6.4 × 10⁹ | 130 | 13 kg | 0.057 |
| 0.01 | 6.4 × 10¹¹ | 1300 | 130 kg | 0.0057 |
Based on device with area 1 cm2, hole packing ϕ = 0.5, clean water σ = 72 mN/m, applied voltage V = 10 V and no shape suction. Pump scaling is discussed in SI Text. One bar adhesion strength falls between ϵ = 10 and 1 μm.
The standard futuristic applications of adhesion-load-bearing Post-it-like notes, wall-climbing with “Spiderman” gloves, etc. will all benefit from our adhesion/control strategy. Further, imagine control with a precision that enables grab-release waves to be propagated along an active joint between two surfaces, one flexible and the other rigid, say. Then, zipping and unzipping of adhesive bonds against the flexible component opens the possibility of reconfiguring (morphing) objects to take different geometric shapes, all in real time. Alternatively, imagine the contacts as droplets covered by a thin membrane, so thin as to be still controlled by the pump but so thick that wetting is eliminated. In short, replace the liquid contact by an encapsulated liquid and activate such contacts like boxing gloves to exert a force on the adjacent substrate. Such a modification would make possible applications like a credit card device that can pry open a rock fissure (compare to Table 1).
Finally, a number of additional issues may be addressed in future studies, and here we provide brief insight into these based on the following observations. (i) Shear adhesion: Preliminary tests with the SECAD and substrate aligned vertically show similar magnitudes of strength in resisting shear as in resisting normal loads. It is thought that surface tension holds the substrate in place in the vertical orientation by providing the normal force needed for Coulomb friction between the substrate and solid spacer to prevent downward slipping. (ii) Evaporation: We have seen minimal signs of evaporation in the experiments, as evidenced by substrates successfully held for several minutes under a fixed-volume constraint. The very small volume of air between the pad and substrate is thought to rapidly become saturated, reducing evaporation. Beetle-contacting liquid is a C20–C28 chain hydrocarbon and, having a lower vapor pressure, evaporation is mitigated differently (20). (iii) Surface roughness: Adhesion for roughness-length scales both greater than and less than the droplet-scale are demonstrated in Fig. 1D. For larger-scale roughness, a device might conform better to the substrate shape by either being made of flexible materials or of a flotilla of subpads elastically connected to a master pad. (iv) Power consumption: Typical electrical currents through the device are on the order of milliamps for the subsecond voltage pulses required for grab/release (e.g., 1.3 mA for Fig. 3). At this current, a standard 9 V battery (capacity ≈500 mA·hr) can power on the order of one million half-second grab/release cycles. Note that switching times faster than τ = 1 ms should be possible with the device operating at voltages much less than 10 V for the smallest droplets in Table 1. (v) Coalescence: As a consequence of overfilling or volume-scavenging, coalescence can decrease the total contact perimeter. This can sometimes enhance adhesion by a modified shape suction bonus to the net force. The larger-than-expected payload under closed adhesion in Fig 1C is likely an example of such a coalescence benefit. (vi) Self-cleaning: Contamination of the device may lead to reduced surface tension, slower EO pumping, or moving contact lines. The system is suitable for operation in a self-cleaning mode where contaminants are expelled along with droplets that are overfilled until they detach from the device. Coupled with a superhydrophobic coating of the top surface, this self-cleaning mode might act similarly to the lotus leaf-cleaning mechanism (21, 22). (vii) Footprints: Upon detachment, the bridge pinch-off leaves behind a set of small droplets on the substrate, similar to the “footprints” of the beetle (20). This volume is a small fraction of the net bridge volume, and can be further minimized in the SECAD by tuning the spacer geometry. Micron-sized droplets correspond to femtoliter volumes, so even 107 micron-sized hemispheres amount to a total volume of only a few nanoliters. (viii) Addressability: Applications beyond simple grab-and-release are possible, e.g., individual or regional addressability of the droplets might allow real-time wettability gradients that could move objects along a trajectory (14).
Materials and Methods
Device Fabrication.
The silicon wafer (SW) devices consist of a top and bottom plate that are fabricated by standard photolithography methods. The silicon wafers were initially oxidized in an annealing furnace to achieve a 1.5 μm oxide layer. The wafers were then heated to remove any moisture prior to spin-coating with photoresist. Following a soft-bake of the resist, the hole array pattern was imprinted from a chrome mask onto the wafer by contact mask alignment, then hard-baked and exposed. Subsequently, the wafers were reactive-ion etched using the fluorine-based PlasmaTherm 72 and then deep-etched via Unaxis 770. The individual arrays were then cleaved from the wafer. An electrode was then evaporated on the inner surfaces of the plates (Layer 1: 120 Å of titanium; Layer 2: 1600 Å of gold).
Machine shop (MS) devices were made with traditional tools (standard drilling for holes) with Delrin (polyoxymethylene) used for top and bottom plates, and perforated stainless steel as electrodes.
Device Assembly.
The operation and performance of the MS and SW devices are very similar despite differences in assembly. In both cases a pumping layer is sandwiched between the top plate and bottom plate. SW devices are permanently held together and sealed by a bead of epoxy around the perimeter (note the lateral offset between top and bottom plates in Fig. 2A to aid in assembly). MS devices (Fig. 1B) are assembled with several rubber gaskets and clamped together with screws.
In substrate-pendant and device-pendant tests, spacers are used [Fig. 2A (a)] to control liquid bridge height. The spacers (approximately 25–60 μm thick) used in the experiments were made of a variety of materials, including tapes or shim stock bonded around the perimeter of the top plate. No spacers are used in “force-transducer” experiments so that the transducer registers the full adhesion force.
Force Measurements and Data Normalization.
The substrate is rigidly attached to a fast-response load cell (Transducer Techniques, GSO-10) that is connected to a personal computer with data acquisition card (National Instruments, PCI-6014). To compare force-transducer experiment results, the data must be normalized to account for variations between devices and experiments. Overfilling can cause contact line motion, as can be seen in the larger bridges along the outside edges in Fig. 3B. In this case, the overfilling is caused by the pump area extending slightly beyond the area covered by the hole array (compare Fig. 2A). For this reason, we use ϵmeas, which is the average measured contact diameter of all bridges (obtained via image analysis), rather than the nominal hole size. We also normalize the measured forces by the total measured wet contact area, 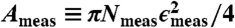 . For the experiment in Fig. 3, ϵmeas = 530 μm and the normalized adhesion strength is F/Ameas,wet = 403 Pa. Errors in ϵmeas can be as high as 10% due to limited camera resolution and imaging challenges.
Supplementary Material
Acknowledgments.
We thank Rob Ilic and Meredith Metzler of the Cornell NanoScale Facility (CNF) and Glenn Swan of the Olin machine shop for fabrication support. We also thank Dominik Barz, David Anderson, and Henrik van Lengerich for useful suggestions and assistance. This work was supported by National Science Foundation Grant CBET0653831 and Defense Advanced Research Planning Agency. This work was performed in part at the CNF, a member of the National Nanotechnology Infrastructure Network, which is supported by the National Science Foundation Grant ECS-0335765.
Footnotes
The authors declare no conflict of interest.
This article contains supporting information online at www.pnas.org/cgi/content/full/0914720107/DCSupplemental.
*Stefan (viscous) adhesion (9) is negligible under typical conditions for both the beetle and the present adhesion device. Another contribution to adhesion, curvature-based pressure adhesion, will be discussed later.
†In releasing itself, the beetle appears to employ a divide-and-conquer strategy of breaking bonds one at a time or in small groups by peeling, although details are not well-established (8).
‡Glass frits with very fine porosity (Robu, Rnominal = 1.3 μm) are used as the porous layer here and are sufficient for pumping against droplets down to ϵ = 300 μm at 10 V and are used in the present study. Despite a reduced zeta potential, other materials can, with finer pores, pump against even smaller droplets.
References
- 1.Autumn K, et al. Evidence for van der waals adhesion in gecko setae. Proc Natl Acad Sci USA. 2002;99:12252–12256. doi: 10.1073/pnas.192252799. [DOI] [PMC free article] [PubMed] [Google Scholar]
- 2.Waite JH. Adhesion a la moule. Integr Comp Biol. 2002;42:1172–1180. doi: 10.1093/icb/42.6.1172. [DOI] [PubMed] [Google Scholar]
- 3.Graham L, et al. Characterization of a protein-based adhesive elastomer secreted by the australian frog notaden bennetti. Biomacromolecules. 2005;6:3300–3312. doi: 10.1021/bm050335e. [DOI] [PubMed] [Google Scholar]
- 4.Barnes WJP, Oines C, Smith JM. Whole animal measurements of shear and adhesive forces in adult tree frogs: Insights into underlying mechanisms of adhesion obtained from studying the effects of size and scale. J Comp Physiol A. 2006;192:1179–1191. doi: 10.1007/s00359-006-0146-1. [DOI] [PubMed] [Google Scholar]
- 5.Majumder A, Ghatak A, Sharma A. Microfluidic adhesion induced by subsurface microstructures. Science. 2007;318:258–261. doi: 10.1126/science.1145839. [DOI] [PubMed] [Google Scholar]
- 6.Federle W, Riehle M, Curtis ASG, Full RJ. An integrative study of insect adhesion: Mechanics and wet adhesion of pretarsal pads in ants. Integr Comp Biol. 2002;42:1100–1106. doi: 10.1093/icb/42.6.1100. [DOI] [PubMed] [Google Scholar]
- 7.Lee H, Lee BP, Messersmith PB. A reversible wet/dry adhesive inspired by mussels and geckos. Nature. 2007;448:338–341. doi: 10.1038/nature05968. [DOI] [PubMed] [Google Scholar]
- 8.Eisner T, Aneshansley DJ. Defense by foot adhesion in a beetle (Hemisphaerota cyanea) Proc Natl Acad Sci USA. 2000;97:6568–6573. doi: 10.1073/pnas.97.12.6568. [DOI] [PMC free article] [PubMed] [Google Scholar]
- 9.Stefan J. Studies in apparent adhesion (in German) Sitzber Akad Wiss Wien (Abt II Math Phys) 1874;69:713–735. [Google Scholar]
- 10.De Souza EJ, Brinkmann M, Mohrdieck C, Arzt E. Enhancement of capillary forces by multiple liquid bridges. Langmuir. 2008;24:8813–8820. doi: 10.1021/la8005376. [DOI] [PubMed] [Google Scholar]
- 11.Reddy S, Arzt E, del Campo A. Bioinspired surfaces with switchable adhesion. Adv Mater. 2007;19:3833–3837. [Google Scholar]
- 12.Spina RL, et al. Controlling network-brush interactions to achieve switchable adhesion. Angew Chem Int Ed. 2007;46:6460–6463. doi: 10.1002/anie.200701796. [DOI] [PubMed] [Google Scholar]
- 13.Wischerhoff E, et al. Controlled cell adhesion on peg-based switchable surfaces. Angew Chem Int Ed. 2008;47:5666–5668. doi: 10.1002/anie.200801202. [DOI] [PubMed] [Google Scholar]
- 14.Vogel MJ, Ehrhard P, Steen PH. The electroosmotic droplet switch: Countering capillarity with electrokinetics. Proc Natl Acad Sci USA. 2005;102:11974–11979. doi: 10.1073/pnas.0505324102. [DOI] [PMC free article] [PubMed] [Google Scholar]
- 15.Steen PH, Ehrhard P, Vogel MJ. 11/496,242. USA patent application. 2006
- 16.Probstein RF. Physicochemical Hydrodynamics: An Introduction. New York: Wiley; 1994. [Google Scholar]
- 17.Rice CL, Whitehead R. Electrokinetic flow in a narrow cylindrical capillary. J Phys Chem. 1965;69:4017–4023. [Google Scholar]
- 18.López CA, Hirsa AH. Fast focusing using a pinned-contact oscillating liquid lens. Nat Photonics. 2008;2:610–613. [Google Scholar]
- 19.van Lengerich HB, Vogel MJ, Steen PH. Dynamics and stability of volume-scavenging drop arrays: Coarsening by capillarity. Physica D. 2009;238:531–539. [Google Scholar]
- 20.Eisner T, Eisner M, Siegler M. Secret Weapons. Cambridge: Belknap Harvard; 2005. p. 248. [Google Scholar]
- 21.Bathlott W, Neinhuis C. Purity of the sacred lotus, or escpae from contamination in biological surfaces. Planta. 1997;202:1–8. [Google Scholar]
- 22.Callies M, Quéré D. On water repellency. Soft Matter. 2005;1:55–61. [Google Scholar]
Associated Data
This section collects any data citations, data availability statements, or supplementary materials included in this article.