

Abstract
Evolution by natural selection has resulted in a remarkable diversity of organism morphologies that has long fascinated scientists and served to establish the first relations among species. Despite the essential role of morphology as a phenotype of species, there is not yet a formal, mathematical scheme to quantify morphological phenotype and relate it to both the genotype and the underlying developmental genetics. Herein we demonstrate that the morphological diversity in the beaks of Darwin’s Finches is quantitatively accounted for by the mathematical group of affine transformations. Specifically, we show that all beak shapes of Ground Finches (genus Geospiza) are related by scaling transformations (a subgroup of the affine group), and the same relationship holds true for all the beak shapes of Tree, Cocos, and Warbler Finches (three distinct genera). This analysis shows that the beak shapes within each of these groups differ only by their scales, such as length and depth, which are genetically controlled by Bmp4 and Calmodulin. By measuring Bmp4 expression in the beak primordia of the species in the genus Geospiza, we provide a quantitative map between beak morphology and the expression levels of Bmp4. The complete morphological variation within the beaks of Darwin’s finches can be explained by extending the scaling transformations to the entire affine group, by including shear transformations. Altogether our results suggest that the mathematical theory of groups can help decode morphological variation, and points to a potentially hierarchical structure of morphological diversity and the underlying developmental processes.
Keywords: Bmp4, craniofacial evolution and development, Geospiza, morphogenesis, morphological hierarchy
About a century ago, D’Arcy W. Thompson published his well-known “Theory of Transformations” as a chapter of his major work On growth and Form (1), in which he used geometrical transformations to qualitatively map the shape of one species onto that of another. Thompson’s work provided a powerful paradigm for the structure of evolutionary theory (2) and remains the most celebrated attempt to quantify the morphological diversity observed in the natural world. More recent studies have extended Thompson’s ideas (3, 4) and also analyzed the limits of biological form (5). However, the theory of transformations does not connect morphological diversity to phylogeny and developmental genetics (6). Even if transformations exist that allow mapping morphologies between every pair of distinct-looking species between and within taxonomical units, these need not be related to each other in any simple way, and hence reveal little about the underlying common origin in terms of developmental genetics or evolutionary continuity (6). To be informative, the geometrical transformations relating the morphological variation in different species must themselves be related to each other in a way that is meaningful in terms of both phylogeny and the underlying developmental genetics of morphogenesis.
We study here the case of morphological diversity in the beaks of Darwin’s Finches, the classical example of adaptive morphological radiation (7–9). Darwin’s Finches (Passeriformes) of the Galápagos and Cocos Islands are a monophyletic group of 14 closely related species of birds that have evolved substantial variation in beak morphologies, which allows them to occupy different ecological niches and exploit specific food items as diverse as seeds, nectar, insects, and young leaves (8, 9). Previous studies identified key components of the morphological differences in the beaks of Darwin’s Finches and established their adaptive significance (10–12). We examine this morphological adaptive diversity from a different perspective, and ask whether there is a mathematical structure underlying the divergent beak shapes that can be connected both to their phylogenetic relations and the developmental genetics of beak morphogenesis.
The genetic origin of beak shape variation within the genus Geospiza has been recently identified; Bmp4 expression in the beak primordium affects both beak width and depth (13), whereas Calmodulin expression modifies predominantly beak length (14). These observations suggest that the beak shapes of the species within this genus may differ simply by their scales (length, width, and depth), and thus it might be possible to superimpose their beak shapes onto a single common shape after normalizing each axis with its corresponding scale. Mathematically, this normalization is equivalent to a scaling transformation, in which each axis is stretched by a constant scaling factor (sℓ, sw, and sd for length, width, and depth axes, respectively).
To examine this hypothesis, we analyzed the beak profiles obtained from lateral pictures of museum specimens of male Darwin’s Finches (Fig. 1A, D). The condition of these specimens allows us to consider only the upper part of the bill profile (upper beak) of two individuals per species; this is not restrictive as the upper beak shape reflects the functional biomechanical properties of the entire bill (15) and its developmental origin is largely independent from the lower beak (16, 17). To determine whether two given (upper) beak shapes, y1(x) and y2(x), are related by a scaling transformation, we let Tsℓ,sd[y2(x)] denote the transformed shape (in which the length and depth are scaled by sℓ and sd, respectively), and then consider the differences Es(sℓ,sd) = ‖y1(x) - Tsℓ,sd[y2(x)]‖ and  , where y′(x) corresponds to the derivative of the shape along x and ‖·‖ denotes a distance metric (see Materials and Methods and also the SI Text). Thus, Es and Ed measure respectively how different the shapes and their derivatives are as a function of the scaling factors sℓ and sd. We then ask whether there exist values
  and
and  for which both measures Es and Ed have a global minimum. The values of Es and Ed at the minimum (the “residuals”) measure how closely y1(x) and y2(x) are related by scaling transformations.
Fig. 1.

Geometric relations among the beaks of Darwin’s Finches. (A) Example of digitization of a beak profile: (Top) Normal exposure picture of a museum specimen of the Large Ground Finch (Geospiza magnirostris). (Bottom) Underexposed picture of the same bird, with the outline of the bird silhouette traced in red. The zoomed region shows that the beak outline can be traced at pixel accuracy (Pixel size, 40 μm). See SI Text for further details. (B) Heat map resulting from all pairwise comparisons of beak shapes. The colored dots indicate the species, as labeled in D. Crosses (X) indicate pairs of species whose beaks do not collapse via scaling transformations, as there was no minimum in the defined measures Es and Ed as a function of the scaling factors. Conversely, comparisons not marked with an X indicate that there was a minimum. In this case the plotted color represents the residual  . The same results are obtained for the residuals
  . For those pairs marked with an X the plotted color indicates the minimal value of Es in the range of scaling factors that the experimental error allows to search for. The existence of a minimum in Es and Ed is not a guarantee of a collapse of the shapes; large values of the residuals are indicative of a lack of collapse. The beak shapes of all species in the genus Geospiza and that of the Blackfaced Grassquit (Tiaris bicolor) can be related through scaling transformations (Group A); the beak shapes of Tree (Camarhynchus), Cocos (Pinaroloxias inornata), and Warbler (Certhidea) Finches are also related to each other through scaling transformations (Group B); the beak shape of the Vegeterian Finch (Platyspiza crassirostris—Group C) cannot be collapsed on any other shape through scaling alone. (C) Scaling factors (obtained by minimization of the measures Es and Ed) that allow the collapse of the beak shapes of the species in groups A and B. The reference beak to which the scaling factors are referred to is arbitrary and chosen to be the Sharp-beaked Finch (Geospiza difficilis) in group A and the Small Tree Finch (Camarhynchus parvulus) in group B. (D) From left to right: Darwin’s Finches phylogeny modified from Ref. (18) and colored according to the morphological groups obtained with scaling transformations (Group A—orange; Group B—blue; Group C—pink); Lateral pictures of museum specimens of Darwin’s Finches and also the Blackfaced Grassquit (color dots label the species); Digitized beak shape profiles (the color of the shape profile indicates the species); Group structure under scaling transformations: (left) untransformed shapes and (right) shapes collapsed onto a common shape via scaling transformations with the scaling factors in C; Collapse of group shapes onto a common shape via a composition of shear (along the depth axis) and scaling transformations. We note that some of the Sharp-Beaked Finch populations are phylogenetically basal either only to the Geospiza Ground Finches or to Cocos and Vegetarian Finches (but not Warbler Finches) but share the group beak shape with both Geospiza and Grassquit. See Methods and the SI Text for a detailed description of the analysis.
We performed pairwise comparisons of the beak shapes of all Darwin’s Finches †. Fig. 1B shows a heat map of the residuals 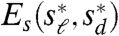 for the pairwise comparisons, with the different species clustered according to the similarity of their collapsed profiles. The heat map clearly identifies three morphological groups, within which the beak shapes are related through scaling transformations and, therefore, differ only by their scales (Fig. 1B, D). Remarkably, the first group (group A in Fig. 1B, D) corresponds to the genus Geospiza in addition to the Blackfaced Grassquit (Tiaris bicolor), representative of a group basal to Darwin’s Finches (18–20); the second group (group B in Fig. 1B, D) corresponds to the Tree (Camarhynchus), Cocos (Pinaroloxias inornata), and Warbler (Certhidea) Finches, whereas the third group (group C in Fig. 1B, D) consists of a single species, the Vegetarian Finch (Platyspiza crassirostris). The values of scaling factors that lead to the collapse of the beak shapes within each group are plotted in Fig. 1C. The scaling factors for group A show a strong positive correlation, indicating that the variation of beak morphologies within Geospiza is highly constrained; within group B the scaling factors are much more scattered, reflecting the substantially larger range of shapes spanned by birds as disparate as the Tree, Cocos, and Warbler Finches.
The group structure obtained from our analysis resembles closely the major groups identified in the latest phylogeny of Darwin’s Finches (18) (Fig. 1D), and shows that the morphologies of the beaks in the genus Geospiza derive directly from the Blackfaced Grassquit. Fig. 1D colors the phylogeny obtained from mitochondrial DNA studies (18) according to the morphological groups obtained here, highlighting the positions of possible morphological transitions in the phylogeny that lead to changes in beak morphology beyond simple changes in length and depth. The current phylogeny implies that three different transitions are required to explain the morphological group structure, namely two convergent transitions for the group consisting of Tree, Cocos, and Warbler Finches and one unique Vegetarian Finch transition.
Scaling transformations account for a substantial component of the variation observed in the beak shapes of Darwin’s Finches by reducing the complexity from 14 original beak shapes to three different (group) shapes. Mathematically, scaling transformations form a subgroup of the group of affine transformations, which also includes shear transformations. By construction, the differences between group shapes cannot be explained via scaling transformations. However, we find that by combining shear (along the axis of beak depth) and scaling transformations, all shapes collapse onto a single common shape (Fig. 1D). Additionally, we compared the beak shapes of Darwin’s Finches to a more phylogenetically distant relative, the African Seedcracker (Pyrenestes ostrinus), from a different finch family (Estrildidae), and found that their beak shapes cannot be collapsed with either of Darwin’s Finches groups under affine transformations. This analysis demonstrates that the (species- and genus-level) beak shapes of all Darwin’s Finches are related by affine transformations, characterized by precisely three parameters: the depth and length (sd and sℓ equivalently) for the scaling transformation and an additional parameter measuring the degree of shear.
The beak shapes analyzed so far correspond to the outline of the keratin horny sheath of the beak (rhamphotheca), which is established by the underlying bone structure. In order to find out if the bone structure of the upper beak follows the same scaling behavior than the keratin profiles, we performed (micro) Computed Tomography scans of the heads of specimens of the different species in the genus Geospiza, and compared their upper beak bone profiles obtained from midsaggital cuts of the three-dimensional reconstructions (Fig. 2; see Materials and Methods for details). Fig. 2D shows that the bone profiles of the upper beak of the different species in Geospiza collapse under scaling transformations up to a point where the contours start diverging from each other. Analysis of the midsaggital cuts shows that this divergence point corresponds to a precise anatomical feature, the location where the keratin sheath ends, which coincides with the starting point of a bony hinge that connects the beak to the skull. Therefore, both the bone structure and keratin layer of the upper beaks of the species in the genus Geospiza are related by scaling transformations.
Fig. 2.

Midsaggital cuts of three-dimensional reconstructed heads of the different species in Geospiza obtained by Computed Tomography (CT) scans. (A) Example of a three-dimensional reconstruction of a bird skull obtained by CT showing the plane corresponding to a midsaggital cut. (B) Midsagittal cuts obtained from three-dimensional reconstructions of CT scans for the different species in the genus Geospiza. Color dots label the species. Red arrows show the top-most position of the keratin layer indicating that soft tissue is found beyond this point. (C) Zoom of the upper part of the beak of the Medium Ground Finch (Geospiza fortis) showing the digitized outline of the bone structure of the upper part of the beak (orange curve). (D) Outlines of the bone structure of the upper part of the beak for the different species shown in B collapsed via a nonuniform scaling transformation. The dashed line indicates the position of the divergence point (see main text).
A complete description of morphological diversity requires an explicit connection between the expression levels of the genes involved in shaping the beak and the parameters characterizing the transformations. Since Bmp4 expression in the beak primordium at embryonic stage 26 has been shown to correlate with adult beak morphology in Geospiza (13), we performed Bmp4 in situ hybridizations in midsaggital sections of the frontonasal mass of three specimens from each of the species in Geospiza at stage 26 (Fig. 3A; see Materials and Methods for details). Bmp4 expression in the frontonasal mass displays a spatial pattern with maximal mesenchymal Bmp4 levels close to the distal tip of the beak, and high levels of Bmp4 in the epithelium (Fig. 3B, C). We found that the maximal Bmp4 expression in the mesenchyme, normalized to epithelial levels, shows the best correlation with morphology (see Materials and Methods and also the SI Text). Fig. 3D shows the relation between maximal Bmp4 expression levels in the frontonasal mass at embryonic stage 26 and the scaling factors which, as shown above, fully quantify the adult beak morphological diversity in Geospiza (Fig. 1C, D). Increasing levels of Bmp4 lead predominantly to deeper beaks (Fig. 3D), with a nonlinear relation between Bmp4 expression and beak depth. Beak length also correlates with Bmp4 expression (Fig. 3D), although not as strongly as beak depth. While it is possible that a different measure of Bmp4 expression correlates with only one spatial direction, our data suggests that Bmp4 expression affects all spatial directions, albeit not in the same way. The last statement is likely to hold for other genes involved in shaping the beak (13, 14).
Fig. 3.

Relation between beak morphological variation and Bmp4 expression differences in the beak promordium across the species in the genus Geospiza. (A) In situ hybridizations showing the expression levels of Bmp4 in midsaggital sections of the fronotnasal mass of embryos of the different species in Geospiza at embryonic stage 26. Color dots label the species. (B) Definition of the length (x) and depth (y) axes in the frontonasal mass. The zoom of the tip of the frontonasal mass (dashed box) shows the outline of the epithelium (green) and Bmp4 expression (red). The white circle highlights the region of maximal mesenchymal expression. The measure of Bmp4 expression used in the comparison with geometric variation is: I ≡ IM/IE, where IM corresponds to the maximal mesenchymal level of Bmp4 expression and IE to the Bmp4 expression level in the epithelium. (C) Intensity profile of Bmp4 expression along the x (length; C.1) axis and along the y (depth; C.2) axis. Axes are defined in B. (D) Relation between Bmp4 expression levels and scaling factors for the different species in Geospiza, showing that Bmp4 expression correlates better with beak depth (D.1) than with beak length (D.2). The measure of Bmp4 expression, I, is shown relative to the expression level in the Sharp-Beaked Finch (G. difficilis) because the scaling factors are relative magnitudes and chosen here to be relative to the Sharp-Beaked Finch. Error bars in the measure of Bmp4 expression correspond to the standard deviation of the mean, obtained from three specimens of each species. Same color code as in A.
Discussion
The work described herein outlines a mathematical framework for describing and quantifying morphological diversity. In Darwin’s Finches, scaling transformations classify beak morphologies into three groups. These unique group shapes can belong either to a single species (Vegetarian Finch), to a group of species within a single genus (Geospiza), or even to species that reside in multiple genera (Tree, Cocos, and Warbler Finches). Phylogeny suggests that all the members of Geospiza retained and exploited the beak shape they inherited from the last common ancestor of all Darwin’s Finches, echoing Charles Darwin, who first fancied that “from an original paucity of birds in this archipelago [Galapagos], one species had been taken and modified for different ends.” (21). Expanding the transformations to the entire affine group by adding shear transformations allows to account for the variation among group shapes and, therefore, for all the differences of beak morphologies in Darwin’s Finches. Changes in gene expression of signaling molecules in the developing beak appear to control the scaling factors (scales) and to capture variation in beak morphology within groups of species, as in the genus Geospiza. The necessity of including shear transformations to explain the full morphological variation in the beaks of Darwin’s Finches suggests the involvement of more significant developmental changes. This could include modifications in earlier embryonic development, such as the formation of dissimilarly patterned skeletal condensations that result in a distinct morphogenetic maps. Thus, the observed beak shape convergence in Tree, Cocos, and Warbler Finches likely reflects that these distinct species employ a similar underlying developmental mechanism, though possibly with different molecular implementation. More generally, the hierarchical morphological structure uncovered here is likely related to the hierarchical structure of developmental regulatory networks, which are thought to be the proximate cause of evolutionary changes in morphology (22, 23). Further research is needed to find out whether this morphological group scheme generalizes to beak morphologies in other birds, and indeed, to the greater morphological diversity itself.
Materials and Methods
Shape Analysis.
The shapes used for analysis were from specimens in the Museum of Comparative Zoology at Harvard University. Lateral pictures of the specimens were obtained with a camera Nikon-D80 and the outline of the beak was determined with a feature detection program (SteerableJ—ImageJ). The obtained outlines (beak shapes) were compared using Mathematica 6 (Wolfram Research). The distance metric used to measure the differences between shapes is defined by
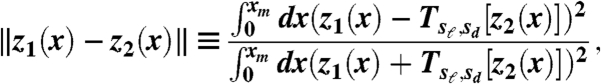 |
[1] |
where z1(x) and z2(x) are real functions and Tsℓ,sd[·] corresponds to a scaling transformation with scaling factors sℓ and sd in the length and depth directions, respectively. See SI Text for more details.
(Micro) Computed Tomography (CT) Scans.
CT scans were performed on specimens of G. difficilis, G. magnirostris, and G. conirostris from the Museum of Comparative Zoology at Harvard University, and on preserved specimens of G. fuliginosa, G. fortis, and G. scandens. High-resolution three-dimensional images of the heads of the specimens were taken using an XRA-002 microCT scan (X-Tek) available at the Center for Nanoscale Systems at Harvard University. Three-dimensional reconstructions were performed with CTPro (Metris) and VGStudio Max 2.0 (Volume Graphics). Midsaggital cuts were obtained from the three-dimensional reconstructions. Bone profiles were determined with a feature detection program (SteerableJ—ImageJ) and compared using Mathematica 6 (Wolfram Research).
in Situ Hybridizations.
The protocol used for Bmp4 in situ hybridizations is very similar to that described in (13). Embryos were harvested at stage 26 according to our altricial avian development staging series (13, 14). Embryonic material was fixed in 4% paraformaldehyde in PBS for 2 h at ambient temperature and stored in RNAlater reagent (Ambion) at about 5 °C for 2–5 weeks. The heads were rehydrated in PBS, frozen in Tissue-Tek OCT compound, and sagittally cryosectioned. Chick antisense riboprobes were prepared and used on Darwin’s Finch embryos as described in (24). For each one of the specimens analyzed, the fluorescence intensity value of maximal mesenchymal Bmp4 expression (IM) was normalized to the fluorescence intensity value of epithelial Bmp4 expression (IE), and only normalized values of maximal mesenchymal Bmp4 expression, defined as I ≡ IM/IE, were used for comparison to other specimens (see Fig. 3 and SI Text).
Supplementary Material
Acknowledgments.
We thank the Harvard Museum of Comparative Zoology for their help and K. Foster, P. Grant, M. Hauser, B. Shraiman, and C. Tabin for useful discussions and comments. This work was supported the Kavli Institute for Bio Nano Science and Technology at Harvard University, the National Science Foundation through the Division of Mathematical Sciences, and the Harvard Materials Research Science and Engineering Center (MRSEC); the National Institutes of Health through Grant P50GM068763; A.A. and R.M. were partially supported by National Science Foundation Grant 10B-0616127.
Footnotes
The authors declare no conflict of interest.
This article is a PNAS Direct Submission.
This article contains supporting information online at www.pnas.org/cgi/content/full/0911575107/DCSupplemental.
†We analyzed all species of Darwin’s Finches available in the Harvard Museum of Comparative Zoology.
References
- 1.Thompson DW. On growth and form. 2nd ed. New York: Dover; 2002. p. Chapter 17. reprint of 1942 (1st ed, 1917) [Google Scholar]
- 2.Gould SJ. Ontogeny and Phylogeny. Cambridge: Harvard Univ Press; 1977. [Google Scholar]
- 3.Bookstein FL. The Study of shape transformation after D’Arcy Thompson. Mathematical Biosciences. 1977;34:177–219. [Google Scholar]; Bookstein FL. Morphometric tools for landmark data: Geometry and Biology. Cambridge, United Kingdom: Cambridge Univ Press; 1997. [Google Scholar]
- 4.Stone JR. The spirit of D’Arcy Thompson dwells in empirical morphospace. Mathematical Biosciences. 1997;142:13–30. doi: 10.1016/s0025-5564(96)00186-1. [DOI] [PubMed] [Google Scholar]
- 5.McGhee GR. Theoretical Morphology. New York: Columbia Univ Press; 1999. [Google Scholar]
- 6.Arthur W. D’Arcy Thompson and the theory of transformations. Nat Rev Genet. 2006;7:401–406. doi: 10.1038/nrg1835. [DOI] [PubMed] [Google Scholar]
- 7.Darwin C. On the origin of species by means of natural selection, or the preservation of favored races in the struggle for life. New York: D. Appleton and Company; 1860. [Google Scholar]
- 8.Grant PR, Grant BR. How and why species multiply: The radiation of Darwin’s Finches. Princeton, New Jersey: Princeton Univ Press; 2008. [Google Scholar]
- 9.Lack D. Darwin’s Finches. Cambridge, United Kingdom: Cambridge Science Classics; 1983. [Google Scholar]
- 10.Bowman RI. Morphological differentiation and adaptation in the Galapagos Finches. Vol 58. Berkeley, CA: University of California Press; 1961. (University of California publications in Zoology). [Google Scholar]
- 11.Boag PT. Growth and allometry of external morphology in Darwin’s Finches (Geospiza) on isla Daphne Major, Galapagos. J Zool. 1984;204:413–441. doi: 10.1111/j.1558-5646.1983.tb05618.x. [DOI] [PubMed] [Google Scholar]
- 12.Foster DJ, Podos J, Hendry AP. A geometric morphometric appraisal of beak shape in Darwin’s Finches. J Evol Biol. 2008;21:263–275. doi: 10.1111/j.1420-9101.2007.01449.x. [DOI] [PubMed] [Google Scholar]
- 13.Abzhanov A, et al. Bmp4 and morphological variation of beaks in Darwin’s Finches. Science. 2004;305:1462–1465. doi: 10.1126/science.1098095. [DOI] [PubMed] [Google Scholar]
- 14.Abzhanov A, et al. The calmodulin pathway and evolution of elongated beak morphology in Darwin’s Finches. Nature. 2006;442:563–567. doi: 10.1038/nature04843. [DOI] [PubMed] [Google Scholar]
- 15.Herrel A, Podos J, Huber SK, Hendry AP. Evolution of bite force in Darwin’s Finches: A key role for head width. J Evol Biol. 2005;18:669–675. doi: 10.1111/j.1420-9101.2004.00857.x. [DOI] [PubMed] [Google Scholar]
- 16.Helms JA, Schneider RA. Cranial skeletal biology. Nature. 2003;423:326–331. doi: 10.1038/nature01656. [DOI] [PubMed] [Google Scholar]
- 17.Helms JA, Cordero D, Tapadia MD. New insights into craniofacial morphogenesis. Development. 2005;132:851–861. doi: 10.1242/dev.01705. [DOI] [PubMed] [Google Scholar]
- 18.Petren K, Grant PR, Grant BR, Keller LF. Comparative landscape genetics and the adaptive radiation of Darwin’s Finches: The role of peripheral isolation. Mol Ecol. 2005;14:2943–2957. doi: 10.1111/j.1365-294X.2005.02632.x. [DOI] [PubMed] [Google Scholar]
- 19.Sato A, et al. On the origin of Darwin’s Finches. Mol Biol Evol. 2001;18:299–311. doi: 10.1093/oxfordjournals.molbev.a003806. [DOI] [PubMed] [Google Scholar]
- 20.Burns KJ, Hackett SJ, Klein NK. Phylogenetic relationships and morphological diversity in Darwin’s Finches and their relatives. Evolution. 2002;56:1240–1252. doi: 10.1111/j.0014-3820.2002.tb01435.x. [DOI] [PubMed] [Google Scholar]
- 21.Darwin C. The Voyage of the Beagle. New York: Penguin Books; 1989. reprint of 1839 published by Henry Colburn. [Google Scholar]
- 22.Erwin DH, Davidson EH. The evolution of hierarchical gene regulatory networks. Nat Rev Genet. 2009;10:141–148. doi: 10.1038/nrg2499. [DOI] [PubMed] [Google Scholar]
- 23.Gerhart J, Kirschner M. Cells, embryos, and evolution. Boston: Blackwell Science; 1997. [Google Scholar]; Kirschner M, Gerhart J. Evolvability. Proc Natl Acad Sci USA. 1998;95:8420–8427. doi: 10.1073/pnas.95.15.8420. [DOI] [PMC free article] [PubMed] [Google Scholar]
- 24.Abzhanov A. Emerging model organisms: A laboratory manual. Vol 1. NY: CSHL Press; 2009. p. Chapter 20. [Google Scholar]
Associated Data
This section collects any data citations, data availability statements, or supplementary materials included in this article.