

Abstract
Myosin II is a molecular motor that converts chemical to mechanical energy and enables muscle operations. After a power stroke, a recovery transition completes the cycle and returns the molecular motor to its prestroke state. Atomically detailed simulations in the framework of the Milestoning theory are used to calculate kinetics and mechanisms of the recovery stroke. Milestoning divides the process into transitions between hyper-surfaces (Milestones) along a reaction coordinate. Decorrelation of dynamics between sequential Milestones is assumed, which speeds up the atomically detailed simulations by a factor of millions. Two hundred trajectories of myosin with explicit water solvation are used to sample transitions between sequential pairs of Milestones. Collective motions of hundreds of atoms are described at atomic resolution and at the millisecond time scale. The experimentally measured transition time of about a millisecond is in good agreement with the computed time. The simulations support a sequential mechanism. In the first step the P-loop and switch 2 close on the ATP and in the second step the mechanical relaxation is induced via the relay and the SH1 helices. We propose that the entropy of switch 2 helps to drive the power stroke. Secondary structure elements are progressing through a small number of discrete states in a network of activated transitions and are assisted by side chain flips between rotameric states. The few-state sequential mechanism is likely to enhance the efficiency of the relaxation reducing the probability of off-pathway intermediates.
Keywords: conformational transitions, molecular motors, rate calculations, reaction path, long time dynamics
We consider the function of the protein myosin II (for a review see ref. 1). Myosin plays a key role in the contraction of muscles and carries out a cycle of “power” and “recovery” strokes that convert chemical to mechanical energy. A concrete model for the cycle was proposed by Lymn and Taylor (2) in 1971, a model that captures the essential steps of the process. Myosin is made of a large globular head plus a long, lighter tail. Pairs of myosin molecules self-assemble by winding their tails into a coiled coil, forming double-headed structures. These pairs then aggregate to form a long thick filament that aligns itself with a thinner filament of the complementary protein actin, such that individual myosin heads bind to individual actin monomers. These filaments bundle together to form muscle fibers, and muscle contraction consists of the sliding of actin and myosin filaments past one another. The cycle requires an input of energy, which myosin obtains by hydrolyzing adenosine triphosphate (ATP).
In the present manuscript we focus on one segment of the cycle, the recovery stroke. Of course, to understand the complete cycle the recovery and the power strokes are needed. While the power stroke is the step in which useful mechanical force is generated, the motions of myosin during the power stroke are similar to the transition (in reverse) of the recovery stroke. The recovery stroke is simpler to understand since it does not involve actin. It therefore makes sense to study the simpler process first and to learn about protein motions that are likely to be relevant for the power stroke too. The present investigation allows us to propose that the fluctuations of switch 2 help drive the system during the power stroke. Experiments illustrate that a single molecule is capable of conducting a recovery stroke in which a myosin molecule with a bound nucleotide relaxes from its post power-stroke conformation to a pre power-stroke state (3–5). Key structural features of the transition were observed by crystallographic studies of the end points (6–8) and gave considerable insight to molecular mechanisms of the transition. During the recovery stroke, there is no release of a nucleotide until the initiation of the power stroke.
The coupling of local to global displacements is particularly intriguing in the field of allosteric proteins and molecular motors. As a rule of thumb these systems are initiated by highly local structural perturbations that develop to large-scale displacements. It is therefore of considerable interest to examine the mechanism of the postrecovery stroke in myosin in which a local to global transition occurs. Upon binding of an ATP molecule the protein executes a biologically important motion at a large scale. The mechanism in which global motions are coupled to local transitions was the focus of intensive modeling. However atomically detailed simulations at the biological time scale and at room temperature are not available.
Fischer et al. (9–13) outlined in a series of papers a mechanism in which local hydrogen bonding to the ATP is a seed to the collective tail-swing component of the recovery stroke. However, Fischer’s studies were based primarily on a minimum energy path (9) or interpolation of short time dynamics at the neighborhood of the end points (13). These calculations provide considerable intuition to mechanisms and were the base for successful mutation experiments (14). However, direct link of the structure to function (measurements of kinetics and thermodynamics) is lacking. The first passage time calculations of the present study make it possible to compare the simulation results to experimental rate, a characteristic of protein function, and to examine the contribution of entropy to the process.
Interesting studies by Cui et al. employed Targeted Molecular Dynamics and other analyses (15–17) to elucidate important residues and to propose alternative pathways to the process. These studies provide additional insight to the process and probe the system at room temperature, which is clearly an advantage compared to the minimum energy path calculations. However, the biasing force of the targeted dynamics is an approximation that impacts the time scale of the process and may change the basic mechanism. Another study computed the potential of mean force along assumed reaction coordinate (18) (the (RMSD), Root Mean Square Distance, with respect to the end points). Similar to the Targeted Dynamics approach the advantage is consideration of room temperature thermodynamics. The assumed reaction coordinate is a disadvantage.
We introduced the method of Milestoning (19–21) as an approach to compute efficiently (using atomically detailed models) kinetics of complex macromolecules at time scales not approachable by straightforward Molecular Dynamics (MD). Milestoning is a theory and an algorithm that are outlined in the Method section and in the supplementary material. Detailed accounts of Milestoning are available (21, 22). It was used to investigate a number of complex biological molecules (folding of a helical peptide (19), allosteric transition in Scapharca hemoglobin (20). Here we apply the same technology to the recovery stroke in myosin.
Results
Comparison to Experimental Rates.
Already in 1998 the time scale of the recovery stroke was estimated to be a few milliseconds (3). More recently and based on the data of Málnási-Csizmadia et al. (14) the rate is estimated as 0.3–1.4 ms. The calculation of the overall first passage time for the transition uses Eq. 2 to give 0.5 ± 0.1 ms. The error bars are determined by repeating the calculation with half of the data.
Analysis of the Recovery Mechanism.
The sample set.
Milestoning does not provide continuous trajectories from the reactant to the product state. Instead we have a large collection of short trajectories between Milestones that describe the propagation of the nonequilibrium density that we match at the Milestones (24) (Fig. 1). For analysis we use one conformation of each of the trajectories of milestone s (21).
Fig. 1.

A schematic representation of the Milestoning calculations. The thick black line is the reaction coordinate leading from state A to state B. Hyperplanes perpendicular to the reaction (Milestones) are presented by dashed lines. Different initial conditions at the Milestones (dashed lines) are used to start trajectories at one Milestone until they terminate at nearby Milestones. Two sample trajectories are shown (thinned arrow lines in red and in blue). The trajectories start at Milestone s and terminate at Milestones s ± 1. The transition kernel Ks,s′(τ) is the probability density that a trajectory initiated at s′ will terminate at s at time τ. See text for more details.
Mechanistic questions.
The following mechanistic questions are addressed: (i) does the process require a highly collective and simultaneous motions of many elements; (ii) do the elements move independently, or are they coupled in sequence; (iii) are the motions of the side chains and the secondary structure elements activated or diffusive?
We consider motions of secondary structure elements: the SH1 and the relay helices, the P-loop, switch 1 (SW1) and switch 2 (SW2) (Fig. 2). To facilitate the discussion below we sometimes group the P-loop, SW1, and SW2 as the “starter” and the group of the relay and the SH1 helices as the “engine”. In Fig. 3 we show the core secondary structure elements at the pre- and postrecovery states. We also show a close-up of early events near the ATP (space filling model).
Fig. 2.

(A) A ribbon model of myosin II, prepared by the ZMOIL program (available from the author), is shown. The secondary structure elements, which are the focus of the analysis, are in different colors: SH1 681-690 (red) ; relay helix 466-498 (blue) ; P-loop 179-186 (yellow); SW1 233-238 (pink) ; SW2 454-459 (white/gray).
Fig. 3.

(A) A display of the machine core at the pre and postrecovery states: P-loop (purple), SW1 (blue), SW2 yellow-green, relay helix red, and SH1 helix yellow. (B) Display of the neighborhood of the ATP binding site with the same color code as in (A), the left is the prerecovery conformation and on the right the structure after 1/8 of the process along the reaction coordinate. Note the slight adjustments of switch 2 and the P-loop.
In Fig. 4 we examine the correlation of the motions of the P-loop and the relay helix. For each of the structures in the set we compute the RMSD between the P-loop of the current structure and the structure of the P-loop of the reactant (prerecovery structure). The RMSD is computed after optimal (rigid) overlaps of the two P-loops (34). For the same structure we also compute the center of mass shifts of the relay helix with respect to the initial structure. A point on the graph has the P-loop RMSD along the horizontal and the relay helix center of mass displacement along the vertical. Fig. 4 has a general J-shape, suggesting that the internal changes in P-loop are performed early without corresponding changes in the relay helix.
Fig. 4.

Correlated motions of secondary structure elements. We compare coordinates of secondary structure elements taken from a single snapshot of (Milestoning) time with respect to the prerecovery conformation. The horizontal is the RMSD of the P-loop and the vertical is the displacement of the center of mass of the relay helix (CM).
The mean first passage time from the prerecovery conformation to completing the P-loop rearrangements (computed with Milestoning) is 340 ns, significantly shorter than the time scale of the complete process. Hence we anticipate an experimental time delay of hundreds of nanoseconds before noticeable repacking of secondary structure elements and the delay is used to adjust local binding to the ATP. A similar correlation is observed for switch 2 and relay helix (SI Text).
Once the P-loop reaches its final RMSD value the relay helix starts to act. The changes in the relay helix are not coupled to further changes in the RMSD of the P-loop. The most straightforward interpretation of the results would be of a sequential process. First the P-loop is changing conformation to the postrecovery state and only then the relaxation is transmitted to the mechanical arm (engine).
Other interesting correlated motions are between the components of the “engine”: the relay and SH1 helices. In Fig. 5 we show the motion of the center of masses of these secondary structure elements. In contrast to Fig. 4A, coupled, simultaneous motions are observed. While the motion of the two helices is strongly coupled, it is not a rigid displacement of a single composite entity. Of particular interest are the two distinct linear correlations of displacements. A critical magnitude of displacement is about 1–1.5 Å. Below the critical point the slope of cooperative motion shows a larger displacement for the relay helix compared to SH1. After the critical point the SH1 helix is moving at a faster rate compared to the relay helix.
Fig. 5.

The same as in Fig. 4, this time the center of masses of the relay helix (horizontal) and the SH1 helix (vertical).
An observation leading to speculation on a driving force for the power stroke is provided in Fig. 6. We examine the distribution of distances of switch 2 conformations from a reference structure. We examine the distributions for the first and the third components of the recovery. The distribution is significantly broader at the beginning of the reaction, suggesting that the prerecovery (post power) state is entropically favored compared to the postrecovery state. Of course, during the recovery stroke favorable hydrogen bonding with the ATP pushes the system into the postrecovery conformation and against the above entropy gradient. We propose that during the power stroke (in which ATP is no longer present) changes in the entropy of switch 2 contribute to the power stroke.
Fig. 6.

The distributions of phenylalanine 487 χ1 dihedral angle as observed for three slices along the reaction coordinate (and the corresponding Milestones). The first third of the Milestones contributes to the black histograms. The red histograms are from the center, and the green histograms the last.
Side chain motions are activated between a few discrete states and assist secondary structure transitions. F487 has a significantly different dihedral angle value in the x-ray structure of the prerecovery and postrecovery conformations, supporting the conformational transition of the relay helix. In Fig. 7 we show the binned distribution of the angles as sampled from the trajectory fragments. The distribution is sharply peaked suggesting an activated process. The figure is colored according to the position of the Milestones along the reaction coordinate. The distribution is quite wide at the beginning (the black line), getting narrower in the middle of the path (the sharp red peak) and getting broader again towards the end. We comment that the narrowing at the transition state is somewhat unexpected and that there are no path constraints applied on the side chains. The transition we observe is in response to the backbone pathway that was found with the optimization of the functional of Eq. 2.
Fig. 7.

The fluctuations of the switch 2 from Milestoning trajectories near the prerecovery stroke (black) and at the postrecovery stroke (red). Note the significantly wider distribution of the black curve suggesting more favorable entropy of switch 2 at the prerecovery state.
It is (perhaps) not very surprising to find side chains in discrete states. Rotamer libraries (35), modeling side chain conformations as discrete, have been used to predict protein structures for a long time. It is more intriguing that we observed a similarly activated behavior also for the secondary structure elements that we examined earlier. In Fig. 8 we show mildly peaked probability density of observing the SH1 helix at different values of the center of mass (the zero is at the prerecovery conformation). Peaked distributions are indicators for activated processes. Similarly peaked distributions are observed for other elements and suggest that the process can be described as a sequence of activated transitions between a small number of states.
Fig. 8.

The probability density of the center of mass of the SH1 helix extracted from all the Milestoning trajectories. Note the moderately peaked distribution that suggests free energy minima (meta-stable states) and activated transitions between them. Similar plots were obtained for other secondary structure elements in one or more dimensions.
Discussion
In the present paper we provide a concrete, atomically detailed model with explicit solvation for the recovery stroke in myosin II. The model is consistent with available experimental rate and suggests a well focused sequential mechanism in which side chains and secondary structure elements progress through a small number of states and free energy barriers. In accord with this experiment we predicted time scale in the millisecond range. We made two unique mechanistic observations that can be tested experimentally: (i) The existence of a time delay (hundreds of nanoseconds) to complete the conformational rearrangements at the ATP binding site prior to motions of the “engine”. (ii) An entropic contribution of switch 2 to the power stroke. The last prediction can be tested by rigidifying switch 2. For example, replacing serine 456 by a proline. The coarse graining that occurs in nature from atomic resolution to secondary structure motion creates a sequential machine of relatively small number of parts that are either strongly coupled or facilitate the motions of each other via sequential mechanism. The relatively small number of discrete free energy minima reduces the probability for off-the-pathway motions. The calculations of millisecond rate are made possible by a combination of a reaction coordinate and stochastic modeling. Only short trajectories are computed to determine a transition kernel, a procedure that extends the time scale of molecular dynamics by many orders of magnitude (see refs. 20 and 21 and SI Text for further discussions about algorithm efficiency).
Materials and Methods
Motivation.
We consider a system of N particles (3N degrees of freedom) with a coordinate vector X∈R3N and a potential energy U(X). We wish to describe its transition from the state R (reactants) to state P (products). The overall mean first passage time (MFPT) is the average time to reach P for the first time starting from R. The average is performed over initial conditions in R. The inverse of the MFPT is a widely accepted measure for the rate of the process. If the population decay of the reactants is exponential in time then the inverse of the MFPT is the usual rate constant.
In principle, the MFPT can be calculated numerically. Trajectories are initiated at R and are integrated forward in time until they reach P. Their arrival times to P are recorded and the trajectories are terminated. The average over the trajectory termination times is the MFPT. The problem with such a straightforward approach for the myosin system is that the “reactive” trajectories (trajectories that complete the recovery stroke) are of milliseconds (5, 14). This time scale is too long for straightforward MD simulations that are typically restricted to submicrosecond time scale. Moreover, for the calculation of the MFPT an ensemble of trajectories (and more computational resources) are required to compute the average time. Milestoning makes it possible to compute kinetics with atomically detailed models even for overall millisecond time scales. Details on the theory of MFPT calculation are provided in SI Text and in refs. 21–23. We briefly discuss main ideas below.
MFPT Formula.
At the core of the Milestoning theory one finds the kernel matrix K(τ) with elements Kss′(τ). The elements are the probability densities (in time) that the system at “milestone” s′ will transition to “milestone” s at time τ. A milestone is a hypersurface orthogonal to a reaction coordinate and the Kss′(τ) are computed from short trajectories starting at Milestone s′ and terminating (touching for the first time) at milestone s (22) (Fig. 1). Representing the reaction as a sequence of transitions between Milestones we can write an equation for the probability flow (22)
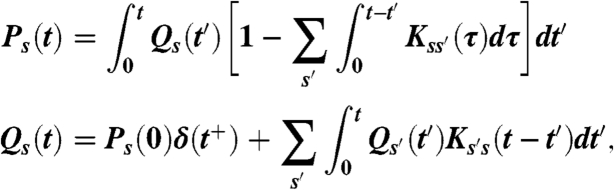 |
[1] |
where Ps(t) is the probability that the last Milestone the system crossed is s. The probability density Qs(t) is for a transition to s exactly at time t. The input for the above equation are Kss′(t) and the initial distribution Ps(0). Manipulations of Eq. 1 (21–23) provide a closed formula in terms of K(τ) and Ps(0) for the mean first passage time:
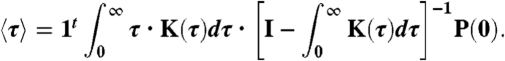 |
[2] |
Reaction Coordinate.
To determine the reaction coordinate (and the Milestones which are hypersurfaces perpendicular to it) we use functional optimization. The following functional of the path is minimized 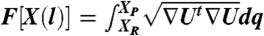 where ∇U is the potential gradient, and dq is a length element along the path
 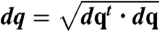 (25).
(25).
Implementation for the Myosin System.
Reaction coordinate.
The two structures, prerecovery stroke XR and the postrecovery XP, were taken from the Protein Data Bank (1VOM (7) and 1MMD (8)). Missing coordinates (including the ATP) were modeled into the structures using Modeller (27), LOOPP (28), and MOIL (29) and the complete coordinate sets were fed to the reaction path algorithm. The numerically computed path has 241 structures including the initial and the final configurations. All the calculations are performed with our general purpose MD code MOIL (29) that includes the functional optimization for the reaction coordinate (25) and Milestoning code (21), and is available from the author. The solvent in the calculation of the reaction coordinate is the continuum approximation Generalized Born Surface Area (GBSA) (30).
Sampling in the Milestones.
Once the structures along the reaction coordinate and the hyper-surfaces orthogonal to it are determined we sample conformations in the Milestones (hyperplanes orthogonal to the reaction coordinate) at room temperature by MD (21). The simulations are carried out for explicitly solvated myosin (30,776 water molecules) in a periodic box of dimensions 90 × 112.48 × 105 Å (3).
Computing terminating trajectories.
The sampled configurations for each of the first 240 Milestones are used to initiate short trajectories between hyperplanes with typical terminating times of only a few picoseconds. The transitions were computed between all Milestones s and their neighbors s ± 1. For the first Milestone we obviously have only forward transitions. More details on the simulations can be found in SI Text.
Supplementary Material
Acknowledgments.
This manuscript was supported in part by an National Institutes of Health Grant GM059796 and National Science Foundation Grant 0833162 (to R.E.).
Footnotes
The authors declare no conflict of interest.
This article is a PNAS Direct Submission.
This article contains supporting information online at www.pnas.org/cgi/content/full/0909636107/DCSupplemental.
References
- 1.Geeves MA, Holms KC. In: The molecular mechanism of muscle contraction. Squire JM, OParry DA, editors. Amsterdam: Elsevier; 2005. pp. 161–193. [DOI] [PubMed] [Google Scholar]
- 2.Lymn RW, Taylor EW. Mechanism of adenosine triphosphate hydrolysis by actomyosin. Biochemistry. 1971;10(25):4617–4624. doi: 10.1021/bi00801a004. [DOI] [PubMed] [Google Scholar]
- 3.Suzuki Y, Yasunaga T, Ohkura R, Wakabayashi T, Sutoh K. Swing of the lever arm of a myosin motor at the isomerization and phosphate-release steps. Nature. 1998;396(6709):380–383. doi: 10.1038/24640. [DOI] [PubMed] [Google Scholar]
- 4.Shih WM, Gryczynski Z, Lakowicz JR, Spudich JA. A FRET-based sensor reveals large ATP hydrolysis-induced conformational changes and three distinct states of the molecular motor myosin. Cell. 2000;102(5):683–694. doi: 10.1016/s0092-8674(00)00090-8. [DOI] [PubMed] [Google Scholar]
- 5.Malnasi-Csizmadia A, et al. Kinetic resolution of a conformational transition and the ATP hydrolysis step using relaxation methods with a Dictyostelium myosin II mutant containing a single tryptophan residue. Biochemistry. 2001;40(42):12727–12737. doi: 10.1021/bi010963q. [DOI] [PubMed] [Google Scholar]
- 6.Gulick AM, Bauer CB, Thoden JB, Rayment I. X-ray structures of the MgADP, MgATP gamma S, and MgAMPPNP complexes of the Dichyostelium discoideum myosin motor domain. Biochemistry. 1997;36(39):11619–11628. doi: 10.1021/bi9712596. [DOI] [PubMed] [Google Scholar]
- 7.Smith CA, Rayment I. X-ray structure of the magnesium(II)center dot ADP center dot vanadate complex of the Dictyostelium discoideum myosin motor domain to 1.9 angstrom resolution. Biochemistry. 1996;35(17):5404–5417. doi: 10.1021/bi952633+. [DOI] [PubMed] [Google Scholar]
- 8.Fisher AJ, et al. X-ray structures of the myosin motor domain of Dictyostelium-discoideum complexed with mgadp-center-dot-befx and mgadp-center-dot-alf4. Biochemistry. 1995;34(28):8960–8972. doi: 10.1021/bi00028a004. [DOI] [PubMed] [Google Scholar]
- 9.Fischer S, Windshugel B, Horak D, Holmes KC, Smith JC. Structural mechanism of the recovery stroke in the myosin molecular motor. Proc Nat Acad USA. 2005;102(19):6873–6878. doi: 10.1073/pnas.0408784102. [DOI] [PMC free article] [PubMed] [Google Scholar]
- 10.Koppole S, Smith JC, Fischer S. Simulations of the myosin II motor reveal a nucleotide-state sensing element that controls the recovery stroke. J Mol Biol. 2006;361(3):604–616. doi: 10.1016/j.jmb.2006.06.022. [DOI] [PubMed] [Google Scholar]
- 11.Schwarzl SM, Smith JC, Fischer S. Insights into the chemomechanical coupling of the myosin motor from simulation of its ATP hydrolysis mechanism. Biochemistry. 2006;45(18):5830–5847. doi: 10.1021/bi052433q. [DOI] [PubMed] [Google Scholar]
- 12.Koppole S, Smith JC, Fischer S. The structural coupling between ATPase activation and recovery stroke in the myosin II motor. Structure. 2007;15(7):825–837. doi: 10.1016/j.str.2007.06.008. [DOI] [PubMed] [Google Scholar]
- 13.Mesentean S, Koppole S, Smith JC, Fischer S. The principal motions involved in the coupling mechanism of the recovery stroke of the myosin motor. J Mol Biol. 2007;367(2):591–602. doi: 10.1016/j.jmb.2006.12.058. [DOI] [PubMed] [Google Scholar]
- 14.Malnasi-Csizmadia A, et al. Selective perturbation of the myosin recovery stroke by point mutations at the base of the lever arm affects ATP hydrolysis and phosphate release. J Biol Chem. 2007;282(24):17658–17664. doi: 10.1074/jbc.M701447200. [DOI] [PubMed] [Google Scholar]
- 15.Yu H, Ma L, Yang Y, Cui Q. Mechanochemical coupling in the myosin motor domain. II. Analysis of critical residues. Plos Comput Biol. 2007;3(2):214–230. doi: 10.1371/journal.pcbi.0030023. [DOI] [PMC free article] [PubMed] [Google Scholar]
- 16.Yu HB, Ma L, Yang Y, Cui Q. Mechanochemical coupling in the myosin motor domain. I. Insights from equilibrium active-site simulations. Plos Comput Biol. 2007;3(2):199–213. doi: 10.1371/journal.pcbi.0030021. [DOI] [PMC free article] [PubMed] [Google Scholar]
- 17.Yang Y, Yu HB, Cui Q. Extensive conformational transitions are required to turn on ATP hydrolysis in myosin. J Mol Biol. 2008;381(5):1407–1420. doi: 10.1016/j.jmb.2008.06.071. [DOI] [PMC free article] [PubMed] [Google Scholar]
- 18.Woo HJ. Exploration of the conformational space of myosin recovery stroke via molecular dynamics. Biophys Chem. 2007;125(1):127–137. doi: 10.1016/j.bpc.2006.07.001. [DOI] [PubMed] [Google Scholar]
- 19.Elber R, Kuczera K, Jas GS. The kinetics of helix unfolding: Molecular dynamics simulations with Milestoning. J Phys Chem. 2009;113:7461–7473. doi: 10.1021/jp900407w. [DOI] [PMC free article] [PubMed] [Google Scholar]
- 20.Elber R. A Milestoning study of the kinetics of an allosteric transition: Atomically detailed simulations of deoxy Scapharca hemoglobin. Biophys J. 2007;92(9):L85–L87. doi: 10.1529/biophysj.106.101899. [DOI] [PMC free article] [PubMed] [Google Scholar]
- 21.West AMA, Elber R, Shalloway D. Extending molecular dynamics time scales with Milestoning: Example of complex kinetics in a solvated peptide. J Chem Phys. 2007;126(14):145104-1–145104-14. doi: 10.1063/1.2716389. [DOI] [PubMed] [Google Scholar]
- 22.Faradjian AK, Elber R. Computing time scales from reaction coordinates by Milestoning. J Chem Phys. 2004;120(23):10880–10889. doi: 10.1063/1.1738640. [DOI] [PubMed] [Google Scholar]
- 23.Shalloway D, Faradjian AK. Efficient computation of the first passage time distribution of the generalized master equation by steady-state relaxation. J Chem Phys. 2006;124(5) doi: 10.1063/1.2161211. [DOI] [PubMed] [Google Scholar]
- 24.Vanden Eijnden E, Venturoli M, Ciccotti G, Elber R. On the assumption underlying Milestoning. J Chem Phys. 2008;129(17):174102-1–174102-13. doi: 10.1063/1.2996509. [DOI] [PMC free article] [PubMed] [Google Scholar]
- 25.Olender R, Elber R. Yet another look at the steepest descent path. J Mol Structure Theochem. 1997;398:63–71. [Google Scholar]
- 26.Czerminski R, Elber R. Self avoiding walk between 2 fixed end points as a tool to calculate reaction paths in large molecular systems. Int J Quantum Chemistry. 1990;38:167–186. [Google Scholar]
- 27.Eswar N, et al. Comparative protein structure modeling with Modeller. Current Protocols in Bioinformatics. 2006;5.6:5.6.1–5.6.30. doi: 10.1002/0471250953.bi0506s15. [DOI] [PMC free article] [PubMed] [Google Scholar]
- 28.Vallat BK, Pillardy J, Elber R. A template-finding algorithm and a comprehensive benchmark for homology modeling of proteins. Proteins. 2008;72(3):910–928. doi: 10.1002/prot.21976. [DOI] [PMC free article] [PubMed] [Google Scholar]
- 29.Elber R, et al. Moil a program for simulations of macrmolecules. Comput Phys Commun. 1995;91(1-3):159–189. [Google Scholar]
- 30.Onufriev A, Bashford D, Case DA. Exploring protein native states and large-scale conformational changes with a modified generalized born model. Proteins. 2004;55(2):383–394. doi: 10.1002/prot.20033. [DOI] [PubMed] [Google Scholar]
- 31.Weinbach Y, Elber R. Revisiting and parallelizing SHAKE. J Comput Phys. 2005;209(1):193–206. [Google Scholar]
- 32.Ryckaert JP, Ciccotti G, Berendsen HJC. Numerical integration of cartesian equations of motion of a system with constraints—molecular dynamics of N-alkanes. J Comput Phys. 1977;23(3):327–341. [Google Scholar]
- 33.Essmann U, et al. A smooth particle mesh ewald method. J Chem Phys. 1995;103(19):8577–8593. [Google Scholar]
- 34.Kabsch W. Discussion of solution for best rotation to relate 2 sets of vectors. Acta Crystallogr A. 1978;34(SEP):827–828. [Google Scholar]
- 35.Wang Q, Canutescu AA, Dunbrack RL. SCWRL and MolIDE: Computer programs for side-chain conformation prediction and homology modeling. Nat Protoc. 2008;3(12):1832–1847. doi: 10.1038/nprot.2008.184. [DOI] [PMC free article] [PubMed] [Google Scholar]
Associated Data
This section collects any data citations, data availability statements, or supplementary materials included in this article.