Abstract
The farnesoid X receptor (FXR) is a bile acid activated nuclear receptor. Zucker (fa/fa) rats, harboring a loss of function mutation of the leptin receptor, develop diabetes, insulin resistance, obesity, and liver steatosis. In this study, we investigated the effect of FXR activation by 6-ethyl-chenodeoxycholic acid, (6E-CDCA, 10 mg/kg) on insulin resistance and liver and muscle lipid metabolism in fa/fa rats and compared its activity with rosiglitazone (10 mg/kg) alone or in combination with 6E-CDCA (5 mg/kg each). In comparison to lean (fa/+), fa/fa rats on a normal diet developed insulin resistance and liver steatosis. FXR activation protected against body weight gain and liver and muscle fat deposition and reversed insulin resistance as assessed by insulin responsive substrate-1 phosphorylation on serine 312 in liver and muscles. Activation of FXR reduced liver expression of genes involved in fatty acid synthesis, lipogenesis, and gluconeogenesis. In the muscles, FXR treatment reduced free fatty acid synthesis. Rosiglitazone reduced blood insulin, glucose, triglyceride, free fatty acid, and cholesterol plasma levels but promoted body weight gain (20%) and liver fat deposition. FXR activation reduced high density lipoprotein plasma levels. In summary, FXR administration reversed insulin resistance and correct lipid metabolism abnormalities in an obesity animal model.
Nonalcoholic fatty liver disease (NAFLD) covers a spectrum of hepatic abnormalities ranging from fatty liver (steatosis) to fatty liver inflammation and damage to hepatocytes (nonalcoholic steatohepatitis, NASH). NASH is a leading cause of cirrhosis and liver cancer. NAFLD is associated with insulin resistance and metabolic syndrome [obesity, combined hyperlipidemia, diabetes mellitus (type 2) and high blood pressure] (1, 2) The prevalence of NAFLD has been estimated to be 17–33% in some countries; NASH may be present in 1/3 of such cases, and 20–25% of NASH patients could progress onto cirrhosis (2). The exact cause of NAFLD is still unknown; however, both obesity and insulin resistance play a strong role in the disease process (3–6). Excess caloric intake in obese subjects and reduced physical activity leads to metabolic overload, increased triglyceride input, and adipocyte enlargement. This hypertophy of adipocytes induces a macrophage recruitment, which results in a pro-inflammatory state [increased production of tumor necrosis factor-(TNF) α)] that increases lipolysis and the levels of circulating FFAs (3–6). The excess of circulating FFAs exerts a number of deleterious effects on mitochondrial function and insulin signaling through activation of protein kinase C (PKC), IκB kinase (IKK β), and c-Jun N-terminal protein kinase (JNK). These serine/threonine (Ser/Thr) kinases phosphorylate various Ser residues on the insulin responsive substrate (IRS) proteins, inhibiting insulin receptor tyrosine kinase activity, a key molecular mechanism of insulin resistance (7, 8).
Farnesoid X receptor (FXR) is a member of the nuclear receptor superfamily of ligand activated receptors expressed in the liver, kidney, intestine, and adrenals. FXR functions as a bile acid sensor and regulates bile acid homeostasis by decreasing their endogenous production and by accelerating bile acid biotransformation and excretion (9). Because bile acids represent the end-product of cholesterol metabolism, FXR has also a role in regulating lipid and cholesterol homeostasis. FXR activation induces the expression of genes involved in lipoprotein metabolism/clearance and represses the activity of genes involved in the synthesis of triglycerides. The main mechanism of inhibition of triglyceride biosynthesis by FXR ligands is the inhibition of the expression of transcription factor sterol-regulatory element binding protein-1c (SREBP-1c) and its lipogenic target genes including FAS (9, 10). In addition, activation of FXR increases β-oxidation and decreases lipogenesis by downregulating the production of TNF-α by adipocytes and the levels of circulating FFAs (9–11). In addition to its role on lipid metabolism, FXR plays a role in glucose homeostasis (9, 10, 12, 13). Thus, FXR-deficient mice develop insulin resistance and administration of FXR ligands to wild-type mice lowers blood glucose levels as a result of enhanced phosphorylation of IRS-1 in tyrosine residues in the liver and peripheral tissues including muscle and adipose tissue (12, 13). Further, the activation of FXR represses hepatic gluconeogenesis (12), interferes with glycolysis via inhibition of LPK (pyruvate kinase type L) expression, stimulates glycogen storage, and inhibits de novo lipogenesis (12, 13). Finally, FXR induces glucose transporter 4 (GLUT-4) expression through the direct activation of an FXR response element (FXRE) in the GLUT-4 promoter (14).
Zucker (fa/fa) rats, harboring a loss-of-function mutation of the leptin receptor, exhibit hyperphagia and hyperleptinaemia and develop obesity and insulin resistance (15). Because obesity, type 2 diabetes, and liver steatosis are distinctive features of NAFLD, Zucker (fa/fa) rats can be considered a model for NAFLD (1, 15, 16). Agents that target insulin sensitivity have been used for treatment of metabolic disorder. Thus, antidiabetic drugs, metformin and peroxisome proliferator–activated receptor-γ (PPARγ) ligands, rosiglitazone and pioglitazone, have shown to be beneficial in the treatment of NAFLD/NASH patients (17). The use of PPARγ ligands thiazolidinediones, however, increases visceral fat deposition and carries a potential risk for cardiovascular events, making the quest for NAFLD/NASH treatment an active field of clinical investigation with many different approaches being currently under evaluation (17–19).
In the present study, we have investigated whether activation of FXR by a synthetic FXR ligand reverses insulin resistance and protects against liver steatosis development and insulin resistance in obese fa/fa rats and compared the effect of this agent with that of rosiglitazone.
MATERIALS AND METHODS
Animal protocol
Lean (fa/+) and obese male (fa/fa) Zucker rats were from Charles River. Rats were housed on a 12 h light-dark cycle and fed standard laboratory diet ad libitum. The experimental protocol was approved by the Animal Study Committee of the University of Perugia. Drug administration was started at 15 weeks of age. Fa/fa rats were randomly allocated into four groups (12 animals per group) and administered with vehicle (methyl cellulose 1%), 6α-ethyl-chenodeoxycholic acid (6E-CDCA) an FXR ligand (10 mg/kg), rosiglitazone (10 mg/kg) or a combination of 6E-CDCA and rosiglitazone (5 mg/kg each) (20). Treatments were administered by oral gavage once daily for 7 weeks. Consumed food and body weight were measured once a week. At the day of euthanasia, rats were anesthetized with 50 mg/kg sodium pentothal. Blood was collected in heparinized tubes and then centrifuged and plasma was stored at −80°C. Skeletal muscle (gastrocnemius), liver, adipose tissue (epididymal fat), pancreas, heart, and terminal ileus were removed from each rat. All tissues were frozen in liquid nitrogen and stored at −80°C or fixed in formalin or included in OCT. Tissue sections (7 μm thick) were then stained with hematoxylin and eosin (H&E) and red oil.
Biochemical analysis
Different kits were used, following manufacturer instructions, to determine concentrations of various metabolites in plasma: insulin (Mercodia Rat insulin ELISA, Uppsala, Sweden), adiponectin (ELISA kit, Linco Research, Charles, MO). Glucose, aspartate aminotransferase (AST), alanine aminotransferase (ALT), γ glutamyl tranferase (γGT), total cholesterol, LDL, and HDL triglyceride levels were determined using specific kits (Alfa-Wasserman, Bologna, Italy). FFA level was determined using a Wako kit. IRS-1 phosphorylation on Ser(312) and serine threonine protein kinase (AKT) phosphorylation on Ser(473) were assessed in liver, muscle, and adipose (not shown) samples using a validated IRS-1 p-S312, Elisa kit, total IRS-1 Elisa kit, total Akt Elisa kit, Akt p-S473 Elisa kit from BIOSOURCE (Invitrogen, Milan, Italy).
Liver histology
For histological examination, portions of the right and left liver lobes from each animal were fixed in 10% formaline, embedded in paraffin, and a section of 7 microns thickness stained with H&E, Oil Red O, and sirius red, and histological and morphometric analysis were performed. The liver histology was scored using a modification of the system developed by Brunt et al. (21). Briefly, the degree of steatosis, hepatocyte ballooning, lobular inflammation, and portal inflammation was scored separately in a blinded way. Each variable was graded from zero through three. The sum of the scores (degree of steatosis, hepatocyte ballooning, lobular inflammation, and portal inflammation) was considered as the total pathology grade. Fibrosis was staged from zero through three (see supplementary Table I and supplementary Fig. I).
Tissue triglyceride, cholesterol, FFAs, and glycogen
For determination of total triglyceride, cholesterol, and FFA (N = 6–4) content fragments of ∼100 mg of liver or gastrocnemius were homogenized with 1 ml of T-PER (Pirce). The homogenates were used for protein concentration analysis (Bradford assay, Bio-rad, Milan, Italy), and 100 µl of tissue extracts added to 1.6 ml CHCl3:methanol (2:1) for 16 h at 4°C, after which 200 µL of 0.6% NaCl was added and the solution centrifuged at 2,000 g for 20 min. The organic layer was removed and dried by Speed Vac System (HETO-Holten, Waltham, MA). The resulting pellet was dissolved in 100 µL phosphate buffered saline containing 1% Triton X-100 and triglyceride, cholesterol, and FFA content was measured by specific enzymatic reagents.
qRT-PCR
Quantization of the liver expression of selected genes was made by real-time PCR (quantitative RT-PCR) as described previously (22). The expression of each gene was measured in at least six rats per group. All PCR primers (supplementary Table II) were designed with the PRIMER3-OUTPUT software using published sequence data obtained from the National Center for Biotechnology Information database. Relative efficiency of the primer used for qRT-PCR was calculated through the determination of standard curves for every gene. Standard curves were performed using standard concentrations of cDNA template and estimating the unit of relative fluorescence. Optimization experiments were performed to obtain a primers efficiency value of 100% for every gene.
OGTT and ITT
The oral glucose tolerance test (OGTT) and the insulin tolerance test (ITT) were performed after overnight fasting after the second week of treatment (not shown) and at the end of treatments. For OGTT, rats were given 2 g/kg glucose by oral gavage. For the IGTT, rats were injected ip with 0.5 U/kg bovine insulin (Sigma, St. Louis, MO). Blood samples were collected 0, 20, 40, 60, 100, and 120 min after oral glucose or ip insulin via the tail vein.
Statistical analysis
All data are expressed as mean ± SE. Treatments were compared by one-way ANOVA followed by the Tukey test. An associated probability (P value) of < 0.05% was considered significant.
RESULTS
Body weight
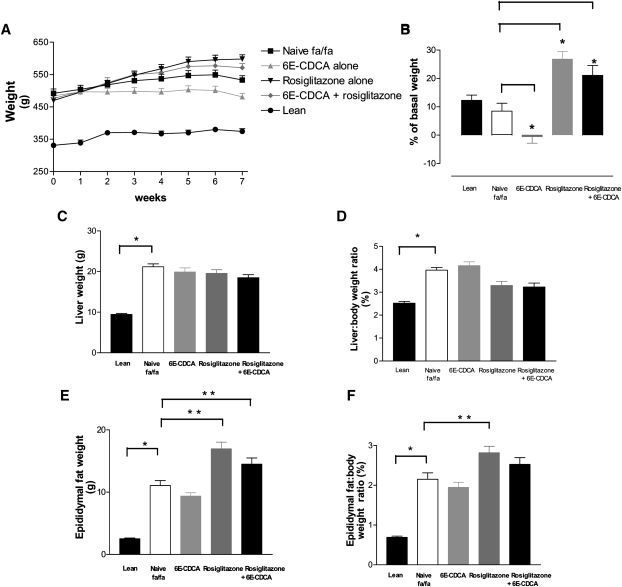
At the age of 15 weeks, obese fa/fa Zucker rats were heavier than lean control (Fa/+) having a mean body weight of 492 ± 13.4 g significantly higher than that of naive lean Fa(/+) rats, 331 ± 7.0 g (n = 12; P < 0.01) (Fig. 1A). During the treatment period, naïve fa/fa and lean Fa(/+) gained ∼10% of body weight, reaching a final body weight of 533 ± 13.7 and 374 ± 8.6 g (P < 0.01) (Fig. 1B). As shown in Fig. 1A and B, 7 week treatment with 6E-CDCA attenuated body weight gain and all treated animals in this group maintained the original body weight (initial body weight, 484.0 ± 10.0; final body weight 481.0 ± 11.0 g). In contrast, fa/fa rats administered rosiglitazone or rosiglitazone in combination with 6E-CDCA gained ∼20% of body weight (Figure 1B) and showed a higher body weight in comparison with naïve fa/fa rats (the final body weight in the rosiglitazone group was 598.0 ± 13.0 g whereas in the combination group it was 571.0 ± 13.0 g) [n = 12; P < 0.05 vs. baseline (starting body weight at week 0)]. The food intake (g/day) was not statistically different in all treated groups. At the end of treatment, the ratio of liver to body weight as well as the epidydimal fat weight and the ratio of epidydimal fat to body weight were significantly higher in the naïve fa/fa than naïve lean Fa(/+) rats (Fig. 1C–F). None of the treatments had any effect on liver weight but rosiglitazione, either alone or in combination with 6E-CDCA, effectively reduced the ratio of liver to body weight (data not significant) (Fig. 1C, D). In addition, rosiglitazone either alone or in combination with 6E-CDCA effectively increased the epidydimal fat ratio (Fig. 1F) in comparison to naïve Zucker fa/fa rats (n = 12; P < 0.05).
Fig. 1.
Effect of administration of obese fa/fa rats with nuclear receptor ligands on body weight and liver and fat weight. Zucker obese fa/fa rats were administered daily with 6E-CDCA (10 mg/kg) and rosiglitazone (10 mg/kg) alone or in combination (5 mg/kg each) for 7 weeks starting at the age of 15 weeks. Data are mean ± SE of 12 rats. * P < 0.05 naïve fa/fa versus lean. ** P < 0.05 treated versus naïve fa/fa.
Fig. 7.
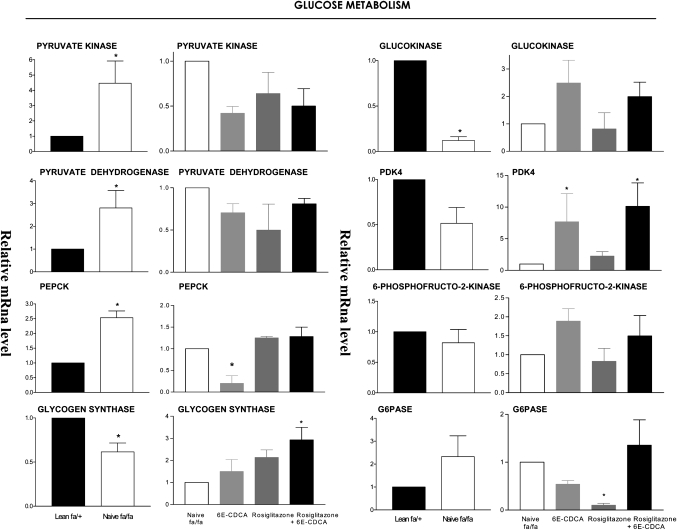
Effect of administration of obese fa/fa rats with nuclear receptor ligands on liver expression of genes involved in glucose homeostasis. The relative expression (q-RT-PCR) of each gene was obtained by comparing lean and fa/fa rats. RNA samples were from six animals per group and loaded in triplicates. * P < 0.01 naive fa/fa versus lean or treatment versus naïve fa/fa.
Plasma biochemistry
Results of plasma biochemistry analyses are shown in Table 1. At the age of 22 weeks, naïve fa/fa rats were overtly diabetic and hyper-insulinemic (n = 12; P < 0.01). In addition, fa/fa rats had higher plasma levels of triglyceride, FFA, cholesterol, and LDL and lower levels of HDL than naïve lean rats (Table 1). Moderate elevation of serum transaminases is the most common and often the only laboratory abnormality found in patients with NAFLD and NASH (1, 2). ALT and AST levels were 2-fold higher in naïve fa/fa rats than in lean rats fed the control diet (Table 1). Administering fa/fa rats for 7 weeks with an FXR ligand effectively reduced plasma glucose levels (n = 12; P < 0.05), FFA, and HDL (n = 12; P < 0.05) without changing cholesterol plasma levels (Table 1). Rosiglitazone administration effectively reduced insulin and glucose plasma levels as well as triglyceride, FFA, and cholesterol but not LDL and HDL (Table 1; n = 12; P < 0.05). A similar pattern of effects was observed in response to rosiglitazone in combination with 6E-CDCA.
TABLE 1.
Biochemical plasma parameters after 7 weeks treatment
| Rats | Lean (fa/+) | fa/fa |
|||
|---|---|---|---|---|---|
| Treatment | Naive | Naive | 6E-CDCA | Rosiglitazone | Rosiglitazone + 6E-CDCA |
| Insulin (ng/L) | 1,019.0 ± 83.0 | 3,292.0 ± 909.0# | 1,704.0 ± 360.0 | 881.0 ± 43.0** | 1,282.0 ± 268.0 |
| Glucose (mg/dl) | 116.0 ± 6.0 | 174.8 ± 7.0# | 127.2 ± 9.0* | 128.2 ± 8.0* | 129.8 ± 5.0* |
| Triglyceride (mg/dl) | 23.6 ± 4.0 | 407.0 ± 56.0# | 236.0 ± 48.0 | 206.0 ± 42.0** | 158.0 ± 24.0* |
| FFA (ng/dl) | 0.6 ± 0.1 | 1.3 ± 0.1# | 1.0 ± 0.1* | 0.9 ± 0,1* | 0.9 ± 0.1* |
| Cholesterol (mg/dl) | 69.9 ± 5.0 | 191.7 ± 12.5# | 152.0 ± 11.2 | 143.3 ± 7.6* | 173.0 ± 14.2 |
| LDL (mg/dl) | 39.2 ± 4.2 | 74.0 ± 11.0 | 80.9 ± 10.7 | 68.7 ± 5.3 | 100.0 ± 15.7 |
| HDL (mg/dl) | 21.6 ± 1.6 | 45.0 ± 1.8# | 35.0 ± 2.34* | 41.0 ± 1.9 | 40.7 ± 1.5 |
| ALT (units/L) | 43.1 ± 1.9 | 109.0 ± 11.9 | 78.5 ± 8.1 | 140.3 ± 33.6 | 84.0 ± 8.2 |
| AST (units/L) | 89.9 ± 2.0 | 182.0 ± 30.0 | 93.9 ± 10.0 | 172.0 ± 45.0 | 112.0 ± 11.0 |
| γGT (units/L) | 6.2 ± 0.5 | 6.6 ± 0.9 | 4,5 ± 0.3 | 5.6 ± 0.5 | 5.3 ± 0.4 |
| Adiponectin (ng/ml) | 6.6 ± 0.4 | 9.0 ± 0.9 | 7.0 ± 0.3 | 11.4 ± 0.5 | 12.4 ± 0.4* |
Data are mean ± SE (n = 12).
# P < 0.05, fa/fa versus lean.
*P < 0.05, treatment versus naive fa/fa.
** P < 0.01, treatment versus naive fa/fa.
Liver biochemistry
In comparison with lean rats, naïve fa/fa rats had significantly higher liver content of triglyceride, FFA, cholesterol, and glycogen. Administering fa/fa rats with the FXR ligand (Table 2) effectively decreased triglyceride, FFA, cholesterol, and glycogen content (n = 12; P < 0.05). Rosiglitazone administration reduced liver FFA and glycogen content but increased the liver triglyceride content (n = 12; P < 0.05). The combined administration of PPARγ and FXR ligands effectively reduced liver content of FFA, cholesterol, and glycogen (n = 12; P < 0.05), while causing a slight but significant increase in triglyceride content (n = 12; P < 0.05).
TABLE 2.
Biochemical tissues parameters after 7 weeks treatment
| Rats | Lean (fa/+) | fa/fa |
|||
|---|---|---|---|---|---|
| Treatment | Naive | Naive | 6E-CDCA | Rosiglitazone | Rosiglitazone +6E-CDCA |
| Liver FFA (nmol/mg protein) | 739.8 ± 98.7 | 1,124.0 ± 192.5# | 430.0 ± 42.2* | 907.0 ± 274.0* | 810.0 ± 125.0* |
| Liver cholesterol (µg/mg) | 0.7 ± 0.1 | 1.7 ± 0.2# | 0.3 ± 0.1* | 1.5 ± 0.1 | 1.1 ± 0,1* |
| Liver glycogen (µg/mg protein) | 148.1 ± 16.0 | 6,054.0 ± 1362.0# | 342.8 ± 55.0* | 2217.0 ± 574.0* | 1,376.0 ± 368.0* |
| Muscle triglyceride (µg/mg protein) | 1.8 ± 0.7 | 8.5 ± 0.9# | 2.7 ± 0.5* | 7.5 ± 1.5 | 4.8 ± 1.9 |
| Muscle FFA (nmol/mg protein) | 151.8 ± 26.6 | 608.0 ± 66.8# | 204.0 ± 40.9* | 349.0 ± 105.0 | 282.0 ± 31.7* |
| Muscle cholesterol (µg/mg protein) | 0.4 ± 0.1 | 2.1 ± 0.1# | 0.2 ± 0.1* | 1.3 ± 0.3* | 1.3 ± 0.5* |
Data are mean ± SE (n = 12).
# P < 0.05, fa/fa versus lean.
*P < 0.05, treatment versus naive fa/fa.
Liver histology
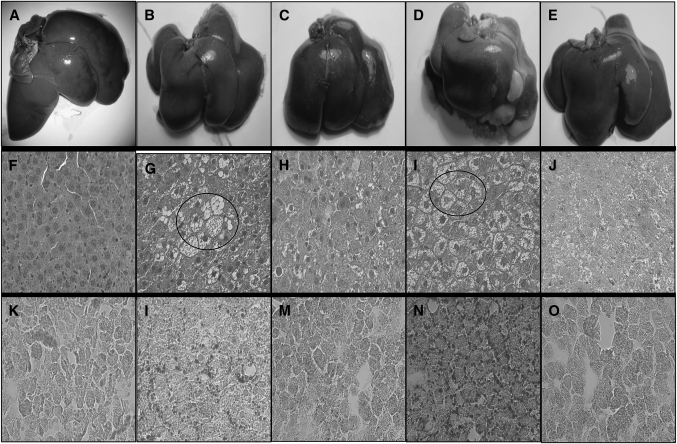
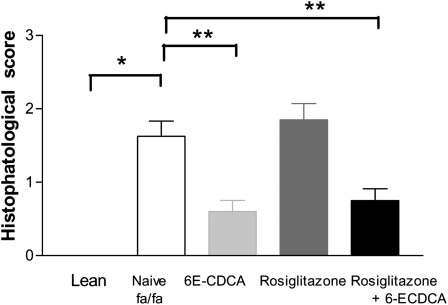
Histopathologic analysis of H&E stained liver sections revealed a severe macrovescicular steatosis and hepatocyte ballooning with minor or absent portal and lobular inflammation. An example of the liver appearance is shown in Fig. 2. Morphometric analysis using a previously validated score (21) to demonstrate that administering fa/fa rats with 6E-CDCA alone or in combination with rosiglitazone effectively reduced the severity of the liver steatosis and ballooning scores whereas rosiglitazone worsened both (Fig. 2F–J, Fig. 3). The morphometric analysis of liver sections stained with Oil Red O, a measure of liver triglyceride content, confirmed this pattern. As shown in Fig. 2K–O, fa/fa rats had a higher liver content of neutral lipids compared with lean animals. 6E-CDCA reduced liver triglyceride content whereas rosiglitazone did the opposite. A pathology score constructed by summing individual scores for liver steatosis, hepatocyte ballooning, and lobular and portal inflammation demonstrate that fa/fa rats had significant obesity-induced liver pathology and that these alterations were attenuated by 6E-CDCA alone or in combination with rosiglitazone whereas the PPARγ ligand alone did the opposite (Fig. 3). A minimal to mild liver fibrosis was detected in obese fa/fa rats at the sirius red staining. The fibrosis stage was slightly attenuated by all treatments (N = 6; P < 0.05) (data not shown).
Fig. 2.
Effect of administration of obese fa/fa rats with nuclear receptor ligands on liver fat. Zucker obese fa/fa rats were administered daily with 6E-CDCA (10 mg/kg) and rosiglitazone (10 mg/kg) alone or in combination (5 mg/kg each) for 7 weeks starting at the age of 15 weeks. Figure shown is representative of one animal per group. A–E: Macroscopic appearance of the liver. F–J: H&E staining, magnification 40×. K–O: Oil Red O, magnification 40×. Lean rats (A, F, K); fa/fa rats (B, G, L); fa/fa rats administered with 6E-CDCA (C, H, M); fa/fa rats administered with rosiglitazone (D, I, N); fa/fa rats administered with 6E-CDCA in combination with rosiglitazone (E, J, O). Livers from fa/fa rats have higher fat content than lean rats. In G and I, arrows indicate ballooning. This pattern was ameliorated by treatment with 6E-CDCA.
Fig. 3.
Effect of administration of obese fa/fa rats with nuclear receptor ligands on the liver histopathology. The hustophatology score was calculated according to the scoring system shown in supplementary Table I. Data are mean ± SE. * P < 0.001 naive fa/fa versus lean; ** P < 0.01 treatment versus naive fa/fa.
Liver expression of lipogenesis-and gluconeogenesis-related genes
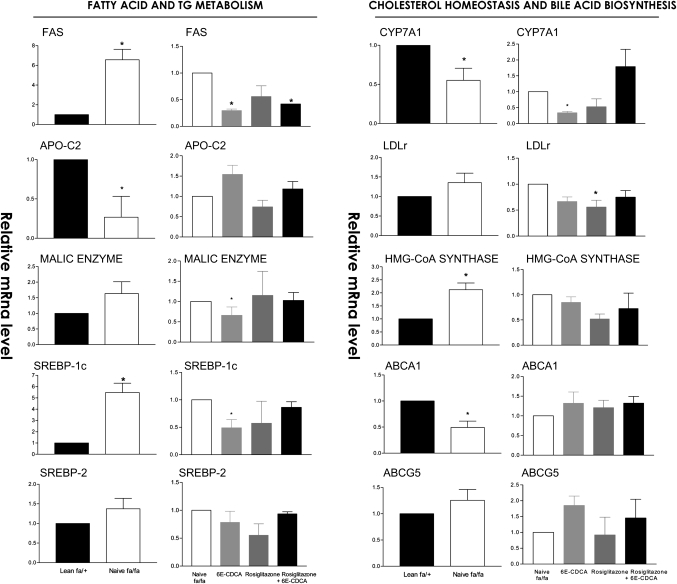
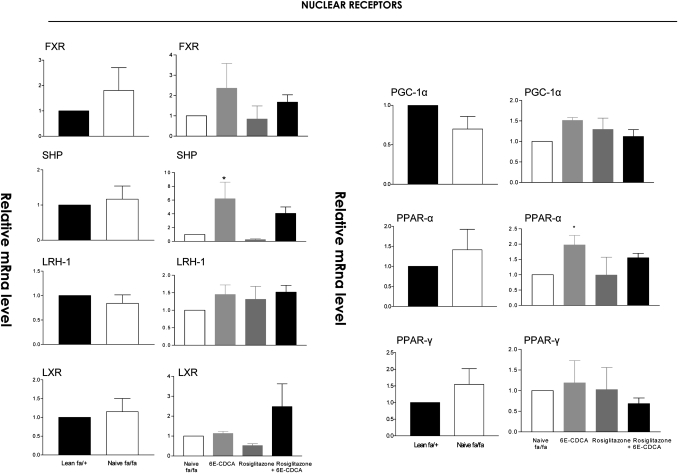
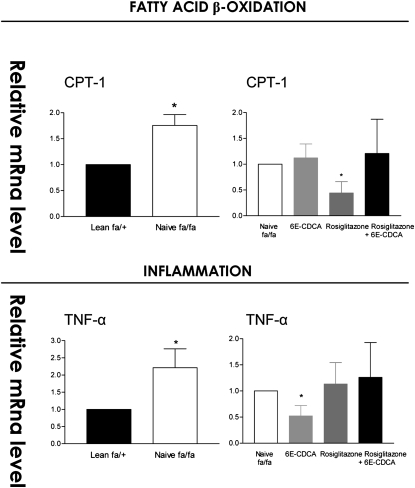
In comparison with naïve lean rats, obese fa/fa rats had major alterations in the liver expression of genes involved in lipid, cholesterol, and glucose homeostasis. Thus, a 2-fold increase in malic enzyme and HMG-CoA synthase and an ∼3- to 6-fold increase in the expression of FAS and SREPB1c was detected in the liver of fa/fa rats. In addition, a 50% reduction in the expression of apolipoprotein (apo)-C2, cholesterol 7α-hydroxylase (CYP7A1), a gene involved in the conversion of cholesterol into bile acids, and ABCA1, a gene that regulates cholesterol efflux from hepatocytes, was detected in fa/fa rats (Fig. 4). No changes in the liver expression of several nuclear receptors between lean and fa/fa were detected (Fig. 5). Expression of carnitine palmitoyl transferase 1 (CPT-1), a gene involved in the β-oxidation of fatty acids, was also increased by 2-fold in fa/fa rats (Fig. 6). Reflecting their condition of insulin resistance, fa/fa rats had a significant increase in the expression of pyruvate dehydrogenase and pyruvate kinase, two genes involved in glycolysis and fatty acid synthesis, and phosphoenolpyruvate carboxykinase (PEPCK), a key regulatory gene in the gluconeogenetic pathway. In contrast, the expression of glucokinase was significantly reduced (Fig. 7).
Fig. 4.
Effect of administration of obese fa/fa rats with nuclear receptor ligands on liver expression of genes involved in fatty acid and triglyceride (TG) metabolism, cholesterol homeostasis, and bile acid synthesis. The relative expression (q-RT-PCR) of each gene was obtained by comparing lean and fa/fa rats. RNA samples were from six animals per group and loaded in triplicates. * P < 0.01 naive fa/fa versus lean or treatment versus naïve fa/fa.
Fig. 5.
Effect of administration of obese fa/fa rats with nuclear receptor ligands on liver expression of genes involved in fatty acid β-oxidation and TNF-α. The relative expression (q-RT-PCR) of each gene was obtained by comparing lean and fa/fa rats. RNA samples were from six animals per group and loaded in triplicates. * P < 0.01 naive fa/fa versus lean or treatment versus naïve fa/fa.
Fig. 6.
Effect of administration of obese fa/fa rats with nuclear receptor ligands on liver expression of nuclear receptors. The relative expression (q-RT-PCR) of each gene was obtained by comparing lean and fa/fa rats. RNA samples were from six animals per group and loaded in triplicates. * P < 0.01 naive fa/fa versus lean or treatment versus naïve fa/fa.
FXR activation in fa/fa rats increased the expression of the FXR-target gene small heterodimer partner (SHP), an atypical nuclear receptor that has been shown to mediate several metabolic effects of FXR (Fig. 5) (P < 0.05 vs. fa/fa) and reduced the expression of SREPB-1c, FAS, malic enzyme, and pyruvate kinase downregulating fatty acid synthesis (Fig. 4 and 6). It also inhibited the expression of the neoglucogenetic enzyme, PEPCK (Fig. 7). The expression of HMG-CoA synthase (Figs. 4, 7) and that of HMG-CoA reductase (data not shown) was unchanged after treatment with 6E-CDCA. Treatment with 6E-CDCA induced an upregulation of apo-C2 (Fig. 4). Rosiglitazone administration had no effect on enzymes involved in fatty acid and triglyceride metabolism as well as cholesterol homeostasis, with the remarkable reduction of LDL receptor (LDL-r)(Fig. 4). However, it reduced liver CPT1 and G6Pase (Figs. 6, 7). The combination of the FXR and PPARγ ligands gives an intermediate phenotype.
Muscle biochemistry and gene expression
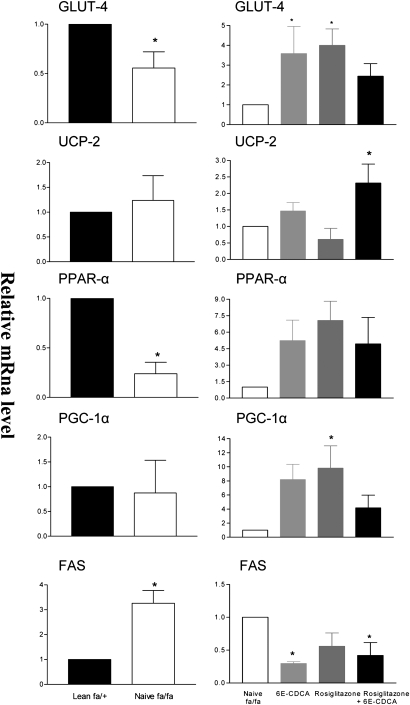
Muscle triglycerides, FFAs, and cholesterol contents were significantly higher in muscles of obese fa/fa rats (Table 2). Consistent with these findings, FAS expression was increased 3-fold in the muscle of fa/fa rats in comparison with lean rats. In contrast, a decrease in PPARα and GLUT-4 was observed (Fig. 8). Treating fa/fa rats with 6E-CDCA resulted in a marked reduction of muscle triglyceride, FFA, and cholesterol content and associated with a significant reduction in the expression of FAS mRNA and induction of GLUT4, PPARα, and PGC-1α (Fig. 8). A similar pattern of effects was observed in rats administered rosiglitazone alone or in combination with 6E-CDCA, though the PPARγ ligand alone failed to reduce muscle triglyceride content (Table 2 and Fig. 8).
Fig. 8.
Effect of administration of obese fa/fa rats with nuclear receptor ligands on expression of key regulatory genes in the muscle. The relative expression (q-RT-PCR) of each gene was obtained by comparing lean and fa/fa rats. RNA samples were from six animals per group and loaded in triplicates. * P < 0.01 naive fa/fa versus lean or treatment versus naïve fa/fa.
Insulin signaling: OGTT and ITT
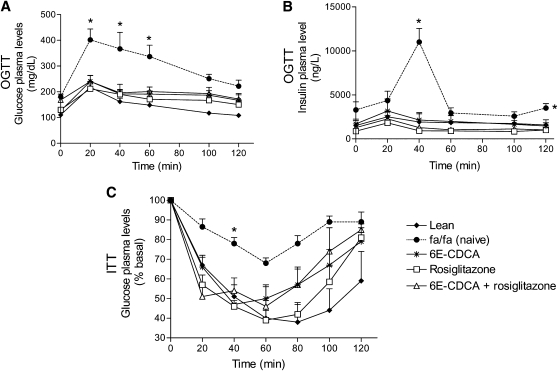
The OGTT was performed 3 (data not shown) and 7 weeks after drug treatment. At the age of 22 weeks, fa/fa rats had a significant higher basal insulin and glucose plasma levels than lean rats (Table 1). Glucose load in fa/fa rats resulted in a sustained increase in plasma glucose levels, indicating that these rats were insulin-resistant (Fig. 9A). In addition, after the insulin injection the level of plasma glucose remained high at all time points in the fa/fa group (Fig. 9C). In lean rats, blood glucose dropped sharply from 0 to 60 min. After this time point, it rose slowly toward the baseline in the following 60 min. Blood glucose levels dropped to ∼40% of basal values at 40 min (a measure of insulin sensitivity). Obese fa/fa rats were overtly insulin resistant and glucose plasma levels in response to the ITT never dropped below 70% of basal values and returned rapidly to the baseline (Fig. 9C) (P < 0,05; n = 12).
Fig. 9.
FXR and PPARγ ligands revert insulin resistance in obese fa/fa rats: effect on OGTT and ITT. Zucker obese fa/fa rats were administered daily with 6E-CDCA (10 mg/kg) and rosiglitazone (10 mg/kg) alone or in combination (5 mg/kg each) for 7 weeks starting at the age of 15 weeks. The OGTT and ITT were performed after 7 weeks treatment. Data are mean ± SE of 12 rats. * P < 0.05 naïve fa/fa versus lean and treated fa/fa rats.
Administering obese fa/fa rats with 6E-CDCA and rosiglitazone alone or in combination not only normalized glucose and insulin plasma levels but restored insulin sensitivity as measured by the ITT (Fig. 9A–C). Similar results were obtained after 3 weeks of treatment (data not shown).
Insulin signaling: IRS and AKT phosphorylation in liver and muscles
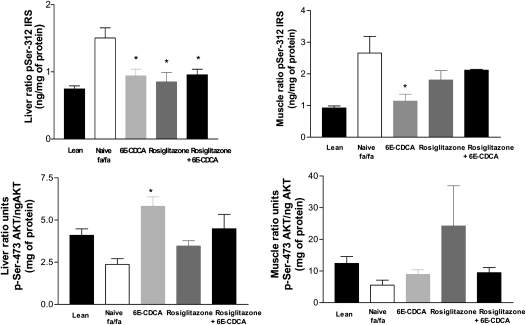
The classic insulin signaling cascade was severely hampered in liver, muscle, and adipose tissue (not shown) of obese Zucker rats (fa/fa) compared with lean rats (Fig. 10). Thus, IRS phosphorylation in Ser(312), an inhibitory phosphorylation, was markedly increased in the liver and muscles of fa/fa rats in comparison to lean rats (n = 12; P < 0.05). In contrast, phosphorylation of AKT in Ser(473), an activatory phosphorylation, was reduced in the liver and muscles of fa/fa rats. Treating fa/fa rats with 6E-CDCA and rosiglitazone and their combination restored liver insulin sensitivity and reduced of IRS phosphorylation on Ser(312). A similar pattern was observed in the muscle (Fig. 10). Finally, FXR activation increased AKT phosphorylation in Ser(437) in the liver (Fig. 10).
Fig. 10.
FXR and PPARγ ligands revert insulin resistance in obese fa/fa rats: effect on IRS Ser(312) and AKT Ser(473) phosphorylation in liver and muscle tissues. * P < 0.05 treated versus naïve fa/fa rats.
DISCUSSION
In this study, we provide compelling evidence that FXR activation by a steroid agonist reverses biochemical and hormonal dysfunction in a rodent model of NAFLD. Obese Zucker fa/fa rats develop a hyperphagia-driven obesity as a consequence of spontaneous mutation in the leptin receptor (15, 16). Impaired leptin signaling leads to hyperinsulinemia, hyper-glycemia, hyper-triglyceridemia, hyper-cholesterolemia, insulin resistance, and liver fat accumulation and increased aminotrasnferases plasma levels. Results from a detailed biochemical characterization and analysis of expression of genes involved in lipid, cholesterol, and glucose homeostasis in the liver and muscle provide robust support to the notion that this genetic model shares major biochemical features with human NAFLD (1–6). Thus, obese fa/fa rats had an increased expression of genes involved in gluconeogenesis (PEPCK) and fatty acid (SREPB-1C and FAS) and cholesterol (HMG-CoA synthase) synthesis and impaired cholesterol efflux from hepatocytes (ABCA1 and Apo-C2) leading to accumulation of triglyceride and cholesterol in the liver.
Several results support the notion that the mechanism of insulin resistance seen in obese fa/fa rats share similarities with insulin resistance seen in patients with NAFLD/NASH. In those patients, either increased expression of pro-inflammatory mediators such as TNFα and accumulation of biologically active fatty acid metabolites in liver and muscle cells activate Ser/Thr kinases leading to IRS-1 serine-phosphorylation and subsequent impaired IRS-1 thyrosine phosphorylation and reduced PI3K activity upon insulin stimulation (23–25). Similarly, insulin resistance in liver and muscles of fa/fa rats associates with a robust induction of IRS-1 phosphorylation in Ser(312) as well as a decreased phosphorylation of AKT at Ser(473), a phosphorylation site that is required for downstream propagation of insulin signaling (26). These biochemical and molecular alterations had pathological readouts; fa/fa rats develop liver steatosis and hepatocytes ballooning that share the same lobular distribution of NAFLD patients. In aggregate, the obesity-driven liver injury in fa/fa rats reproduce several major molecular, biochemical, and histologic features of NAFLD and represent a relevant model to test pharmacological interventions (16). However, fa/fa rats fail to develop a robust fibrotic response and inflammation even in the presence of severe steatosis; for this reason, they cannot be considered a model of NASH. Because fa/fa rats lack a functional leptin receptor and leptin in an essential part of the hormonal network that regulates collagen deposition by hepatic stellate cells and myofibroblasts, the later represents an intrinsic limitation of the model (27).
Members of the nuclear receptor superfamily function as intracellular ligand-activated transcription factors in a diverse range of cellular processes (9, 10). A subset of nuclear receptors that heterodimerize with the retinoid X receptor α are low-affinity receptors for important metabolic intermediates and regulators of metabolic and adaptive/defensive processes, particularly in the liver (28). To date, the significance of metabolic nuclear receptor in the development of hepatic steatosis, inflammation, and fibrosis in NAFLD has not been extensively characterized (17), but clinical studies have highlighted a beneficial role for thiazolidinediones, a class of synthetic PPARγ ligands (17). The thiazolidinediones, rosiglitazone and pioglitazone, act as insulin sensitizers and are used in the treatment of patients with type 2 diabetes and NASH (18). We found that rosiglitazone administration to obese fa/fa rats exerted a number of beneficial effects and was highly effective in counteracting insulin resistance as demonstrated by normalization of the OGTT and the ITT. Further, rosiglitazone reduced Ser(312) phosphorylation of IRS-1 to the level seen in lean rats and ameliorates plasma triglyceride, FFA, cholesterol, insulin, and glucose levels. However, rosiglitazone caused abdominal fat accumulation (as measured by epidydimal weight, Fig. 1E) and increased rat body weight by ∼20% in comparison to naïve fa/fa. Rosiglitazone failed to ameliorates serum markers of liver injury (AST and ALT) and worsened liver histopathology, increasing liver triglyceride content (Table 2). These findings were consistent with those reported in another genetic model of liver steatosis developing in leptin-deficient ob/ob mice. Because both the ob/ob mice and fa/fa rats are characterized by deficiency in leptin signaling, it might be speculated that failure to ameliorate liver histopathology by rosiglitazone could be limited to models that build up on an altered leptin signaling. A similar weight gain was seen in NASH patients administered pioglitazone (29, 30) or rosiglitazone. Thus, it is widely accepted that the insulin sensitizing activity of glitazones on adipocytes is responsible for abdominal fat deposition caused by these agents (31).
FXR is a bile acid sensor that regulates bile acid synthesis, and in association with CAR and PXR, bile acid detoxification and excretion (8, 9). In the present study, we have provided evidence that FXR activation with 6E-CDCA, a semi-synthetic FXR ligand, protects against development of liver steatosis and insulin resistance in fa/fa rats. FXR agonism prevented body weight gain and corrected insulin resistance as demonstrated by its insulin and glucose lowering effects, leading to a normalization of insulin and glucose response to the OGTT and ITT. In the latter, glucose plasma levels measured 40 min after the oral glucose load, a validated measure of insulin resistance, were normalized to values similar to those of lean rats. In addition, FXR activation reduced blood triglyceride levels although it had no effects on cholesterol plasma levels. A reduction of circulating levels of HDL was noted. Despite its lack of effect on circulating cholesterol, 6E-CDCA effectively reduced liver fat deposition, improved liver histopathology, and reduced aminotransferases plasma levels. These biochemical effects were supported by molecular changes in the liver and muscles. FXR activation caused a 6-fold increase in the liver expression of SHP, a negative regulator of SREBP-1c and its target gene FAS (32).
Previous studies have shown that FXR deficiency results in insulin resistance in the liver and muscle (12). Despite the fact that FXR deficient mice fail to develop overt diabetes and NASH, even on a high-fat diet, activation of FXR with synthetic agonists or gene transfer ameliorates insulin signaling in the liver and muscle (12). However, FXR is not expressed in muscle cells, indicating that the effects it exerts on the muscle are indirect (12). We found that by increasing β-oxidation and decreasing liver lipogenesis, 6E-CDCA reduced circulating FFA. Because biologically active FFA metabolites activate Ser/Thr kinases causing IRS-1 serine-phosphorylation and impaired IRS-1 thyrosine phosphorylation upon insulin stimulation, the reduction of FFA could contribute to the restoration of insulin signaling (11, 12).
The liver controls blood glucose levels by modulating gluconeogenesis, glycogen synthesis, and glycolysis. The glucokinase and pyruvate kinase are the two rate-limiting enzymes involved in glycogen synthesis and glycolytic pathway. The activation of FXR interferes with glycolysis and gluconeogensis via repressing the pyruvate kinase (type L) and by downregulating the expression of PEPCK and G6-Pase, the two enzymes that catalyze the initial and the last step of gluconeogenesis. Both genes are known to be downregulated by FXR through an SHP-dependent mechanism (13, 33, 34). Repression of pyruvate kinase and induction of glucokinase will increases glycogenosynthesis, further supporting the plasma glucose lowering effect of the FXR ligand.
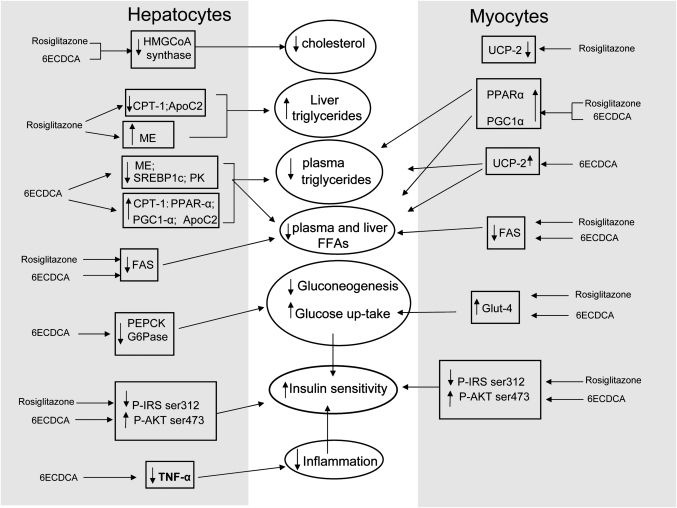
In addition to its liver effects, FXR activation exerted several beneficial effects in the muscle. 6E-CDCA upregulated the muscle expression of GLUT-4, PPARα, uncoupling protein 2, andPGC-1α while downregulating FAS expression. In contrast to 6E-CDCA, rosiglitazone failed to stimulate FFA β-oxidation in the muscle and upregulated FAS expression favoring fat deposition in muscle cells (Fig. 11).
Fig. 11.
Schematic diagram of the effects induced by 6E-CDCA and rosiglitazone in lipid and glucose metabolism.
FXR and PPARγ ligands exert hypoglycemic activities but ligands for the two receptors differ for their activity on β-oxidation. Whereas rosiglitazone inhibited genes involved in fatty acid β-oxidation, the FXR ligand did the opposite. Because β-oxidation of FFA is an efficient pathway to dissipate energy and fat, its inhibition will favor body accumulation of FFA.
Administering fa/fa rats with 6E-CDCA inhibited Cyp7A1 expression and reduced circulating levels of HDL. Because CYP7A1 is the rate-limiting enzyme in bile acid synthesis, its inhibition might impair bile generation (35, 36). In addition, because of the critical role of CYP7A1 in regulating cholesterol homeostasis, the negative regulation of this gene by FXR agonists need to be carefully evaluated in clinically relevant settings (37). Previous studies, however, have shown that FXR activation increases bile flow in rats (37) and reduces the cholesterol saturation index in the bile (38). Reduction of circulating levels of HDL is another common effect observed with FXR ligands. The mechanism for this unwanted effect is at the moment unclear, but studies on human hepatocytes have shown that FXR directly downregulates the synthesis of apoA1, one of the main components of HDL (39). Whether this effect will have negative consequences on lipid metabolism needs to be addressed in clinical settings.
Despite the fact that FXR actions are predominantly exerted in the liver, 6E-CDCA exerted metabolic effects in the muscle an adipose tissue. However, it should be noted that bile acids reach the systemic circulation exerting direct regulatory activities in peripheral tissues. In the muscle, 6E-CDCA upregulated the expression of Glut-4 as well as genes involved in β-oxidation and energy expenditure and downregulated FAS mRNA. However, it should be kept in mind that amelioration of insulin sensitivity in the muscle could also be secondary to the reduction of circulating levels of FFAs.
In summary, this study provides evidence that leptin-receptor mutated Zucker fa/fa rats are a genetic model of insulin resistance and obesity-driven liver injury that share biochemical and histological similarities with NAFLD. Using this model, we have demonstrated that 6E-CDCA an FXR ligand, was effective in counteracting insulin resistance in liver and muscle cells, resulting in a robust attenuation of liver steatosis. Despite the fact that we have measured expression of steady state mRNA but not protein, the present results suggest a beneficial role for FXR ligands in metabolic disorders.
Supplementary Material
Acknowledgments
Sabrina Cipriani carried out animal studies, biochemical analysis, histological analysis, and PCR analysis and wrote the manuscript. Andrea Mencarelli carried out animal studies and biochemical and histological analyses. Giuseppe Palladino carried out PCR and histological analysis. Stefano Fiorucci designed the study and wrote the manuscript.
Footnotes
Abbreviations:
- AKT
- serine/threonine protein kinase PKB
- apo
- apolipoprotein
- ALT
- alanine aminotransferase
- AST
- aspartate aminotransferase
- BA
- bile acid
- CPT-1
- carnitine palmitoyl transferase 1
- CYP7A1
- cholesterol 7α-hydroxylase
- 6E-CDCA
- 6-ethyl-chenodeoxycholic acid
- FXR
- farnesoid X receptor
- FXRE
- FXR response element
- GLUT-4
- glucose transporter 4
- γGT
- gamma glutamyl tranferase
- G6Pase
- glucose-6-phosphatase
- H&E
- hematoxylin-eosin
- IKK β
- IκB kinase
- IRS
- insulin responsive substrate
- ITT
- insulin tolerance test
- JNK
- c-Jun N-terminal protein kinase
- LDL-r
- LDL receptor
- LPK
- pyruvate kinase type L
- LXR
- liver X receptor
- LRH
- liver-related homolog-1
- NAFLD
- nonalcoholic fatty liver disease
- NASH
- nonalcoholic steatohepatitis
- OGTT
- oral glucose tolerance test
- PEPCK
- phosphoenolpyruvate carboxykinase
- PGC1α
- peroxisome proliferator-activated receptor-coactivator-1 α
- PI3K
- phosphatidylinositol-3-kinase
- PKC
- protein kinase C
- PPAR
- peroxisome proliferator-activated receptor
- Ser/Thr
- serine/threonine
- SHP
- small heterodimer partner
- SREBP1c
- sterol-regulatory element binding protein-1c
- TNF
- tumor necrosis factor
The online version of this article (available at http://www.jlr.org) contains supplementary data in the form of two tables.
REFERENCES
- 1.Varela-Rey M., Embade N., Ariz U., Lu S. C., Mato J. M., Martìnez-Chantar M. L. 2009. Non-alcoholic steatohepatitis and animal models: understanding the human disease. Int. J. Biochem. Cell Biol. 41: 969–976 [DOI] [PubMed] [Google Scholar]
- 2.Adams L. A., Angulo P. 2006. Treatment of non-alcoholic fatty liver disease. Postgrad. Med. J. 82: 315–322 [DOI] [PMC free article] [PubMed] [Google Scholar]
- 3.Hotamisligil G. S., Murray D. L., Choy L. N., Spiegelman B. M. 2004. Tumor necrosis factor alpha inhibits signaling from the insulin receptor. Proc. Natl. Acad. Sci. USA. 91: 4854–4858 [DOI] [PMC free article] [PubMed] [Google Scholar]
- 4.Kanety H., Feinstein R., Papa M. Z., Hemi R., Karasik A. 1995. Tumor necrosis factor alpha-induced phosphorylation of insulin receptor substrate-1 (IRS-1). Possible mechanism for suppression of insulin stimulated tyrosine phosphorylation of IRS-1. J. Biol. Chem. 270: 23780–23784 [DOI] [PubMed] [Google Scholar]
- 5.Paz K., Hemi R., Leroith D., Karasik A., Elhanany E., Kanety H., Zick Y. 1997. A molecular basis for insulin resistance. Elevated serine threonine phosphorylation of IRS-1 and IRS-2 inhibits their binding to the juxtamembrane region of the insulin receptor and impairs their ability to undergo insulin-induced tyrosine phosphorylation. J. Biol. Chem. 272: 29911–29918 [DOI] [PubMed] [Google Scholar]
- 6.Zick Y.2001. Insulin resistance: a phosphorylation-based uncoupling of insulin signalling. Trends Cell Biol. 11: 437–441 [DOI] [PubMed] [Google Scholar]
- 7.Kahn S. E., Hull R. L., Utzscheneider K. M. 2006. Mechanisms linking obesity to insulin resistance and type 2 diabetes. Nature. 444: 840–846 [DOI] [PubMed] [Google Scholar]
- 8.Guilherme A., Virbasius J. V., Puri V., Czech M. P. 2008. Adipocyte dysfunctions linking obesity to insulin resistance and type 2 diabetes. Nat. Rev. Mol. Cell Biol. 9: 367–377 [DOI] [PMC free article] [PubMed] [Google Scholar]
- 9.Fiorucci S., Rizzo G., Donini A., Distrutti E., Santucci L. 2007. Targeting farnesoid X receptor for liver and metabolic disorders. Trends Mol. Med. 13: 298–309 [DOI] [PubMed] [Google Scholar]
- 10.Cariou B.2008. The farnesoid X receptor (FXR) as a new target in non-alcoholic steatohepatitis. Diabetes Metab. 34: 685–691 [DOI] [PubMed] [Google Scholar]
- 11.Rizzo G., Disante M., Mencarelli A., Renga B., Gioiello A., Pellicciari R., Fiorucci S. 2006. The farnesoid X receptor promotes adipocyte differentiation and regulates adipose cell function in vivo. Mol. Pharmacol. 70: 1164–1173 [DOI] [PubMed] [Google Scholar]
- 12.Zhang Y., Lee F. Y., Barrera G., Lee H., Vales C., Gonzalez F. J., Willson T. M., Edwards P. A. 2006. Activation of the nuclear receptor FXR improves hyperglycemia and hyperlipidemia in diabetic mice. Proc. Natl. Acad. Sci. USA. 103: 1006–1011 [DOI] [PMC free article] [PubMed] [Google Scholar]
- 13.Duran-Sandoval D., Cariou B., Percevault F., Hennuyer N., Grefhorst A., van Dijk T. H., Gonzalez F. J., Fruchart J. C., Kuipers F., Staels B. 2005. The farnesoid X receptor modulates hepatic carbohydrate metabolism during the fasting-refeeding transition. J. Biol. Chem. 280: 29971–29979 [DOI] [PubMed] [Google Scholar]
- 14.Shen H., Zhang Y., Ding H., Wang X., Chen L., Jiang H., Shen X. 2008. Farnesoid X Receptor induces GLUT4 expression through FXR response element in the GLUT4 promoter. Cell. Physiol. Biochem. 22: 01–14 [DOI] [PubMed] [Google Scholar]
- 15.Durham H. A., Truett G. E. 2006. Development of insulin resistance and hyperphagia in Zucker fatty rats. Am. J. Physiol. Regul. Integr. Comp. Physiol. 290: R652–R658 [DOI] [PubMed] [Google Scholar]
- 16.Larter C. Z., Yeh M. M. 2008. Animal models of NASH: getting both pathology and metabolic context right. J. Gastroenterol. Hepatol. 23: 1635–1648 [DOI] [PubMed] [Google Scholar]
- 17.George J., Liddle C. 2008. Nonalcoholic fatty liver disease: pathogenesis and potential for nuclear receptors as therapeutic targets. Mol. Pharm. 5: 49–59 [DOI] [PubMed] [Google Scholar]
- 18.Cho N., Momose Y. 2008. Peroxisome proliferator-activated receptor gamma agonists as insulin sensitizers: from the discovery to recent progress. Curr. Top. Med. Chem. 8: 1483–1507 [DOI] [PubMed] [Google Scholar]
- 19.Scarpello J.H., Howlett H. C. 2008. Metformin therapy and clinical uses. Diab. Vasc. Dis. Res. 5: 157–167 [DOI] [PubMed] [Google Scholar]
- 20.Fiorucci S., Mencarelli A., Distrutti E., Palladino G., Cipriani S. 2009. Targetting farnesoid-X-receptor: from medicinal chemistry to disease treatment. Curr. Med. Chem. Epub ahead of print. November 24, 2009 [DOI] [PubMed] [Google Scholar]
- 21.Fiorucci S., Antonelli E., Rizzo G., Renga B., Mencarelli A., Riccardi L., Orlandi S., Pellicciari R., Morelli A. 2004. The nuclear receptor SHP mediates inhibition of hepatic stellate cells by FXR and protects against liver fibrosis. Gastroenterology. 127: 1497–1512 [DOI] [PubMed] [Google Scholar]
- 22.Yu C., Chen Y., Cline G. W., Zhang D., Zong H., Wang Y., Bergeron R., Kim J. K., Cushman S. W., Cooney G. J., et al. 2002. Mechanism by which fatty acids inhibit insulin activation of insulin receptor substrate-1 (IRS-1)-associated phosphatidylinositol 3-kinase activity in muscle. J. Biol. Chem. 277: 50230–50236 [DOI] [PubMed] [Google Scholar]
- 23.Shulman G. I.2000. Cellular mechanisms of insulin resistance. J. Clin. Invest. 106: 171–176 (Review) [DOI] [PMC free article] [PubMed] [Google Scholar]
- 24.Hotamisligil G. S.1999. The role of TNFalpha and TNF receptors in obesity and insulin resistance. J. Intern. Med. 245: 621–625 [DOI] [PubMed] [Google Scholar]
- 25.Cariou B., van Harmelen K., Duran-Sandoval D., van Dijk T. H., Grefhorst A., Abdelkarim M., Caron S., Torpier G., Fruchart J. C., Gonzalez F. J., et al. 2006. The farnesoid X receptor modulates adiposity and peripheral insulin sensitivity in mice. J. Biol. Chem. 281: 11039–11049 [DOI] [PubMed] [Google Scholar]
- 26.Wang J., Leclercq I., Brymora J. M., Xu N., Ramezani-Moghadam M., London R. M., Brigstock D., George J. 2009. Kupffer cells mediate leptin-induced liver fibrosis. J. Gastroenterol. 137: 713–723 [DOI] [PMC free article] [PubMed] [Google Scholar]
- 27.Shulman A. I., Mangelsdorf D. J. 2005. Retinoid x receptor heterodimers in the metabolic syndrome. N. Engl. J. Med. 353: 604–615 [DOI] [PubMed] [Google Scholar]
- 28.Aithal G. P., Thomas J. A., Kaye P. V., Lawson A., Ryder S. D., Spendlove I., Austin A. S., Freeman J. M., Morgan L., Webber J. 2008. Randomized, placebo-controlled trial of pioglitazone in nondiabetic subjects with nonalcoholic steatohepatitis. Gastroenterology. 135: 1176–1184 [DOI] [PubMed] [Google Scholar]
- 29.García-Ruiz I., Rodríguez-Juan C., Díaz-Sanjuán T., Martinez M. A., Muñoz-Yagüe T., Solís-Herruzo J. A. 2007. Effects of rosiglitazone on the liver histology and mitochondrial function in ob/ob mice. Hepatology. 46: 414–423 [DOI] [PubMed] [Google Scholar]
- 30.Sharma A. M., Staels B. 2007. Peroxisome proliferator-activated receptor gamma and adipose tissue–understanding obesity-related changes in regulation of lipid and glucose metabolism. J. Clin. Endocrinol. Metab. 92: 386–395 [DOI] [PubMed] [Google Scholar]
- 31.Watanabe M., Houten S. M., Wang L., Moschetta A., Mangelsdorf D. J., Heyman R. A., Moore D. D., Auwerx J. 2004. Bile acids lower triglyceride levels via a pathway involving FXR, SHP, and SREBP-1c. J. Clin. Invest. 113: 1408–1418 [DOI] [PMC free article] [PubMed] [Google Scholar]
- 32.Ma K., Saha P. K., Chan L., Moore D. D. 2006. Farnesoid X receptor is essential for normal glucose homeostasis. J. Clin. Invest. 116: 1102–1109 [DOI] [PMC free article] [PubMed] [Google Scholar]
- 33.Savkur R. S., Bramlett K. S., Michael L. F., Burris T. P. 2005. Regulation of pyruvate dehydrogenase kinase expression by the farnesoid X receptor. Biochem. Biophys. Res. Commun. 329: 391–396 [DOI] [PubMed] [Google Scholar]
- 34.Zhang Y., Castellani L. W., Sinal C. J., Gonzalez F. J., Edwards P. A. 2004. Peroxisome proliferator-activated receptor-gamma coactivator 1alpha (PGC-1alpha) regulates triglyceride metabolism by activation of the nuclear receptor FXR. Genes Dev. 18: 157–169 [DOI] [PMC free article] [PubMed] [Google Scholar]
- 35.Fiorucci S., Baldelli F. 2009. Farnesoid X receptor agonists in biliary tract disease. Curr. Opin. Gastroenterol. 25: 252–259 [DOI] [PubMed] [Google Scholar]
- 36.Chiang J. Y. L.2009. Bile acids: regulation of synthesis. J. Lipid Res. 50: 1955–1966 [DOI] [PMC free article] [PubMed] [Google Scholar]
- 37.Fiorucci S., Clerici C., Antonelli E., Orlandi S., Goodwin B., Sadeghpour B. M., Sabatino G., Russo G., Castellani D., Willson T. M., et al. 2005. Protective effects of 6-ethyl chenodeoxycholic acid, a farnesoid X receptor ligand, in estrogen-induced cholestasis. J. Pharmacol. Exp. Ther. 313: 604–612 [DOI] [PubMed] [Google Scholar]
- 38.Moschetta A., Bookout A. L., Mangelsdorf D. J. 2004. Prevention of cholesterol gallstone disease by FXR agonists in a mouse model. Nat. Med. 10: 1352–1358 [DOI] [PubMed] [Google Scholar]
- 39.Claudel T., Sturm E., Duez H., Torra I. P., Sirvent A., Kosykh V., Fruchart J. C., Dallongeville J., Hum D. W., Kuipers F., et al. 2002. Bile acid-activated nuclear receptor FXR suppresses apolipoprotein A-I transcription via a negative FXR response element. J. Clin. Invest. 109: 961–971 [DOI] [PMC free article] [PubMed] [Google Scholar]
Associated Data
This section collects any data citations, data availability statements, or supplementary materials included in this article.


