

Abstract
India has been underrepresented in genome-wide surveys of human variation. We analyze 25 diverse groups to provide strong evidence for two ancient populations, genetically divergent, that are ancestral to most Indians today. One, the “Ancestral North Indians” (ANI), is genetically close to Middle Easterners, Central Asians, and Europeans, while the other, the “Ancestral South Indians” (ASI), is as distinct from ANI and East Asians as they are from each other. By introducing methods that can estimate ancestry without accurate ancestral populations, we show that ANI ancestry ranges from 39-71% in India, and is higher in traditionally upper caste and Indo-European speakers. Groups with only ASI ancestry may no longer exist in mainland India. However, the Andamanese are an ASI-related group without ANI ancestry, showing that the peopling of the islands must have occurred before ANI-ASI gene flow on the mainland. Allele frequency differences between groups in India are larger than in Europe, reflecting strong founder effects whose signatures have been maintained for thousands of years due to endogamy. We therefore predict that there will be an excess of recessive diseases in India, different in each group, which should be possible to screen and map genetically.
The first systematic surveys of human variation in India focused on anthropometric traits, and found that India is structured along lines of ethnicity as well as geography1, a result that has since been confirmed by blood group, protein polymorphism2,3 and genetic analysis4. Genetic studies have further documented differences in relatedness to West Eurasians5,6,7,8, while mitochondrial DNA (mtDNA) studies have shown that India harbors deep rooted lineages that share no common ancestry with groups outside of South Asia for tens of thousands of years9. The most comprehensive survey of genetic variation in India to date analyzed 405 single nucleotide polymorphisms (SNPs) in 55 groups and identified distinct clusters correlated to language and geography10, while another study analyzed 1,200 polymorphisms in 15 Indian American groups11. However, neither study analyzed enough data to more finely discern patterns of genetic variation.
We genotyped 132 Indian samples from 25 groups. To survey a wide range of ancestries, we sampled 15 states and 6 language families (including 2 language families from the Andaman Islands12) (Table 1 and Figure 1). To compare traditionally “upper” and “lower” castes after controlling for geography, we focused on castes from two states: Uttar Pradesh and Andhra Pradesh. We genotyped all samples on an Affymetrix 6.0 array, yielding data for 560,123 autosomal SNPs after filtering (Methods). Allele frequency differentiation between groups was estimated with high accuracy (FST had an average standard error of ±0.0011; Tables Sl and S2). For some analyses, we also merged our data with HapMap13 and the Human Genome Diversity Panel (HGDP)14,15 (Methods).
Table 1.
25 groups sampled from 13 states of India
| Sampling location | Min FST to others | ||||||||
|---|---|---|---|---|---|---|---|---|---|
| Group | Samples | Language family | Traditional caste or social designation | State/Territory | Nearest large town city or island | Latitude / Longitude | Census size† | Raw | Inbreeding corrected |
| Kashmiri Pandit | 5 | Indo-European | Upper caste | Kashmir | Dras | 34°22’ N / 75°50’ E | 7,000 | 0.0005 | 0.0023 |
| Vaish | 4 | Indo-European | Upper caste | Uttar Pradesh | Jaunpur | 25°46’ N / 82°44’ E | 25,000,000 | 0.0005 | 0.0020 |
| Srivastava | 2 | Indo-European | Upper caste | Uttar Pradesh | Mirzapur | 25°10’ N / 82°37’ E | 10,000,000 | 0.0029 | 0.0023 |
| Sahariya | 4 | Indo-European | Lower caste | Uttar Pradesh | Allahabad | 25°28’ N / 81°54’ E | 41,000 a | 0.0089 | 0.0087 |
| Lodi | 5 | Indo-European | Lower caste | Uttar Pradesh | Jhansi | 26°45’ N / 83°24’ E | 57,000 | 0.0029 | 0.0028 |
| Satnami | 4 | Indo-European | Lower caste | Chhattisgarh | Raipur | 20°29’ N / 85°58’ E | 4,200,000 | 0.0038 | 0.0039 |
| Bhil | 7 | Indo-European | Tribal | Gujarat | Ahmedabad | 23°02’ N / 72°40’ E | 7,400,000 a | 0.0022 | 0.0027 |
| Tharu | 9 | Indo-European | Tribal | Uttarkhand | Nainital | 29°23’ N / 79°30’ E | 96,000 a | 0.0009 | 0.0017 |
| Meghawal | 5 | Indo-European | Lower caste | Rajasthan | Jodhpur | 26°18’ N / 73°04’ E | 890,000 | 0.0034 | 0.0048 |
| Vysya | 5 | Dravidian | Middle caste | Andhra Pradesh | Anantapur | 14°41’ N / 77°39’ E | 3,200,000 | 0.0108 | 0.0087 |
| Naidu | 4 | Dravidian | Upper caste | Andhra Pradesh | Chittoor | 13°13’ N / 79°06’ E | 19,000,000 | 0.0052 | 0.0022 |
| Velama | 4 | Dravidian | Upper caste | Andhra Pradesh | Mahboob Nagar | 16°31’ N / 75°51’ E | 13,000,000 | 0.0078 | 0.0038 |
| Madiga | 4 | Dravidian | Lower caste | Andhra Pradesh | Warangal | 17°58’ N / 79°35’ E | 1,600,000 b | 0.0038 | 0.0028 |
| Mala | 3 | Dravidian | Lower caste | Andhra Pradesh | Hyderabad | 17°22’ N / 78°29’ E | 2,900,000 b | 0.0038 | 0.0030 |
| Kamsali | 4 | Dravidian | Lower caste | Andhra Pradesh | Kurnool | 15°49’ N / 78°02’ E | 5,100,000 | 0.0055 | 0.0022 |
| Chenchu | 6 | Dravidian | Tribal | Andhra Pradesh | Anantapur | 17°22’ N / 78°28’ E | 28,000 a | 0.0524 | 0.0536 |
| Kurumba | 9 | Dravidian | Tribal | Kerala | Palakkad | 10°54’ N / 76°27’ E | 1,300 a | 0.0021 | 0.0017 |
| Hallaki | 7 | Dravidian | Tribal | Karnataka | Uttara Kannada | 13°55’ N / 74°09’ E | 75,000 | 0.0072 | 0.0045 |
| Santhal | 7 | Austro-Asiatic | Tribal | Jharkhand | Santhal Pargana | 24°30’ N / 87°30’ E | 2,100,000 a | 0.0045 | 0.0057 |
| Kharia | 6 | Austro-Asiatic | Tribal | Madhya Pradesh | Raigarh | 23°08’ N / 73°07’ E | 6,900 a | 0.0045 | 0.0057 |
| Nyshi | 4 | Tibeto-Burman | Tribal | Arunachal Pradesh | Papum Pare | 26°55’ N / 92°40’ E | 56,000 a | 0.0215 | 0.0198 |
| Ao Naga | 4 | Tibeto-Burman | Tribal | Nagaland | Kohima | 25°40’ N / 94°08’ E | 105,000 a | 0.0215 | 0.0198 |
| Siddi | 4 | Dravidian* | Tribal | Karnataka | Dharwand | 15°27’ N / 75°05’ E | 25,000 | 0.0746 | 0.0757 |
| Onge | 9 | Jarawa-Onge | Hunter gatherer | Andaman & Nicobar | Little Andaman | 10°30’ N / 92°30’ E | 97 a | 0.0905 | 0.0934 |
| Gr. Andamanese | 7 | Andamanese | Hunter gatherer | Andaman & Nicobar | Great Andaman | 12°12’ N / 93°00’ E | 42 a | 0.0386 | 0.0414 |
The language of the Siddi is Dravidian, but their ancestors spoke a Bantu language.
Census estimates correspond to all of India.
Numbers are based on:
Singh KS (1994) People of India, National Series, Volume III, Scheduled Tribes. Oxford University Press, Oxford;
Singh KS (1993) People of India, National Series, Volume III, Scheduled Castes. Oxford University Press, Oxford.
For some groups (without a superscript) we obtained estimates from the Census of India 1991, Registrar General Office, Government of India.
Figure 1.

Map of India with the state of origin of the 25 groups that we studied.
We analyzed these data to address five questions. Does India harbor more substructure than Europe? Has endogamy been long-standing in Indian groups? Do nearly all Indians descend from a mixture of populations? Is the ancestry of tribal groups systematically different from castes? What is the origin of the indigenous Andaman Islanders?
Extensive population structure in India
We applied principal components analysis (PCA)16,17 to identify outlier groups (Figure S1). The first PC shows that the Siddi have African ancestry, consistent with their origin involving the Arab slave trade18. The second shows that the Nyshi and Ao Naga cluster with the Chinese (CHB), consistent with them speaking Tibeto-Burman languages. The third and fourth show that the Great Andamanese are dispersed, suggesting gene flow from the mainland in the last few generations19, but that the Onge cluster tightly, making them more useful for studying the relationship of the indigenous Andamanese to groups worldwide (Note S1). The Chenchu are a sixth outlier because of their high minimum FST of 0.052 from all other groups (Table S3).
The average pairwise FST of the remaining 19 groups is 0.0109. This is much larger than the 0.0033 in a recent study of 23 European groups20, although a strict comparison is difficult, since European studies have focused on cosmopolitan samples20,21, which could underestimate differentiation relative to our village-centered sampling. We considered the possibility that the high FST could be an artifact due to marriage between close relatives, which is known to be common in southern India22 and can exaggerate measurements of frequency differentiation. However, when we recalculated FST correcting for consanguinity23 (Appendix), the average differentiation decreased only marginally to 0.0100. We also determined that the high FST was not due to our strategy of sampling diverse groups. Restricting to the 9 pairs of groups that were from the same state and traditional caste level, the average inbreeding-corrected FST was 0.0069; much higher than the analogous 0.0018 in Europe when comparing within regions (Table S3).
We propose that the high FST among Indian groups could be explained if many groups were founded by a few individuals, followed by limited gene flow8,24. This hypothesis predicts that within groups, pairs of individuals will tend to have substantial stretches of the genome where they share at least one allele at each SNP. We find signals of excess allele sharing in many groups (Figure S2), which as expected tend to occur in the groups that have the highest FST’s from all others (P=0.002 for a correlation). To estimate the age of founder events, we measured the genetic distance scale over which allele sharing decays, a procedure that we verified by simulation (Figure S3). Six Indo-European and Dravidian speaking groups have evidence of founder events dating to more than 30 generations ago (Figure S2), including the Vysya at more than 100 generations ago. Strong endogamy must have applied since then (average gene flow less than 1 in 30 per generation) to prevent the genetic signatures of founder events from being erased by gene flow. Some historians have argued that “caste” in modern India is an “invention” of colonialism25 in the sense that it became more rigid under colonial rule26. However, our results suggest that many current distinctions among groups are ancient and that strong endogamy must have shaped marriage patterns in India for thousands of years24,27.
Medical implications
The high frequency differentiation among Indian groups is medically significant as it shows that “population stratification” (systematic ancestry differences between cases and controls that can lead to false-positive disease associations) may be a confounder in gene mapping studies. This is superficially at odds with a recent report that in Indian Americans, allele frequency differentiation is lower than among Europeans11. A potential explanation for the discrepancy is that the previous study pooled samples by state of origin, which can mask substructure. For example, when we performed PCA on an independent set of 85 Gujarati Americans28, we found that they separate into two distinct clusters with high differentiation (FST = 0.005) (Figure S4). Similarly, pairs of Uttar Pradesh and Andhra Pradesh groups in our data (excluding the outlying Chenchu) have an average FST of 0.0107, but their differentiation decreases to 0.0033 when we first pool by state. It was recently suggested that to correct for stratification in India, it may be adequate to adjust for membership in five broad genetic clusters10. However, our results show that many Indian groups have a degree of allele frequency differentiation from their neighbors that is at least as large as that between northern and southern Europeans, which is known to be sufficient to cause false positives associations if uncorrected29.
The widespread history of founder events in India is also medically significant because it predicts a high rate of recessive disease. In Finland, there is a high rate of recessive diseases that has been shown to be due to a founder event, and that has resulted in a minimum FST of 0.005 with other European groups20. Our data show that many Indian groups have a minimum FST with all other groups at least as large (Table 1). Haldane wrote 45 years ago that “if inter-caste marriages in India become common, various… recessive characters will become rarer”30. However, it has not been generally appreciated that this applies to groups throughout India, and not only to groups in the south where consanguinity is common22. We hypothesize that founder effects are responsible for an even higher burden of recessive diseases in India than consanguinity. To test this hypothesis, we used our data to estimate the probability that two alleles from a group share a common ancestor more recently than that group’s divergence from other Indians, and compared this to the probability that an individual’s two alleles share an ancestor in the last few generations due to consanguinity23. Nine of the 15 Indian groups for which we could make this assessment had a higher probability of recessive disease due to founder events than to consanguinity, including all the Indo-European speaking groups (Table 2). It is important to systematically survey Indian groups to identify those with the strongest founder effects, and to prioritize them for studies to identify recessive diseases and map genes.
Table 2.
Detection and quantification of population mixture along the Indian Cline
| Indian Cline group | Samples | Z-score from 3 Population Test for mixture | % ANI ancestry | ±1 stand. error | Genetic drift D from the best fitting combination of ANI and ASI * | Wright’s fixation index F (estimates inbreeding) † | Estimated fraction of recessive diseases due to founder events †† |
|---|---|---|---|---|---|---|---|
| Mala | 3 | -2.5 | 38.8% | 1.2% | 0.0023 | 0 | 100% |
| Madiga | 4 | -2.7 | 40.6% | 1.2% | 0.0018 | 0.0061 | 23% |
| Chenchu | 6 | 31.3 (not significant) | 40.7% | 1.3% | 0.0492 | 0 | 100% |
| Bhil | 7 | -10.6 | 42.9% | 1.1% | 0.0024 | 0 | 100% |
| Satnami | 3 | -5.6 | 43.0% | 1.3% | 0.0019 | 0 | 100% |
| Kurumba | 6 | -12.6 | 43.2% | 1.1% | 0.0001 | 0.0052 | 2% |
| Kamsali | 3 | -6.5 | 44.5% | 1.3% | 0.0016 | 0.0066 | 19% |
| Vysya | 5 | 5.4 (not significant) | 46.2% | 1.2% | 0.0083 | 0.0071 | 54% |
| Lodi | 5 | -8.9 | 49.9% | 1.1% | 0.0027 | 0.0056 | 32% |
| Naidu | 4 | -3.3 | 50.1% | 1.2% | 0.0022 | 0.0435 | 5% |
| Tharu | 5 | -20.6 | 51.0% | 1.2% | 0.0000 | 0 | na |
| Velama | 4 | -3.2 | 54.7% | 1.3% | 0.0044 | 0.0197 | 18% |
| Srivastava | 2 | -7.5 | 56.4% | 1.5% | 0.0023 | 0 | 100% |
| Meghawal | 5 | -13.3 | 60.3% | 1.2% | 0.0035 | 0 | 100% |
| Vaish | 4 | -22.0 | 62.6% | 1.2% | 0.0012 | 0 | 100% |
| Kashmiri Pandit | 5 | -20.6 | 70.6% | 1.2% | 0.0019 | 0 | 100% |
| Sindhi | 10 | -26.3 | 73.7% | 1.1% | 0.0008 | 0.0043 | 16% |
| Pathan | 15 | -34.3 | 76.9% | 1.1% | 0.0001 | 0.0039 | 3% |
Estimates of genetic drift (the variance in allele frequencies on any lineage) are based on a model in which each group is a simple mixture of ANI and ASI, followed by subsequent genetic drift specific to that group (corrected for inbreeding). To fit the model, we use the algorithm described in Note S4, and fit f2, f3 and f4 statistics that are calculated in a way that is unbiased by inbreeding (Appendix).
Wright’s fixation index F is estimated as the excess rate at which the two copies of a chromosome within an individual from a group are identical by state, compared within across individuals from that group (Appendix). We set negative values to 0; standard errors are typically around 0.003. Because of the small sample sizes, these estimates are heavily influenced by the samples that happen to have been included in our analysis, and thus should be considered approximate.
To estimate the proportion of recessive disease cases that are due to founder events, we consider the two alleles that a single individual carries at any locus. With probability F given by Wright’s Fixation Index, they coalesce in the last few generations due to consanguinity, and with probability (1-F)D, they coalescence more recently than ANI-ASI mixture due to founder events specific to that group. The fraction of recessive diseases due to founder events can thus be estimated as D(1-F)/(F+D(1-F)).
An additional reason why some diseases are expected to occur at elevated frequencies in India is shared descent from a common Indian ancestral population9,10. An example is a 25 base pair deletion in MYBPC3 that increases heart failure risk by about 7-fold, and occurs at around 4% throughout India but is nearly absent elsewhere31. It has recently been shown that power to discover disease risk variants can be increased by modeling Indian genetic variation using a reference panel of European and Chinese chromosomes32. However, the example of MYBPC3 shows that this is an imperfect solution, since clinically significant alleles that are rare outside of India cannot be imputed by studying non-Indian genetic variation. It is important to specifically characterize Indian variation to permit full powered gene mapping in India, instead of relying on catalogs of variation compiled in distantly related groups.
Population mixture in Indian history
To better understand the genetic ancestry that is only found in India, we carried out a PCA of Europeans (CEU) and Chinese (CHB) along with 22 Indian groups (Figure 3). The first PC distinguishes CEU from CHB, and the second reflects ancestry that is unique to India31. The most remarkable feature of the PCA is a gradient of proximity to West Eurasians (Figure S5) (an analogous PCA in Europeans did not produce a gradient of proximity to India; Figure S6). We call this the “Indian Cline”, and hypothesize that it reflects the fact that different Indian groups have inherited different proportions of ancestry from “Ancestral North Indians” (ANI) related to West Eurasians, and “Ancestral South Indians” (ASI). To model ANI-ASI mixture, we selected a subset of 18 groups that formed tight clusters along the Indian Cline, and included the Pathan and Sindhi from Pakistan14 since they were consistent with the Indian Cline in the PCA but showed greater proximity to West Eurasians (Note S2), providing additional information about ANI-ASI mixture.
Figure 3.
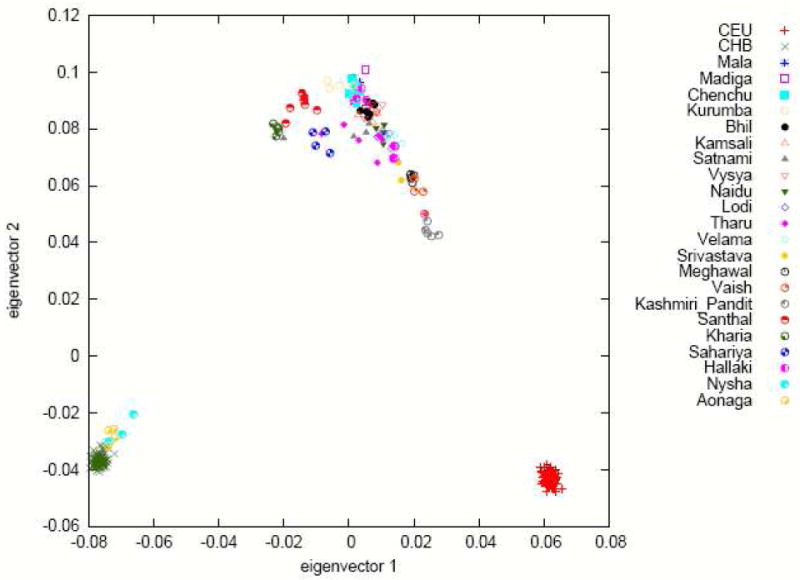
Principal components analysis (PCA) of 22 groups from the Indian subcontinent. Analysis of these groups along with Europeans (CEU) and Chinese (CHB) reveals a gradient of relatedness to CEU that runs through the majority of Indo-European and Dravidian groups, with the Kashmiri Pandit most related to CEU. Both the Austro-Asiatic speaking groups (Kharia and Santhal) and the tribal Sahariya are off-cline, while the two Tibeto-Burman speaking groups cluster with CHB. (Data from the outlying Siddi, Onge and Great Andamanese are not shown.)
To test whether any of the 18 Indian Cline groups is consistent with all ANI or all ASI ancestry, we applied a novel 3 Population Test (Methods). If group X is related to groups Y and W by a simple tree (through a history of divergence without subsequent mixture) then if we define the SNP allele frequencies as pX, pY, and pZ, the quantity (pX-pY)(pX-pW) averaged over SNPs, should be proportional to the variance in allele frequency since group X split from Y and Z and thus should be positive. However, this quantity can be negative if X descends from a mixture event (Note S3 and Appendix). We applied this test to each of the 18 Indian Cline groups in turn using CEU=Y and Santhal=W, and obtained significantly negative scores for 16 groups (Table 2) as assessed by a jackknife analysis33 (Methods). These results do not mean that the Indian groups descend from mixtures of European and Austro-Asiatic speakers, but only that they derive from at least two different groups that are (distantly) related to CEU and Santhal.
We verified the evidence of mixture by carrying out a 4 Population Test34. For any four groups there are 3 possible simple trees. If ((A,B),(C,D)) is correct, the allele frequency differences between A and B should be uncorrelated with those between C and D, which we can assess by averaging the quantity (pA-pB)(pC-pD) across SNPs (Appendix) and testing for consistency with 0 (Methods). No Indian Cline group could be related simply to CEU, Onge and West Africans (YRI) after testing all trees (Table S4).
Relationship of Indians to non-Indians
We developed a model to study the historical relationship of Indian groups to those worldwide, based on the hypothesis that most groups can be approximated as a mixture of two ancestral populations followed by group-specific drift. To fit the model to the data, we computed the squared allele frequency difference between all pairs of groups, and chose parameters by minimizing the difference between observation and expectation (Note S4). The idea of fitting allele frequency differentiation to historical models was first explored by Cavalli-Sforza and Edwards35 and here we extend it to trees with mixture. This approach contrasts with the STRUCTURE algorithm, which fits data without a tree36, or a tree in which many groups split simultaneously from an ancestral population followed by mixture37. While STRUCTURE is accurate for estimating individual mixture proportions in recently mixed groups, it is not clear whether its estimates of ancient mixture are biased because it does not model hierarchical relationships among groups, leading to inaccurate modeling frequencies in ancestral populations. By contrast, we use a more realistic tree model, and provide a test of fit.
Applying our model-fitting procedure, we find that the tree (YRI,(CEU,ANI),(ASI, Onge))) provides an excellent fit to the data from Indian groups. In particular, when the Pathan, Vaish, Meghawal and Bhil are modeled as mixtures of ANI and ASI (Figure 4), the observed allele frequency differentiation statistics are all consistent with the theoretical expectation within three standard deviations (Note S4).
Figure 4.
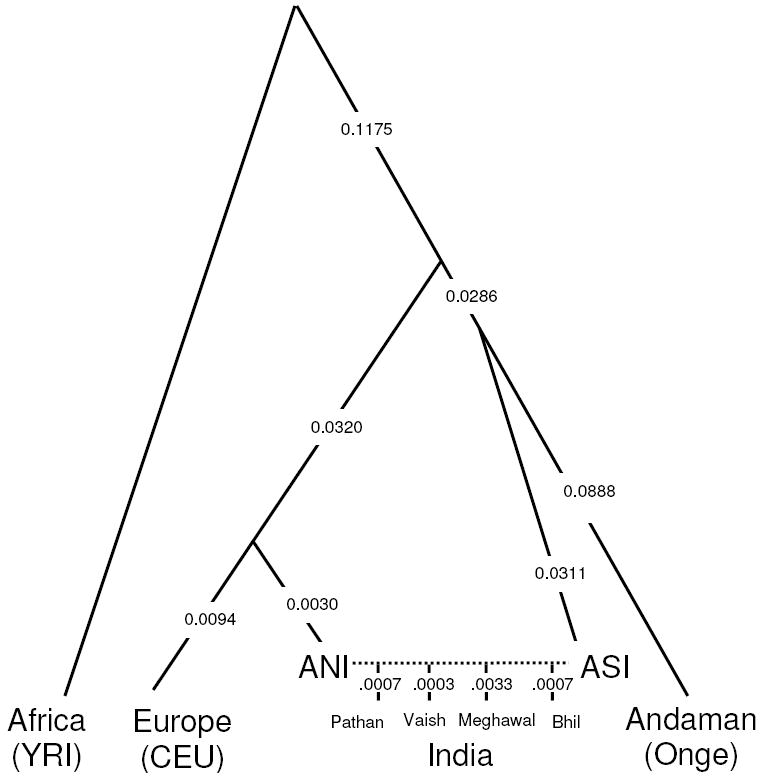
A model relating the history of Indian and non-Indian groups. Modeling the Pathan, Vaish, Meghawal and Bhil as mixtures of ANI and ASI, and relating them to non-Indians by the phylogenetic tree (YRI,(CEU,ANI),(ASI, Onge))), provides an excellent fit to the data. While the model is precise about tree topology and ordering of splits, it provides no information about population size changes or the timings of events. We estimate genetic drift on each lineage in the sense of variance in allele frequencies, which we rescale to be comparable to FST (standard errors are typically ±0.001 but are not shown).
Two features of the inferred history are of special interest. First, the ANI and CEU form a clade, and further analysis shows that the Adygei, a Caucasian group, are an outgroup (Note S4). Many Indian and European groups speak Indo-European languages, while the Adygei speak a Northwest Caucasian language. It is tempting to hypothesize that the population ancestral to ANI and CEU spoke “Proto-Indo-European”, which has been reconstructed as ancestral to both Sanskrit and European languages38, although we cannot be certain without a date for ANI-ASI mixture.
Second, our analysis shows that the Onge form a clade with the ASI (Note S4), which we verified by running the 4 Population Test on ((YRI,Papuan)(Dai,X)), and finding that it is consistent when X=Onge (Z=1.7) but inconsistent for all Indian Cline groups (Z≪-9) (Table S4). Previous mtDNA analyses suggested that the Onge do not share any maternal ancestry with groups outside India within the last ~48,000 years19,39. While they do share ancestry with some rare haplogroups in some Indian tribal populations within the last ~24,000 years 39,40, this is consistent with our inferred Onge-ASI clade, as long as the gene flow predated the ASI-ANI mixture that later occurred on the mainland.
We caution that “models” in population genetics should be treated with caution. While they provide an important framework for testing historical hypotheses, they are oversimplifications. For example, the true ancestral populations of India were probably not homogeneous as we assume in our model but instead were likely to have been formed by clusters of related groups that mixed at different times. However, modeling them as homogeneous fits the data and appears to capture meaningful features of history.
Estimates of mixture proportions in India
Estimating the proportions of ANI and ASI ancestry in India is challenging, since we are unaware of any published methods that produce unbiased estimates of mixture proportion in the absence of accurate ancestral groups. We developed three methods for estimating ancestry, which we verified were accurate even in the face of SNP ascertainment bias and some inaccuracies in our phylogenetic model (Note S5), and which we found provided consistent estimates (Table S5). The 18 Indian Cline groups all have between 39% and 77% ANI ancestry based on f3 Ancestry Estimates (Methods), which we quote because it has the smallest standard errors (Table 2). ANI ancestry is significantly higher in Indo-European than Dravidian speakers (P=0.013 by a 1-sided test)5,6,7,8,41, suggesting that the ancestral ASI may have spoken a Dravidian language before mixing with the ANI42. We also find significantly more ANI ancestry in traditionally upper than lower or middle caste groups (P=0.0025)5,6,7,8,41, and find that traditional caste level is significantly correlated to ANI ancestry even after controlling for language (P=0.0048), suggesting a relationship between the history of caste formation in India and ANI-ASI mixture.
We compared our autosomal estimates of ANI ancestry to Y chromosome and mtDNA haplogroup frequencies. Y chromosome analysis has shown that traditionally upper caste and Indo-European speaking groups have elevated frequencies of alleles that are also common in West Eurasians5,6. However, mtDNA analysis shows elevated frequencies of haplogroups common in West Eurasians only in northwest India7,8,43. Comparing the autosomal estimates of ANI ancestry to the frequencies of haplogroups characteristic of West Eurasians, we find a significant correlation on the Y chromosome (P=0.04) and a more marginal correlation in mtDNA (P=0.08) (Table S6 and Figure S7). The stronger gradient in males, replicating previous reports, could reflect either male gene flow from groups with more ANI relatedness into ones with less, or female gene flow in the reverse direction. However, extensive female gene flow in India would be expected to homogenize ANI ancestry on the autosomes just as in mtDNA, which we do not observe. Supporting the view of little female ANI ancestry in India, Kivisild et al.44 reported that mtDNA ‘haplogroup U’ splits into two deep clades. ‘U2i’ accounts for 77% of copies in India but ~0% in Europe, and ‘U2e’ accounts for 0% of all copies in India but ~10% in Europe. The split is ~50,000 years old, indicating low female gene flow between Europe and India since that time.
Discussion
We have documented a high level of population substructure in India, and have shown that the model of mixture between two ancestral populations ASI and ANI provides an excellent description of genetic variation in many Indian groups. A priority for future work should be to estimate a date for the mixture, which may be possible by studying the length of stretches of ANI ancestry in Indian samples45,46, and will shed light on the process leading to the present structure of Indian groups. A second priority should be to discern the details of the history of the ANI and ASI before they mixed, including the date of their separation and their history of expansion and contraction; this may be possible by analyzing allele frequency spectrum47 and linkage disequilibrium data45,48,49. Our findings finally have medical implications. By showing that a large proportion of Indian groups descend from strong founder events, these results highlight the importance of identifying recessive diseases in these groups and mapping causal genes.
Methods Summary
Blood samples were collected with informed consent from volunteers. We designate groups by their anthropological name as well as their geographic location, since it has been shown that both are required to specify an effectively endogamous group in India1. All DNA samples were genotyped on Affymetrix 6.0 arrays. We restricted most analyses to samples that appeared to be unrelated, and to 560,123 autosomal SNPs for which there was good genotyping completeness and for which there were no signs of problematic genotyping. For some analyses we also intersected our data with Illumina 650Y genotyping of the Human Genome Diversity Panel14 and HapMap13,28, which produced a merged data set of 119,744 autosomal SNPs14. We carried out PCA using the EIGENSOFT software17, assessed allele frequency differentiation among groups using FST, assessed inbreeding in each group using Wright’s Fixation Index F23, and computed standard errors using a Block Jackknife33. To detect the signature of founder events in linkage disequilibrium data, we studied all possible pairs of samples for each group, and recorded whether they share 0, 1 or 2 alleles at each SNP (at SNPs where both individuals were heterozygous, we recorded 1 allele to be shared to account for the ambiguity in the haplotype phase). Long stretches of allele sharing can reflect regions that are shared identical by descent from a common founder, and by measuring the exponential decay of allele sharing with distance, we inferred the age of the founder event (Figure S3). To test for a history of mixture, we applied 3 and 4 Population Tests (Note S3). To infer the proportion of ancestry in each Indian Cline group in the absence of accurate ancestral populations, we used f3 Ancestry Estimation (Note S5).
Supplementary Material
Figure 2.

Linkage disequilibrium based evidence for founder events in India. For each pair of samples, we calculate the autocorrelation of the number of shared alleles as a function of distance, recognizing that SNP genotypes should differ by at most one allele in regions of identity by descent. To correct for background allele sharing, we subtract the same quantity comparing across groups. Allele sharing in the Vysya decreases with an exponential decay of 0.461 cM as shown here, suggesting a founder event roughly 100/(2*0.461) = 108 generations ago. We present similar analyses for all Indian groups in Figure S2.
Acknowledgments
We thank the volunteers from throughout India who donated DNA; A.G. Reddy, A. Shah and R. Tamang for generating the Y chromosome and mtDNA data; J. Neubauer for sample preparation; and A. Tandon for data curation. We thank B.N. Sarkar and A.G. Roy for helping with group census size estimates, and D. Falush, J. Novembre, A. Ruiz-Linares, and S. Watkins for comments on the manuscript. D.R., N.P. and A.L.P. were supported by NIH grant HG004168, and D.R. was supported by a Burroughs Wellcome Career Development Award in the Biomedical Sciences. K.T. and L.S. were supported by grants from the Council of Scientific and Industrial Research of the Government of India, and K.T. was supported by a UKIERI Major Award (RG-4772).
Footnotes
Supplementary Information is linked to the online version of the paper at www.nature.com/nature.
Author Contributions All authors collaborated in designing the study. K.T. and L.S. collected the DNA samples, D.R., K.T. and L.S. collected the genetic data, N.P. developed the mathematical theory for f-statistics, and D.R., K.T., N.P. and A.L.P. analyzed the data. D.R. wrote the manuscript and supplementary information with input from all authors.
Author Information The data used in this study are available on request from D.R. or L.S. Reprints and permission information is available at www.nature.com/reprints. The authors declare no competing financial interests.
References
- 1.Majumbdar DN, Rao CR. Race elements in Bengal: A quantitative study (with a forward by P C Mahalanobis) Calcutta: Asia Publishing House and Statistical Publishing Society; 1960. [Google Scholar]
- 2.Roychoudhury AK, Nei M. Genetic relationships between Indians and their neighboring populations. Hum Hered. 1985;35:201–206. doi: 10.1159/000153545. [DOI] [PubMed] [Google Scholar]
- 3.Das BM, Das PB, Das R, Walter H, Danker-Hopfe H. Anthropological studies in Assam, India. Anthropologischer Anzeiger. 1986;44:239–248. [PubMed] [Google Scholar]
- 4.Zerjal T, Pandya A, Thangaraj K, Ling EY, Kearley J, et al. Y-chromosomal insights into the genetic impact of the caste system in India. Hum Genet. 2007;121:137–144. doi: 10.1007/s00439-006-0282-2. [DOI] [PMC free article] [PubMed] [Google Scholar]
- 5.Bamshad M, Kivisild T, Watkins S, Dixon ME, Ricker CE, et al. Genetic evidence on the origins of Indian caste populations. Genome Res. 2001;11:994–1004. doi: 10.1101/gr.173301. [DOI] [PMC free article] [PubMed] [Google Scholar]
- 6.Wells RS, Yuldasheva N, Ruzibakiev R, Underhill PA, Evseeva I, et al. The Eurasian heartland: a continental perspective on Y-chromosome diversity. Proc Natl Acad Sci USA. 2001;98:10244–10249. doi: 10.1073/pnas.171305098. [DOI] [PMC free article] [PubMed] [Google Scholar]
- 7.Thanseem I, Thangaraj K, Chaubey G, Singh VK, Bhaskar LV, et al. Genetic affinities among the lower castes and tribal groups of India: inference from Y chromosome and mitochondrial DNA. BMC Genet. 2006;7:42. doi: 10.1186/1471-2156-7-42. [DOI] [PMC free article] [PubMed] [Google Scholar]
- 8.Basu A, Mukherjee N, Roy S, Sengupta S, Banerjee S, et al. Ethnic India: a genomic view, with special reference to peopling and structure. Genome Res. 2003;13:2277–2290. doi: 10.1101/gr.1413403. [DOI] [PMC free article] [PubMed] [Google Scholar]
- 9.Thangaraj K, Chaubey G, Singh VK, Vanniarajan A, Thanseem I, et al. In situ origin of deep rooting lineages of mitochondrial Macrohaplogroup ‘M’ in India. BMC Genomics. 2006;7:151. doi: 10.1186/1471-2164-7-151. [DOI] [PMC free article] [PubMed] [Google Scholar]
- 10.Indian Genome Variation Consortium. Genetic landscape of the people of India: a canvas for disease gene exploration. J Genet. 2008;87:3–20. doi: 10.1007/s12041-008-0002-x. [DOI] [PubMed] [Google Scholar]
- 11.Rosenberg NA, Mahajan S, Gonzalez-Quevedo C, Blum MG, Nino-Rosales L, et al. Low levels of genetic divergence across geographically and linguistically diverse populations from India. PLoS Genet. 2006;2:e215. doi: 10.1371/journal.pgen.0020215. [DOI] [PMC free article] [PubMed] [Google Scholar]
- 12.Abbi A. Is Great Andamanese genealogically and typologically distinct from Onge and Jarawa? Language Sciences. 2008 Apr 22; Online publication. [Google Scholar]
- 13.The International HapMap Consortium. A second generation human haplotype map of over 3.1 million SNPs. Nature. 2007;449:851–861. doi: 10.1038/nature06258. [DOI] [PMC free article] [PubMed] [Google Scholar]
- 14.Li JZ, Absher DM, Tang H, Southwick AM, Casto AM, et al. Worldwide human relationships inferred from genome-wide patterns of variation. Science. 2008;319:1100–1104. doi: 10.1126/science.1153717. [DOI] [PubMed] [Google Scholar]
- 15.Jakobsson M, Scholz SW, Scheet P, Gibbs JR, VanLiere JM, et al. Genotype, haplotype and copy-number variation in worldwide human populations. Nature. 2008;451:998–1003. doi: 10.1038/nature06742. [DOI] [PubMed] [Google Scholar]
- 16.Menozzi P, Piazza A, Cavalli-Sforza L. Synthetic maps of human gene frequencies in Europeans. Science. 1978;20:786–792. doi: 10.1126/science.356262. [DOI] [PubMed] [Google Scholar]
- 17.Patterson N, Price AL, Reich D. Population structure and eigenanalysis. PLoS Genet. 2006;2:e190. doi: 10.1371/journal.pgen.0020190. [DOI] [PMC free article] [PubMed] [Google Scholar]
- 18.Thangaraj K, Ramana GV, Singh L. Y-chromosome and mitochondrial DNA polymorphisms in Indian populations. Electrophoresis. 1999;20:1743–1747. doi: 10.1002/(SICI)1522-2683(19990101)20:8<1743::AID-ELPS1743>3.0.CO;2-V. [DOI] [PubMed] [Google Scholar]
- 19.Thangaraj K, Singh L, Reddy AG, Rao VR, Sehgal SC, et al. Genetic affinities of the Andaman Islanders, a vanishing human population. Curr Biol. 2003;21:86–93. doi: 10.1016/s0960-9822(02)01336-2. [DOI] [PubMed] [Google Scholar]
- 20.Lao O, Lu TT, Nothnagel M, Junge O, Freitag-Wolf S, et al. Correlation between genetic and geographic structure in Europe. Curr Biol. 2008;18:1241–1248. doi: 10.1016/j.cub.2008.07.049. [DOI] [PubMed] [Google Scholar]
- 21.Novembre J, Johnson T, Bryc K, Kutalik Z, Boyko AR, et al. Genes mirror geography within Europe. Nature. 2008;456:98–101. doi: 10.1038/nature07331. [DOI] [PMC free article] [PubMed] [Google Scholar]
- 22.Dronamraju KR. Mating systems of the Andhra Pradesh people. Cold Spring Harb Symp Quant Biol. 1964;29:81–84. doi: 10.1101/sqb.1964.029.01.013. [DOI] [PubMed] [Google Scholar]
- 23.Nei M, Chesser RK. Estimation of fixation indices and gene diversities. Ann Hum Genet. 1983;47:253–259. doi: 10.1111/j.1469-1809.1983.tb00993.x. [DOI] [PubMed] [Google Scholar]
- 24.Karve I. Hindu Society–An Interpretation. S. R. Deshmukh; 1968. [Google Scholar]
- 25.Boivin N. Anthropological, historical, archaeological and genetic perspectives on the origins of caste in South Asia. In: Petraglia MD, Allchin B, editors. The evolution and history of human populations in South Asia. Springer; 2007. pp. 341–362. [Google Scholar]
- 26.Dirks NB. Castes of mind: Colonialism and the making of modern India. Princeton University Press; 2001. [Google Scholar]
- 27.Bhasin MK, Walter H. Genetics of castes and tribes of India. Kamla-Raj Enterprises; Delhi, India: 2001. [Google Scholar]
- 28.http://ftp.hapmap.org/genotypes/2008-07_phaseIII/
- 29.Campbell CD, Ogburn EL, Lunetta KL, Lyon HN, Freedman ML, Groop LC, Altshuler D, Ardlie KG, Hirschhorn JN. Demonstrating stratification in a European American population. Nat Genet. 2005;37:868–872. doi: 10.1038/ng1607. [DOI] [PubMed] [Google Scholar]
- 30.Haldane JBS. A Defense of Beanbag Genetics. Perspectives in Biology and Medicine. 1964;7:343–359. doi: 10.1353/pbm.1964.0042. [DOI] [PubMed] [Google Scholar]
- 31.Dhandapany PS, Sadayappan S, Xue Y, Powell GT, Rani DS, et al. A common Cardiac Myosin Binding Protein C variant associated with cardiomyopathies in South Asia. Nature Genetics. 2009;41:187–191. doi: 10.1038/ng.309. [DOI] [PMC free article] [PubMed] [Google Scholar]
- 32.Pemberton TJ, Jakobsson M, Conrad DF, Coop G, Wall JD, et al. Using population mixtures to optimize the utility of genomic databases: linkage disequilibrium and association study design in India. Ann Hum Genet. 2008;72:535–546. doi: 10.1111/j.1469-1809.2008.00457.x. [DOI] [PMC free article] [PubMed] [Google Scholar]
- 33.Künsch HR. The jackknife and the bootstrap for general stationary observations. Ann Statist. 1989;17:1217–1241. [Google Scholar]
- 34.Keinan A, Mullikin JC, Patterson N, Reich D. Measurement of the human allele frequency spectrum demonstrates greater genetic drift in East Asians than in Europeans. Nat Genet. 2007;39:1251–1255. doi: 10.1038/ng2116. [DOI] [PMC free article] [PubMed] [Google Scholar]
- 35.Cavalli-Sforza LL, Edwards AW. Phylogenetic analysis. Models and estimation procedures. Am J Hum Genet. 1967;19:233–257. [PMC free article] [PubMed] [Google Scholar]
- 36.Pritchard JK, Stephens M, Donnelly P. Inference of population structure using multilocus genotype data. Genetics. 2000;155:945–959. doi: 10.1093/genetics/155.2.945. [DOI] [PMC free article] [PubMed] [Google Scholar]
- 37.Falush D, Stephens M, Pritchard JK. Inference of population structure using multilocus genotype data: linked loci and correlated allele frequencies. Genetics. 2003;164:1567–1587. doi: 10.1093/genetics/164.4.1567. [DOI] [PMC free article] [PubMed] [Google Scholar]
- 38.Mallory JP, Adams DO. The Oxford Introduction to Proto-Indo-European and the Proto-Indo-European World. Oxford University Press; Oxford, UK: 2006. [Google Scholar]
- 39.Barik SS, Sahani R, Prasad BV, Endicott P, Metspalu M, et al. Detailed mtDNA genotypes permit a reassessment of the settlement and population structure of the Andaman Islands. Am J Phys Anthropol. 2008;136:19–27. doi: 10.1002/ajpa.20773. [DOI] [PubMed] [Google Scholar]
- 40.Palanichamy MG, Agrawal S, Yao YG, Kong QP, Sun C, et al. Comment on “Reconstructing the Origin of Andaman Islanders”. Science. 2006;311:470. doi: 10.1126/science.1120670. [DOI] [PubMed] [Google Scholar]
- 41.Watkins WS, Thara R, Mowry BJ, Zhang Y, Witherspoon DJ, et al. Genetic variation in South Indian castes: evidence from Y-chromosome, mitochondrial, and autosomal polymorphisms. BMC Genetics. 2008;9:86. doi: 10.1186/1471-2156-9-86. [DOI] [PMC free article] [PubMed] [Google Scholar]
- 42.Southworth FC. Linguistic archaeology of South Asia. London: Routledge-Curzon; 2005. [Google Scholar]
- 43.Cordaux R, Saha N, Bentely GR, Aunger R, Sirajuddin SM, et al. Mitochondrial DNA analysis reveals diverse histories of tribal populations from India. Eur J Hum Genet. 2003;11:253–264. doi: 10.1038/sj.ejhg.5200949. [DOI] [PubMed] [Google Scholar]
- 44.Kivisild T, Bamshad MJ, Kaldma K, Metspalu M, Metspalu E, et al. Deep common ancestry of Indian and western-Eurasian mitochondrial DNA lineages. Current Biology. 1999;9:1331–1334. doi: 10.1016/s0960-9822(00)80057-3. [DOI] [PubMed] [Google Scholar]
- 45.Falush D, Wirth T, Linz B, Pritchard JK, Stephens M, et al. Traces of human migrations in Helicobacter pylori populations. Science. 2003;299:1582–1585. doi: 10.1126/science.1080857. [DOI] [PubMed] [Google Scholar]
- 46.Baird SJE. Phylogenetics: Fisher’s markers of admixture. Heredity. 2006;97:81–83. doi: 10.1038/sj.hdy.6800850. [DOI] [PubMed] [Google Scholar]
- 47.Chikhi L, Bruford MW, Beaumont MA. Estimation of admixture proportions: a likelihood-based approach using Markov chain Monte Carlo. Genetics. 2001;158:1347–1362. doi: 10.1093/genetics/158.3.1347. [DOI] [PMC free article] [PubMed] [Google Scholar]
- 48.Hellenthal G, Auton A, Falush D. Inferring human colonization history using a copying model. PLoS Genet. 2008;4:e1000078. doi: 10.1371/journal.pgen.1000078. [DOI] [PMC free article] [PubMed] [Google Scholar]
- 49.Lohmueller KE, Bustamante CD, Clark AG. Methods for human demographic inference using haplotype patterns from genomewide single-nucleotide polymorphism data. Genetics. 2009;182:217–231. doi: 10.1534/genetics.108.099275. [DOI] [PMC free article] [PubMed] [Google Scholar]
Associated Data
This section collects any data citations, data availability statements, or supplementary materials included in this article.