

Abstract
A common method for quantifying cell death is measuring the concentration of lactate dehydrogenase (LDH) released by cells as their membranes become unstable. In cells expressing green fluorescent protein (GFP), degradation of the cell membrane also results in the release of GFP into the surrounding supernatant. In this study, we used capillary electrophoresis with laser-induced fluorescence detection to measure the levels of GFP in supernatants of UBIGFP/BL6 primary macrophages that had been infected with S. typhimurium, treated with staurosporine, or exposed to H2O2, all known inducers of cell death. We also used a standard LDH assay to measure the release of LDH into supernatants. We observed the rate of cell death quantified by release of GFP and LDH into supernatant to be essentially identical, demonstrating that GFP release is at least as good an indicator of macrophage cell death as the established LDH release method.
Keywords: capillary electrophoresis, laser-induced fluorescence, green fluorescent protein, cell death, lactate dehydrogenase assay
1. Introduction
There are several pathways that lead to cell death [1]. The term necrosis is broadly used to describe cell death of any sort, but when speaking of the mechanisms of cell death, necrosis specifically means accidental death that results in the uncontrolled release of inflammatory cell contents. In contrast, apoptosis is programmed cell death that occurs naturally in a non-inflammatory fashion as a means of dismantling cells that are damaged or no longer useful, as in embryonic development, cell turnover in healthy tissue [2], and damage by reactive oxygen species [3]. A third form of cell death, termed pyroptosis, is pro-inflammatory in nature and is characterized by activation by caspase-1 and release of the pro-inflammatory cytokines IL-1β and IL-18 [4]. Irrespective of the particular mechanism of cell death, the extent of cell death is often required during an experiment.
The most widely used methods for quantifying cell death are all indicators of loss of membrane integrity [5]. Annexin V is a cellular protein that is found on the surface of apoptotic cells as the plasma membrane destabilizes. Antibody stains for annexin V are used to quantify apoptotic cells by flow cytometry and fluorescence microscopy [6]. Many DNA intercalating dyes are impermeable to the intact cell membrane. Presence of the dye in the nucleus of a cell indicates that the cell membrane has been compromised. These intercalating dyes are commonly used as indicators of cell death by flow cytometry and fluorescence microscopy [7, 8]. The number of dying cells in a population can also be quantified indirectly by detecting cytosolic components in the extracellular supernatant. One common assay determines the concentration of lactate dehydrogenase in the supernatant by measuring the activity of the enzyme via a spectroscopic signature [9].
Cells that have been genetically modified to express green fluorescent protein (GFP) are easily characterized by fluorescence microscopy. As cells die, the number of fluorescent cells will decease and their cytoplasmic contents will be released into the cellular supernatant. We hypothesize that release of GFP from cells can be used as an indicator of loss of membrane integrity and cell death. We tested this hypothesis by using capillary electrophoresis with laser-induced fluorescence detection (CE-LIF) to measure the concentration of GFP in the supernatant of cells exposed to death-inducing stimuli. CE-LIF has been shown to be a useful technique for separating and quantifying GFP in biological samples due to its outstanding detection limits, high-efficiency separations, and minute sample volume [10, 11]. Here we demonstrate that CE-LIF can be used to detect GFP in a cellular supernatant and that the amount of GFP in the supernatant correlates strongly with the classic lactate dehydrogenase assay.
2. Materials and Methods
2.1 Sample Preparation
Primary bone marrow-derived macrophages were isolated from C57BL/6 mice engineered to express EGFP under control of the human ubiquitin C promoter (Jackson Laboratory, Bar Harbor, ME) [12]. Femur exudates were cultured for 7 days at 37 °C in 5% CO2 in DMEM supplemented with 10% FCS, 5 mM HEPES, 0.2 mg/mL L-glutamine, 0.05 mM β-mercaptoethanol, 50 mg/mL gentamicin sulfate, 10000 U/mL penicillin and streptomycin (Invitrogen, Carlsbad, USA), and 30% L-cell-conditioned medium prepared in-house. Macrophages were collected by washing with ice-cold PBS containing 1 mM EDTA and resuspending in supplemented antibiotic-free DMEM (without phenol red) containing 5% FCS (DMEM-5). Macrophages were seeded at a density of 2 × 10⁵ cells/well into 24-well plates containing a glass coverslip in each well. Cells were allowed to adhere to the coverslips for 18–20 hours before treatment. One hour prior to infection/treatment, 360 μL of fresh DMEM-5 was added to each well.
2.1.1 Salmonella typhimurium LT2 infection
S. typhimurium strain LT2 was grown as previously described [4]. Briefly, overnight cultures back-diluted 1:15 into L-broth containing 0.3 M sodium chloride were grown at 37°C with shaking for 3 hours. They were then washed and resuspended in cold PBS, and kept on ice before macrophage infections. Macrophages were infected at a multiplicity of infection of 8–10 colony forming units of LT2 per macrophage. The following samples were included as controls: DMEM-5 and DMEM containing 1% Triton (Sigma-Aldrich Co., St. Louis, USA) to check for background fluorescence; untreated macrophages in DMEM-5 to measure spontaneous release of GFP or LDH; and untreated macrophages in DMEM-5 containing 1% Triton to determine the maximum amount of GFP or LDH contained in the well. At the indicated times, supernatants were harvested from each well and placed on ice. Following removal of the supernatant, macrophages on the glass coverslips were fixed for approximately 20 minutes in 200 μL of 2% paraformaldehyde (Sigma-Aldrich Co., St. Louis, USA) in preparation for confocal microscopy. Residual macrophages in the supernatants were removed by pelleting at 1600 rpm for 5 minutes at 10°C. The supernatants were then used for both CE-LIF and LDH determinations.
2.1.2 Staurosporine and H2O2 treatment
Macrophages were treated with either 1 μM staurosporine (Calbiochem, La Jolla, USA) or 5 mM H2O2 (Sigma-Aldrich Co., St. Louis, USA) for the indicated number of minutes at 37 °C. Controls were performed as described above. At the indicated times, supernatants were harvested from each well and placed on ice. Residual macrophages were removed by pelleting at 1600 rpm for 5 minutes at 10 °C. The supernatants were then used for both CE-LIF and LDH determinations.
2.2 CE-LIF
Capillary electrophoresis with laser-induced fluorescence detection was performed on an instrument constructed in-house [13–15]. Sample was injected hydrodynamically. The outlet of the detection cell was connected to a reservoir 118 cm below the distal end of the capillary to provide a siphon pressure of about 12 kPa, which was activated by an electronically controlled solenoid. The typical injection period of 0.7 s produced an injection volume of about 600 pL. Supernatant was injected untreated and undiluted.
Separations were performed in an untreated fused silica capillary (Polymicro Technologies, Phoenix, USA) that was 24 to 26 cm in length and 31 μm internal diameter. The background electrolyte was 100 mM Tris/100 mM CHES/3.5mM SDS. Electrophoresis was performed at 20 kV with the injection end of the capillary held at positive potential and the detector at ground potential. The detection cell was a sheath flow cuvette with background electrolyte as the sheath liquid. Excitation was provided at 473 nm by a diode-pumped solid-state laser (Lasermate Group, Inc., Pomona, USA). Emission was selected with a 500–540 nm bandpass filter (Omega Optical, Brattleboro, USA) and detected with a model CD 2969 single photon counting module (Perkin Elmer, Waltham, USA). Signal was recorded at 50 Hz by LabVeiw software designed in-house.
2.3 Lactate Dehydrogenase Assay
Triplicate 50 μL aliquots of supernatant were transferred to 96-well plates and the presence of the cytoplasmic enzyme LDH was measured using the Cytox96 kit (Promega, Madison, USA) as directed by the manufacturer’s instructions.
2.4 Confocal Microscopy
GFP release from Salmonella-infected macrophages was also measured using confocal microscopy. Following fixation with paraformaldehyde, macrophages were stained with the nuclear dye TO-PRO3 (Molecular Probes, Eugene, USA). The stained cells were analyzed using a Leica SL confocal microscope in the W. M. Keck Center for Advanced Studies in Neural Signaling. The percentage of cells that lost cytoplasmic GFP fluorescence during the course of the experiment was determined using 3–5 fields at each time point.
2.5 Data Analysis
CE-LIF data were processed in MATLAB. The fluorescence signal was corrected for the detector non-linearity by multiplying each data point in the electropherogram by a correction factor C, calculated as C = 1/(1−tdead*V), where tdead is the dead time of the detector in seconds (tdead = 6.0 × 10⁻⁸ s) and V is the value of the data point in Hz [16]. Each corrected electropherogram was smoothed with a five point median filter followed by convolution with a 28 point Gaussian function with a 3 point standard deviation. The GFP signal was measured as peak height, which was calculated as the difference of the maximum value of the GFP peak and the mean value of a section of baseline at the beginning of the electropherogram.
The GFP and LDH signals were normalized by first subtracting the background signal due to spontaneous cell lysis and then dividing by the change in signal due to complete cell lysis:
| (1) |
where Vt is the signal generated by a sample at a time point t, V0 is the signal generated by an untreated sample due to spontaneous release of cellular contents, and Vm is the signal generated from a sample lysed with Triton, which is assumed to release the entire content of the cells. The average and standard deviation of the normalized signal were then calculated at each time point from triplicate assays.
The rate of cell death was determined by a nonlinear weighted least squares fit of the average normalized signal vs. incubation time with the formula
| (2) |
where A is the extent of lysis and t0 is the time required for half the cells to die.
2.5 Biosafety
Salmonella typhimurium LT2 requires biosafety level 2 protocols.
3. Results and Discussion
3.1 CE-LIF of GFP in Supernatants
Fig. 1 presents electropherograms generated from the growth medium and from the medium containing GFP-expressing macrophages that had been treated with staurosporine. The medium contains a number of fluorescent components; these components interfere in fluorescence assay of the medium and in fluorescence microscopy [17]. In addition to the background peak, a prominent peak was observed at 70 s, generated by GFP that had leaked from dead cells.
Figure 1.

Electropherograms of the growth medium (bottom trace) and of the cellular supernatant from cells treated with staurosporine for 240 minutes (top trace). Traces are offset for clarity.
This electrophoresis protocol was used to measure the concentration of GFP in supernatants of macrophages. Supernatant was injected undiluted and untreated. Hydrodynamic siphon pressure injection was employed rather than electrokinetic injection to avoid potential complications with the high salt concentration of cell culture media and the presence of varying components in different samples. The instrumental reproducibility was quite good; replicate injections generated peak heights with an average relative standard deviation of 1.5%.
3.2 Comparison with LDH Release Assay
To determine whether the concentration of GFP in supernatants is an effective indicator of cell membrane permeability, we exposed GFP-expressing mouse macrophages to various stimuli known to cause cell death. In addition to measuring the GFP in the supernatants of these cells at various time points during exposure to death-inducing stimuli, each supernatant sample was also tested for LDH levels by a standard method.
3.2.1 Salmonella typhimurium
Many pathogens, such as the gram-negative bacterium Salmonella typhimurium, induce pyroptosis, or pro-inflammatory cell death, in phagocytic cells such as macrophages. Induction of caspase 1-dependent pyroptosis results in the release of pro-inflammatory cytokines IL-1β and IL-18 through an as-yet unknown mechanism. Cell lysis results in the release of additional inflammatory cellular contents. This inflammation serves to recruit immune cells capable of controlling bacterial infections [18].
We measured levels of GFP and LDH as a function of exposure time to S. typhimurium strain LT2 (Fig. 2). GFP was measured by capillary electrophoretic analysis of the cellular medium and by confocal microscopic counting of the number of surviving fluorescent cells over the course of infection (Fig. 3). The plots of GFP determined by capillary electrophoretic analysis of the supernatant and by confocal analysis were essentially superimposable. In contrast, the LDH signal was consistently smaller than that determined by GFP fluorescence.
Figure 2.

Study of cell death following exposure of GFP-expressing macrophages to S. typhimurium. Black trace – normalized peak height measured by capillary electrophoresis analysis of cellular supernatant. Red trace – fraction of dead cells determined by confocal microscopy of the GFP signal. Green trace – fraction of dead cells determined by a standard LDH assay. The data are plotted ± one standard deviation of the mean of three measurements for the capillary electrophoresis and LDH data and of 3–5 measurements for confocal imaging. The smooth trace in each case is the result of a least-squares fit of equation 2 to the data.
Figure 3.
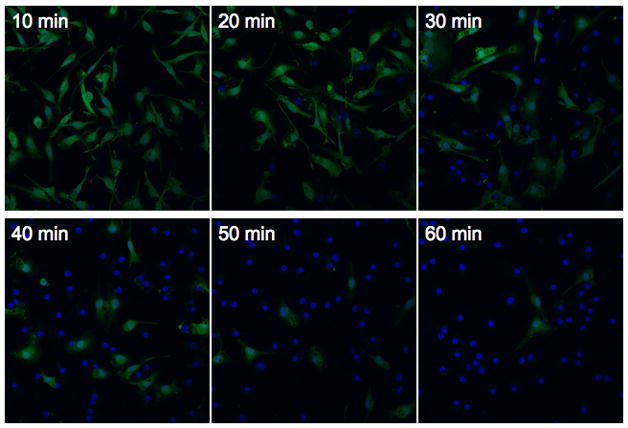
Confocal microscopy of cells infected with S. typhimurium. Bone marrow-derived macrophages constitutively expressing green fluorescent protein were infected with S. typhimurium for various amounts of time prior to fixation. Nuclear DNA was stained using TO-PRO3 (blue) to allow identification of both GFP-positive and GFP-negative cells. Representative images are shown for each time point and correspond to the samples shown in Fig. 2.
In all cases, the data are well described by the error function of equation 2. An error function is expected if the resistance of cells to the agent is normally distributed. The particular error function employed in this study has a standard deviation that equals half of its mean value; the origin of this behavior is unknown.
The kinetic parameters were essentially identical for the three methods of determination (Table 1). Furthermore, a plot of the GFP signal determined by capillary electrophoresis vs. the LDH signal was linear with a slope of 0.93 ± 0.07 (Fig. 4); the value for this plot was 0.8 for four degrees of freedom, (P = 0.5). The linear relationship between the signals generated by GFP fluorescence and LDH strongly supports the hypothesis that the level of GFP in supernatant is an indicator of cell death and release of cellular contents.
Table 1. Kinetics of Release of Cellular Contents.
Information about the rate of release of LDH and GFP into the supernatant by dying macrophages was obtained by fitting equation 2 to the data. DF is the number of degrees of freedom in the fit.
| S. typhimurium | ||||
|---|---|---|---|---|
| Method | CE-LIF | LDH | Confocal microscope | |
| Max | 86 | 81 | 86 | |
| t1/2 | 26 | 30 | 25 | |
|
|
0.93 | 0.35 | 7.4 | |
| DF | 4 | 4 | 4 | |
| Staurosporine | |||
|---|---|---|---|
| Method | CE-LIF | LDH | |
| Max | 77 | 75 | |
| t1/2 | 194 | 224 | |
|
|
0.42 | 0.41 | |
| DF | 6 | 6 | |
| H2O2 | |||
|---|---|---|---|
| Method | CE-LIF | LDH | |
| Max | 79 | 89 | |
| t1/2 | 54 | 57 | |
|
|
14 | 47 | |
| DF | 4 | 4 | |
Figure 4.

Signal for GFP plotted against the signal for LDH from Fig. 2; data are from figure 2. The data are plotted ± one standard deviation of the mean of three replicates. The line is the weighted least squares fit of the data to a line; the weights were calculated as .
3.2.2 Staurosporine
Staurosporine, an alkaloid derived from Streptomyces staurosporeus [19], is a kinase inhibitor that induces apoptosis by activating caspase 3 [20]. In three replicate experiments, both GFP and LDH levels in supernatant were seen to increase with prolonged exposure to staurosporine (Figure 5). Neither the GFP nor LDH levels had reached steady state by 240 minutes of exposure. Based on the half max term derived from the sigmoid curve fit to the release data, half the population had released cellular contents into the supernatant by about 200 minutes.
Figure 5.

Study of cell death following exposure of GFP-expressing macrophages to staurosporine. Black trace – normalized peak height measured by capillary electrophoresis analysis of cellular supernatant. Green trace – fraction of dead cells determined by a standard LDH assay. The data are plotted ± one standard deviation of the mean of three measurements. The smooth trace in each case is the result of a least-squares fit of equation 2 to the data.
The GFP signal measured at each time point of staurosporine treatment was consistently higher than that of LDH. A plot of GFP signal against LDH signal was linear with a slope of 0.77 ± 0.07; was 0.07 for six degrees of freedom, (P ≫ 0.99). Again, the changes in both GFP and LDH levels in supernatant with respect to time exhibited identical rates (Table 1).
3.2.3 H2O2
Reactive oxygen species (ROS) are lethal to cells. ROS-mediated cell death is of interest to many researchers studying inflammation and innate immunity [21]. The results of both the GFP and LDH assay indicated that all or nearly all of the cells in a population released their cellular contents within 90 minutes of exposure to H2O2 (Figure 6).
Figure 6.

Study of cell death following exposure of GFP-expressing macrophages to H2O2. Black trace – normalized peak height measured by capillary electrophoresis analysis of cellular supernatant. Green trace – fraction of dead cells determined by a standard LDH assay. The data are plotted ± one standard deviation of the mean of three measurements. The smooth trace in each case is the result of a least-squares fit of equation 2 to the data.
It is interesting to note that the measured GFP release induced by exposure to H2O2 was nearly equal to the measured LDH signal at any given time point, whereas measured GFP release was consistently greater than LDH release induced by staurosporine treatment and S. typhimurium infection. This is likely due to attenuation of GFP fluorescence by H2O2. While many fluorophores are quenched by ROS, fluorescent studies have shown that GFP excitation and emission are essentially unchanged by exposure to ROS; in fact, GFP may serve as an anti-oxidant, quenching O2*− radicals in a manner similar to superoxide dismutase [22]. However, CE of GFP in the same study showed that, while fluorescence activity was unaffected, ROS levels greater than 1–2 molar equivalents caused denaturation of the GFP protein resulting in differential electrophoretic migration. Consistent with these observations, we also saw an additional peak in electropherograms of H2O2-treated samples that was not present in staurosporine-treated, S. typhimurium-infected, or Triton-lysed samples (Fig. 7). Additionally, the primary GFP peak is wider in H2O2-treated samples, perhaps due to conformational shift of some of the GFP molecules. Both the peak broadening and the differential migration of denatured GFP would contribute to a consistently decreased measured peak height. As there was no H2O2 added to the samples lysed with Triton, the peak height used to determine the maximum possible fluorescence would not have been similarly attenuated and all the normalized peak height values would be uniformly lower than if there were no deformation of GFP by superoxide radicals. Regardless, the peak height of the primary GFP species still served as good indicator of pore formation and release of cellular contents. A plot of GFP signal against LDH signal was linear with a slope of 1.00 ± 0.05; was 0.60 for four degrees of freedom, (P = 0.65). GFP and LDH concentration showed identical rates of cell death in populations of macrophages exposed to H2O2 (Table 1).
Figure 7. Effect of H2O2 on electrophoresis of GFP.

Detail of the electropherogram showing the GFP peak at the final time point for each type of treatment (90 minutes for H2O2, 60 minutes for S. typhimurium, 240 minutes for staurosporine). Electropherograms are offset for clarity. The ▼; shows the peak that is only present in samples treated with H2O2.
4. Conclusion
We have demonstrated that macrophages release their cytoplasmic contents into the surrounding medium when exposed to a variety of death-inducing stimuli. The percentage of the population whose cellular membranes have been compromised can be estimated as the ratio of the concentration of a cytoplasmic molecule in the supernatant relative to the concentration of that same analyte when all the cells have been lysed. The rate at which a population of cells succumbs to death-inducing stimuli can be consistently measured by fitting a sigmoid curve to the release with time. In the case that the macrophages express GFP, CE-LIF can be used to measure increasing levels of GFP in the supernatant of a cell population as more cells expire. The rate at which cells in the population begin to release GFP is the same as that for release of LDH, a standard marker for cell death.
GFP release tends to be consistently higher than LDH release, except in H2O2 treatment, which appears to attenuate the GFP signal. The pores in the compromised cell membrane will have a size-dependent effect on the diffusion of cellular contents across the membrane. At ~140 kDa [23], tetrameric LDH appears to exit more slowly than the 30 kDa GFP. This discrepancy does not mean that either GFP or LDH is the better indicator of cell death, but rather that cell death and the release of cytoplasmic contents are not instantaneous processes. The researcher must be cognizant of the fact that, depending on the size of the analyte being measured, the concentration of released analyte may be a lagging indicator of cell death.
Acknowledgments
Funding for this work was provided by the National Institutes of Health (P50HG002360).
Footnotes
Publisher's Disclaimer: This is a PDF file of an unedited manuscript that has been accepted for publication. As a service to our customers we are providing this early version of the manuscript. The manuscript will undergo copyediting, typesetting, and review of the resulting proof before it is published in its final citable form. Please note that during the production process errors may be discovered which could affect the content, and all legal disclaimers that apply to the journal pertain.
References
- 1.Fink SL, Cookson BT. Infect Immun. 2005;73:1907–16. doi: 10.1128/IAI.73.4.1907-1916.2005. [DOI] [PMC free article] [PubMed] [Google Scholar]
- 2.Kerr JF, Wyllie AH, Currie AR. Br J Cancer. 1972;26:239–57. doi: 10.1038/bjc.1972.33. [DOI] [PMC free article] [PubMed] [Google Scholar]
- 3.Zhang Y, Fong CC, Wong MS, Tzang CH, Lai WP, Fong WF, Sui SF, Yang M. Apoptosis. 2005;10:545–56. doi: 10.1007/s10495-005-1885-0. [DOI] [PubMed] [Google Scholar]
- 4.Brennan MA, Cookson BT. Mol Microbiol. 2000;38:31–40. doi: 10.1046/j.1365-2958.2000.02103.x. [DOI] [PubMed] [Google Scholar]
- 5.McCarthy NJ, Evan GI. Curr Top Dev Biol. 1998;36:259–78. doi: 10.1016/s0070-2153(08)60507-4. [DOI] [PubMed] [Google Scholar]
- 6.van Engeland M, Nieland LJ, Ramaekers FC, Schutte B, Reutelingsperger CP. Cytometry. 1998;31:1–9. doi: 10.1002/(sici)1097-0320(19980101)31:1<1::aid-cyto1>3.0.co;2-r. [DOI] [PubMed] [Google Scholar]
- 7.Lecoeur H. Exp Cell Res. 2002;277:1–14. doi: 10.1006/excr.2002.5537. [DOI] [PubMed] [Google Scholar]
- 8.Fink SL, Cookson BT. Cell Microbiol. 2006;8:1812–25. doi: 10.1111/j.1462-5822.2006.00751.x. [DOI] [PubMed] [Google Scholar]
- 9.Decker T, Lohmann-Matthes ML. J Immunol Methods. 1988;115:61–9. doi: 10.1016/0022-1759(88)90310-9. [DOI] [PubMed] [Google Scholar]
- 10.Malek A, Khaledi MG. Anal Biochem. 1999;268:262–9. doi: 10.1006/abio.1998.2975. [DOI] [PubMed] [Google Scholar]
- 11.Turner EH, Lauterbach K, Pugsley HR, Palmer VR, Dovichi NJ. Anal Chem. 2007;79:778–81. doi: 10.1021/ac061778r. [DOI] [PubMed] [Google Scholar]
- 12.Schaefer BC, Schaefer ML, Kappler JW, Marrack P, Kedl RM. Cell Immunol. 2001;214:110–22. doi: 10.1006/cimm.2001.1895. [DOI] [PubMed] [Google Scholar]
- 13.Cheng YF, Dovichi NJ. Science. 1988;242:562–4. doi: 10.1126/science.3140381. [DOI] [PubMed] [Google Scholar]
- 14.Wu S, Dovichi NJ. J Chromatogr. 1989;480:141–55. doi: 10.1016/s0021-9673(01)84284-9. [DOI] [PubMed] [Google Scholar]
- 15.Krylov SN, Starke DA, Arriaga EA, Zhang Z, Chan NW, Palcic MM, Dovichi NJ. Anal Chem. 2000;72:872–7. doi: 10.1021/ac991096m. [DOI] [PubMed] [Google Scholar]
- 16.Whitmore CD, Essaka D, Dovichi NJ. Talanta. 2009;80:744–8. doi: 10.1016/j.talanta.2009.07.060. [DOI] [PMC free article] [PubMed] [Google Scholar]
- 17.Billinton N, Knight AW. Anal Biochem. 2001;291:175–97. doi: 10.1006/abio.2000.5006. [DOI] [PubMed] [Google Scholar]
- 18.Fink SL, Cookson BT. Cell Microbiol. 2007;9:2562–70. doi: 10.1111/j.1462-5822.2007.01036.x. [DOI] [PubMed] [Google Scholar]
- 19.Omura S, Iwai Y, Hirano A, Nakagawa A, Awaya J, Tsuchya H, Takahashi Y, Masuma R. J Antibiot. Vol. 30. Tokyo: 1977. pp. 275–82. [DOI] [PubMed] [Google Scholar]
- 20.Chae HJ, Kang JS, Byun JO, Han KS, Kim DU, Oh SM, Kim HM, Chae SW, Kim HR. Pharmacol Res. 2000;42:373–81. doi: 10.1006/phrs.2000.0700. [DOI] [PubMed] [Google Scholar]
- 21.Ryter SW, Kim HP, Hoetzel A, Park JW, Nakahira K, Wang X, Choi AM. Antioxid Redox Signal. 2007;9:49–89. doi: 10.1089/ars.2007.9.49. [DOI] [PubMed] [Google Scholar]
- 22.Bou-Abdallah F, Chasteen ND, Lesser MP. Biochim Biophys Acta. 2006;1760:1690–5. doi: 10.1016/j.bbagen.2006.08.014. [DOI] [PMC free article] [PubMed] [Google Scholar]
- 23.Hiraoka BY, Sharief FS, Yang YW, Li WH, Li SS. Eur J Biochem. 1990;189:215–20. doi: 10.1111/j.1432-1033.1990.tb15479.x. 2010 January 18. [DOI] [PubMed] [Google Scholar]