

Abstract
The biochemical regulation of energy metabolism (EM) allows cells to modulate their energetic output depending on available substrates and requirements. To this end, numerous biomolecular mechanisms exist that allow the sensing of the energetic state and corresponding adjustment of enzymatic reaction rates. This regulation is known to induce dynamic systems properties such as oscillations or perfect adaptation. Although the various mechanisms of energy regulation have been studied in detail from many angles at the experimental and theoretical levels, no framework is available for the systematic analysis of EM from a control systems perspective. In this study, we have used principles well known in control to clarify the basic system features that govern EM. The major result is a subdivision of the biomolecular mechanisms of energy regulation in terms of widely used engineering control mechanisms: proportional, integral, derivative control, and structures: feedback, cascade and feed-forward control. Evidence for each mechanism and structure is demonstrated and the implications for systems properties are shown through simulations. As the equivalence between biological systems and control components presented here is generic, it is also hypothesized that our work could eventually have an applicability that is much wider than the focus of the current study.
Keywords: control theory, energy metabolism, metabolic regulation, systems biology
1. Introduction
1.1. General considerations about energy in cellular processes
Energy is involved in most, if not all, cellular processes. Cellular growth requires free energy for the synthesis and organization of cellular components and the cell wall. Maintenance processes such as protein disposal and maintaining membrane integrity and ion concentrations also require energy. All signalling pathways will include protein phosphorylation cascades, in which phosphate is transferred from energy-rich molecules. The most fundamental function of a living organism—the transcription of its genome and further protein synthesis—can account for a significant portion (up to 40%) of the energy budget (Buttgereit et al. 2000).
In this regard, energy obtained from the breakdown of substrates such as glucose (GLC) has to be transferred to endergonic reactions. Adenosine triphosphate (ATP) is the main ‘energy currency’ in living organisms and must be continuously available in order to maintain the cell's capacity to fulfil its function—e.g. processing signals and producing adequate responses. Energy is thus a central player in the complex system that is the living cell.
Energy metabolism (EM) in this study will refer to the metabolic reactions by which cells use available substrates to produce energy in the form of ATP. Interestingly, these metabolic pathways are the most preserved in living organisms; a fact that shows the critical importance of EM in maintaining proper cellular function. Improper energy production and regulation is reported in many diseases such as neurodegeneration (Lotharius & Brundin 2002; Parihar & Brewer 2007), cardiovascular insufficiency (Kensara et al. 2006; Hardie 2008), immunological disorders (Buttgereit et al. 2000) and cancer (Carew & Huang 2002; Pedersen 2007). Energy regulation is therefore of great importance to both the healthy operation of cellular processes and disease conditions. A better understanding of the systems aspects of energy regulation could thus have significant implications in the analysis of various diseases as well as in the design of therapies. For example, Seyfried & Mukherjee (2005) report that a correct understanding of energy regulation in cancer cells allowed the design of a nutritional regime to arrest the growth of an inoperable brain tumour. However, a precise regime, both in terms of quantity and timing, was necessary for the approach to be efficient (Seyfried & Mukherjee 2005). This in turn implies a need for an understanding of dynamic control mechanisms involved in cancer cells. Unfortunately, this nutritional regime was not further validated in large-scale clinical studies. But its success, even though limited in scale and possible validity, is nevertheless insightful. Such findings illustrate the importance of considering the dynamics of a system, and thus a general control framework, such as the one presented here, might be relevant for future studies on the implications of EM in disease.
1.2. Mechanisms for energy production and regulation
Glycolysis is found in virtually all cell species. This pathway can convert the most readily available sugars (especially GLC) into pyruvate (PYR) while regenerating two molecules of ATP. PYR can in turn be processed through oxidative phosphorylation (OP) to further produce energy with a yield of around 30 ATP per molecule of GLC. In eukaryotes and higher organisms, OP takes place in mitochondria, hence their common label as the ‘energy generator’ of the cell. In prokaryotes, OP is much less organized, with oxidative reactions occurring sparsely in the cytosolic fluid and at the cell membrane. These two pathways (glycolysis and OP) and their regulation are the focus of this study.
Although glycolysis and OP are the main pathways for energy generation, cells and tissues have other mechanisms for energy production and storage. For example, phosphagen molecules, such as phosphocreatine (PCr), can act as a temporary buffer during high-demand periods. This mechanism was shown to be important in muscle tissue under various conditions of energy demand and metabolic regimes (Hochachka & McClelland 1997). Although other functions have been unveiled for PCr, such as spatial buffering (Bessman & Geiger 1981), we will limit our analysis here to its potential function as a temporal buffer. Simulation results will, however, show that PCr is present in sufficient quantities to perform both functions (spatial and temporal buffering).
Finally, GLC is not the only energy substrate involved in glycolysis. Some cells can store it under various forms, such as glycogen (in mammalian tissues) or starch (in plants). These local reserves can then be drawn upon during high-demand periods or during periods of nutrient limitation. In this study, we will not analyse these phenomena, rather we will simply consider that nutrients (GLC and O2) are present in sufficient concentrations. However, other substrates can enter the cells at some branch points in EM. In this context, lactate (LAC) has been usually considered as an undesirable by-product of anaerobic glycolysis, but is now believed to be an important player in EM in the cerebral tissue (Pellerin & Magistretti 1994; Schurr 2006). Specifically, LAC is easily converted to PYR through the reverse action of lactate dehydrogenase (LDH) and thus can rapidly feed OP. In neurons, this reaction can even occur inside the mitochondria (Schurr 2006), which suggests that LAC, and not PYR, might be the substrate for OP. As a comparison, GLC has to go through the sequence of nine reactions of glycolysis in order to produce PYR. As for the implication of LAC in EM regulation, it has been shown in cultivated neurons that increasing extracellular LAC concentration leads to higher ATP levels in cells (Ainscow et al. 2002). In the work reported here, we will consider a reaction scheme where LAC can be employed as an energy substrate in a way that complements GLC usage.
1.3. Systems properties and control in biology
Systems properties have been reported for EM. In particular, glycolytic oscillations are observed in yeast because of specific interactions between glycolytic components (Chance et al. 1964; Termonia & Ross 1981). Coupling between energy production and utilization (Heinrich & Schuster 1996; Fell 1997) is also a common observation. Finally, energy homeostasis is reported in many tissues, even in the presence of large changes in energy demand (Hochachka & McClelland 1997). It is known that these properties are observed because of the possible interactions between the components of EM, and each study offers specific reasons for the observation of such properties. However, although the biomolecular mechanisms behind EM (in addition to its properties as a regulated system) are very well known, no general framework is available with which to analyse the functional links between the mechanisms and the systems properties of EM.
It is known that biophysical processes can exhibit properties similar to those of control systems components. For example, the regulation of reaction rates by the state of a system has already been compared with proportional action (Yi et al. 2000; Csete & Doyle 2002; El-Samad et al. 2002). Integral feedback by the accumulation of molecules is reported to be involved in homeostasis (Yi et al. 2000; El-Samad et al. 2002), and feed-forward control is part of one of the most recurrent patterns in gene regulation networks (Mangan & Alon 2003), as well as being involved in the regulation of glycolytic intermediates (Bali & Thomas 2001). More recently, a study by Chandra et al. (2009) showed that a simplified model of glycolysis could be studied within a control theory framework. These observations show that control properties are inherent to many biological regulation mechanisms and suggest that it would be desirable and instructive to construct a general control framework within which to analyse such systems.
1.4. Application to energy metabolism
In this study, a control framework will be developed for the regulation of EM. Our aim is to reveal the essential control features, and thus we use the language of a first course in classical control systems and focus upon revealing the most basic control mechanisms and structures; questions of nonlinearity and details of stability are left to subsequent specialist studies. For consistency, we will use one control text (Seborg et al. 1989) as our main reference for the engineering equivalents of the EM regulation features that we discuss.
As a focus for the discussion, we use a generic mathematical model of glycolysis and OP and their regulation by the energetic state. This generic model will then be used to delineate the contribution of each component in terms of its control action. (In control terms, we consider the manipulated variables to be the energy-producing reactions and the controlled variable to be the ATP concentration.) Using different hypotheses for EM regulation, we will consider the dynamic response of the generic model to changes in energy demand and associate these responses with the various control actions used in EM. This will allow the specific forms of control to be identified and analogies drawn with classical control. The generic mathematical model is presented in the following section.
2. Modelling energy metabolism
2.1. Model presentation
Figure 1 illustrates the structure of a generic mathematical model for EM. A complete description of the model, with mass balances, kinetic equations and hypotheses is given in the electronic supplementary material. The biochemical regulation of EM pathways was mainly elucidated by the analysis of enzyme kinetics, and as a result detailed mathematical models are available for EM in various cell species and tissues (Korzeniewski & Zoladz 2001; Chassagnole et al. 2002; Lambeth & Kushmerick 2002; Holzhütter 2004; Aubert & Costalat 2005; Cloutier et al. in press, to give a few recent examples). The generic model developed and presented here is based upon these prior works. This model describes the following subsystems of EM:
glycolysis (reduced to three reactions: vHK, vPFK and vPK, see electronic supplementary material),
accumulation of fructose-2,6-bisphosphate (F26P), an activator of glycolysis, through the vPFK2 reaction,
OP (vOP), regulated by the availability of PYR, ADP and by the energetic state,
PCr buffering with the creatine kinase (vCK) reaction,
lactate consumption or excretion through the LAC dehydrogenase enzyme (vLDH) and external supply of LAC (vLAC), and
adenylate kinase equilibrium (vADK), which converts ADP to AMP + ATP depending on the energetic state of the system.
Figure 1.

A generic model for energy metabolism.
Parameters and steady-state concentrations used in the generic model were taken (where available) from the literature (see electronic supplementary material for further details). Otherwise, curve-fitting techniques were used to identify unknown parameters using the procedures discussed in Cloutier et al. (in press) and Schmidt & Jirstrand (2006). Mathematical representations for specific EM and EM regulation mechanisms were also taken from the previously cited modelling literature and used in the generic model. The model was also validated against existing experimental and theoretical insights (see electronic supplementary material), and is therefore believed to produce a realistic behaviour for the generic dynamics of EM.
Although the EM pathways are conserved between organisms, the reactions may occur on significantly different time scales. As an example, the metabolic rate (i.e. moles of GLC consumed per unit of time) will be 10 times lower in resting muscle cells than in resting neurons. Accordingly, the metabolic rates of various cells and bacteria will also be very different, to the point that it would be impractical to directly compare simulation results that are separated by several orders of magnitude in time. Thus, in keeping with the generic nature of the model and analysis, the time scale used in this study will be arbitrary. However, this does not affect the observations about the qualitative description of each regulation mechanism. Moreover, the time scale can be readily scaled up or down to represent a specific system, without materially affecting the shape of the simulation results (i.e. reaction rates expressed in s−1 could be changed to min−1 or h−1). One note of caution, however, is that care must be taken to ensure that the model correctly reproduces the specific properties of the system that is to be studied and to note that reactions might not be scaled with exactly the same factor. Despite this cautionary remark on relative reaction rates, and as will be seen in §3, the proposed control mechanisms seem to be sufficiently robust to apply to a wide range of conditions.
2.2. Regulation mechanisms
Table 1 presents the various regulation schemes we will consider in this study. Note that for the EM implementations discussed in §3, the regulation mechanisms will be added in a cumulative fashion from one scheme to the next. Thus, the simulation of scheme E will also include all the regulation mechanisms presented in schemes A–D. On the other hand, schemes A–C do not consider the action of PCr or LAC (which appear in schemes D and F, respectively). The only exception will be case F, which will be shown to be a very specific case of EM. This stage-wise addition of regulation mechanisms allows the performance for various energy regulation schemes observed in living cells to be built up from the most simple and common mechanisms of enzyme regulation (found in basically all organisms) to the complex consideration of LAC shuttling in the cerebral tissue (case F).
Table 1.
Regulation mechanisms considered for EM. References: A, B: Lambeth & Kushmerick (2002) and references therein; C: Heldt et al. (1972); D: Voet & Voet (2005) and references therein; E: Okar et al. (2001); F: Cloutier et al. (2009); Aubert & Costalat (2005) and references therein.
| regulation | observed in … | equation—reactions | ||
|---|---|---|---|---|
| A | vPFK regulation by ATP–AMP concentrations | glycolytic organisms |
vPFK is multiplied by |
|
| B | vPK regulation by ATP | glycolytic organisms |
vPK is multiplied by |
|
| C | vOP regulation by ADP/ATP | eukaryotes |
vOP is multiplied by |
|
| D | PCr buffering | eukaryotes/animal tissues | 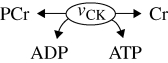 |
|
| E | F26P accumulation | eukaryotes | 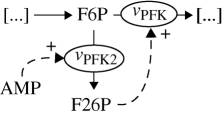 |
|
| F | LAC shuttling | brain | 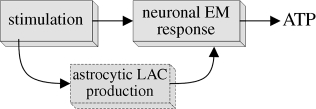 |
2.3. Dynamics of energy regulation
The model will be used to qualitatively analyse the response of EM after a step change in energy demand. Other studies could be performed, but this approach of changing energy demand emulates many physiological systems. For example, muscle contraction or neuron firing induces a sharp increase in ATP consumption. The analysis of step changes in demand is also in keeping with the control systems theme of this paper. Specifically, a standard way of assessing the performance of a closed-loop control system is via its response to a step change in demand (Seborg et al. 1989, ch. 3). The step response gives both (i) a measure of the control system's steady-state ability to meet changes in demands and (ii) (via the nature of the transient response) an indication of the stability properties of the feedback methods used (Seborg et al. 1989, ch. 11). (We add, however, the caveat that these remarks refer to the locally linearized responses of the system—we defer more complex consideration of the nonlinear aspects of EM response to a further work.)
Both steady-state and transient performance are important, but in the dynamic environment of living systems, the transient behaviour has special implications. In particular, the cell cycle implies continuous variations in energy demand over time (i.e. the energy demand is higher when the cells have to produce more protein and cell components). In the same spirit, many cellular functions, such as immunological response, imply changes in energy demand over time (Buttgereit et al. 2000). For these reasons, we analyse the performance of EM regulation through its capacity to cope with various changes in energy demand, and relate this to the engineering control systems design procedure of assessing controller performance using a step response and/or disturbance rejection criterion.
3. Simulations results and analysis
3.1. Comparing the different schemes for ATP regulation
Figure 2 presents simulations results for the six different regulation schemes (table 1) for a change in demand for energy. Two possible changes in energy demand are considered: (i) a step change of +50 per cent in vATPase, and (ii) a more gradual increase in the vATPase demand.
Figure 2.

Performance of energy control—letters A–F refer to control schemes in table 1.
As can be seen from figure 2, the different control schemes lead to qualitatively different behaviours. In case A, the regulation is limited to vPFK and a sharp increase in energy demand induces oscillations (grey lines). Even if the transition is smooth (dark lines in figure 2), the system tends to develop an oscillatory behaviour. In control systems theoretic terms, and when considered on a local linear basis, the multiplication of vPFK by the right-hand-column equation in table 1 creates a negative feedback closed-loop system on vPFK. Because of the large number of reactions in the loop, and the associated lags and time delays, the closed loop is unstable and an oscillatory response ensues. If the closed-loop system were to be linear, then the amplitude of theses oscillations would grow exponentially without limit. However, the nonlinear nature of the reactions and feedback ensure that the oscillatory response grows into an oscillation with bounded amplitude (technically termed a ‘limit cycle’; Atherton 1982). This oscillatory response is an asymptotic property of the feedback loop and is independent of the speed with which the change in energy demand is made. This is illustrated in figure 2 by comparing the responses to a rapid (step) change in demand with the response to a slow change in demand. The step demand causes the limit cycle to appear immediately, whereas for a slow change in demand the amplitudes of the limit cycle oscillations grow more slowly over time, but will eventually develop into stable sustained oscillations of the same magnitude and frequency as in the step-change case (simulations not shown).
The addition of regulation mechanisms in cases B–D adds two further negative feedback loops within the main (outer) loop provided by case A. These additional loops can dampen or completely remove the oscillations seen in case A. Notice that in cases A–D, although the transient response to step demands improves from case to case, the steady-state level of available ATP decreases after the increase in vATPase demand. This lack of adaptation is a known property of certain control system structures where it is referred to as ‘steady-state error’ or ‘offset’ (Seborg et al. 1989, ch. 8). It is thus relevant to observe that cases E and F (in addition to good transient responses) also exhibit perfect adaptation of the ATP level even in the presence of a significant change in energy demand (i.e. homeostasis). This observation tells us that mechanisms E and F must add an additional control mechanism to EM.
As mentioned previously, these observations of oscillation or perfect adaptation have all been reported experimentally (Chance et al. 1964; Hochachka & McClelland 1997), but previously they have not been systematically associated with the control system structures within the EM. Our modelling framework addresses this issue, and is able to clearly separate the contribution of each EM component to the observed systems behaviour. In the following sections, each reaction scheme will be studied in more detail and with reference to the corresponding control components.
3.2. Putting the ‘control’ back in metabolic control
The cases presented in figure 2 will be analysed in §§3.3–3.7 from a control theoretic view. First, cases A–C show regulation of reaction rates by the energetic state. As will be shown, this is equivalent to proportional feedback control (i.e. reaction rates producing energy are proportional to the offset in ATP). In case D, the addition of the dynamic contribution of a buffer for the energy balance shows (figure 2), under specific conditions, similarities found when derivative control is added to proportional feedback. A further level of sophistication comes with the accumulation of an activator of glycolysis, such as F26P (case E). This provides additional control in the form of an integral action, as the accumulation occurs when the energy level is perturbed. Finally, a very specific case is observed in figure 2 for case F. In this situation, the increase in energy demand is forwarded to a second system, which responds by producing energy substrate (LAC) for the first system. As will be shown, this is identical to feed-forward control.
3.3. Proportional and cascade control through enzyme regulation
Figure 3 shows a breakdown of cases A–C, where different schemes for enzyme regulation were considered. First, all the regulation terms considered are proportional to ATP (or ATP/ADP and AMP, other indicators of energy level). As these reactions ultimately lead to energy production, a striking analogy with proportional control can be drawn. Figure 3 reveals the negative feedback structures in EM in a diagrammatic form. In particular, the figure shows how the information about the state of the system (ATP, ADP) is sent back to modulate the various reactions of EM. As can be seen from the regulation expressions, the reaction rates are proportional to the energetic state, although here the relations are nonlinear. An important observation here, though, is that all the nonlinear expressions work in the same ‘direction’. When the energetic state is reduced (ATP↓, ATP/ADP↓), reaction rates are increased in order to produce more energy (e.g. proportional negative feedback action).
Figure 3.

Regulation of EM reactions with cascade structure. States and reactions are per cent of steady-state values. Blue lines, A; green lines, B; red lines, C.
In case A (blue lines), only the first reaction (vPFK) is controlled. A delay is thus observed before the activation of the last step (blue line for vOP). This is perfectly normal, as the system has to accumulate metabolites (GAP, PYR) in order to activate the subsequent steps. As a result, an oscillatory behaviour is induced which is typical of proportional feedback control with significant transport delay (Marshall 1979).
The reduction and eventual removal of the oscillations moving from case A to C is analogous to the control systems technique of cascade control (Seborg et al. 1989, ch. 18). Cascade control is used in corresponding chemical process control systems, in which there are a number of stages (and corresponding delays) between the point at which demands are made and where the control signal is applied. Cascade control consists of introducing additional inner negative feedback loops to intermediate stages, just as occurs in cases B and C. The concept of simultaneous activation of reactions is very well known in biological systems. We see here that it applies to EM with a striking similarity to cascade control and it potentially provides a new way to assess how oscillations might develop (or be surpressed) in EM.
A thorough analysis of oscillatory behaviour in glycolysis (without OP) can be found in Termonia & Ross (1981) and Heinrich & Schuster (1996) or, more recently, Chandra et al. (2009). In these studies, the oscillatory behaviour is usually explained through a mix of autocatalysis (the pathway uses energy to produce more energy) and feedback (high-energy state inhibits the pathway). In this study, we do account for the autocatalytic nature of the pathway: the first two steps (vHK, vPFK) consume energy and the last two (vPK, vOP) produce more energy. However, the high ‘gain’ in energy production by vOP completely changes the nature of the system, when compared with glycolysis alone. In processing one molecule of GLC, glycolysis uses 2 ATP in the first steps to produce 4 ATP in the end, while OP will yield 30 molecules of ATP per molecule of GLC (i.e. the gain is ≈15 times higher). This higher gain in the last step (vOP) exacerbates the importance of the delay and thus hints at an alternative explanation—proportional control with delay—for the appearance of oscillations in EM.
However, an important observation here is that glycolytic oscillations are usually not observed in aerobic conditions in yeasts (a eukaryote). As reviewed in Richard (2003), anaerobic conditions must usually be imposed to induce glycolytic oscillations. Interestingly, our framework is completely coherent with this observation. If we model a system with proper mitochondrial regulation, as in case C (representative of aerobic conditions in eukaryotes), we do not observe oscillations. In this situation, the reactions of OP are enclosed in the mitochondria, whose overall activity is known to be regulated by the ATP/ADP ratio (Heldt et al. 1972). In our control framework, proportional feedback is introduced around the OP process, thus the delay before ATP production is reduced and oscillations are completely removed (red lines in figure 3). Simulations (not presented here) also show that this ‘eukaryotic’ aerobic system (case C) is extremely robust under a wide range of stimulations, as it can sustain 5- to 10-fold increases in energy demand without entering unstable regimes.
As our modelling and control framework can give some physiological insights on the development or removal of oscillations in EM, it could be used to complement previous studies on this problem. The possible advantage of the oscillatory behaviour in glycolysis was mentioned by Selkov (1980) and Richter & Ross (1981). A study by Chandra et al. (2009) also mentions that glycolysis might operate near oscillatory regimes for performance and trade-off reasons. However, oscillations are not necessary or even detrimental to certain tissues, such as the heart (O'Rourke et al. 1994), and this shows that mechanisms that remove or create oscillations also have an important role.
Finally, a steady-state offset in ATP is observed in cases A–C. This is also observed in proportional control and cannot be removed by cascade action. Such controllers will always have some error between the demanded output value and the actual value. Interestingly, as a change in metabolites (here ATP, ADP) is required to have a change in flux, the proportional control analogy is coherent with the metabolic control analysis (MCA) framework (Fell 1997; Kacser & Burns 1973), where elasticity coefficients are a measure of the change in flux after a change in metabolite. However, MCA was initially developed as a steady-state analysis and thus it would not necessarily differentiate between the three cases presented in A–C, as the different systems could reach the same steady state, but through different time courses. Nevertheless, the analogy with MCA is insightful, as the elasticity coefficients in the MCA framework would give a local linearization of the proportional gains in our framework. Extensions to the MCA framework that account for transient states (Heinrich & Reder 1991) could also be considered for comparison with the control framework presented here.
3.4. Derivative action through temporary energy buffers
Derivative control action is used in control theory to help reduce oscillatory behaviour (Seborg et al. 1989, ch. 8). By including a control action that is proportional to the derivative of the output, the control action has some predictive compensation for rapid changes in the output variable. In the case of EM, the addition of the PCr buffer (case D) smooths the transition after a sharp increase in energy demand (when compared with case C). As can be seen for case D in figure 2 (grey lines), this action removes undershoot in ATP (observed in case C). This effect, which is the desired result of derivative action, is discussed in more detail here.
First, we consider the stoichiometry of the conversion between PCr and Cr:
| 3.1 |
The conversion of one molecule of PCr to Cr allows the regeneration of one molecule of ATP from ADP without contribution from other cellular subsystems. Obviously, this action is limited by the amount of available PCr, hence its role is to act as a temporary energy buffer. Conversely, the PCr can be replenished if the energetic state (ATP/ADP) is favourable. The conversion of PCr to Cr is catalysed by the enzyme creatine kinase (vCK). The regulation of this enzyme's activity can be described by mass action kinetics
| 3.2 |
The reaction is reversible and reaches equilibrium when the ATP/ADP ratio is constant. As PCr and Cr are not involved in other reactions, they only respond to changes in ATP/ADP. When the ATP/ADP ratio is perturbed by a sudden increase in energy demand, the PCr/Cr equilibrium will be changed. Specifically, it is possible to derive the action from vCK when ATP changes over time. If we assume that a certain amount, ‘d’ of ATP is consumed within a time interval (Δt), we can re-write the expression for vCK accordingly
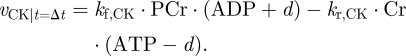 |
3.3 |
Here we neglect the fact that a very small amount of AMP will also be formed, as it is ≈100 times lower than the amount of ATP. It is thus possible to separate the vCK reaction in two terms. The first depends on the states and reaction constants (PCr, ATP, kf,CK …) and the second depends also on the derivative (d) that was imposed
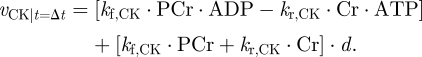 |
3.4 |
As can be seen from equation (3.3), the term with the derivative will be positive, that is, a decrease in ATP will inevitably lead to ATP regeneration by the vCK reaction. This action is potentially nonlinear, as the dynamics of the first term on the right-hand side is not necessarily negligible. Simulation results for this system, with comparison to a system without PCr, are presented in figure 4.
Figure 4.

Derivative action from the PCr buffer. States and reactions are per cent of steady-state values, except for vCK (mM unit time). Black lines, case C; grey lines, case D.
As can be seen, the effect of vCK leads to energy production at a rate proportional to the derivative of ATP (grey lines in figure 4). The effect is almost linear over a change of 100 per cent in ATP demand. However, it must be mentioned here that this linearity is highly dependent on the parameters of the creatine kinase system (simulation results not shown). However, under reasonable hypotheses, we see that the effect can show similarities with derivative control.
Interestingly, phosphagens for transient energy storage are found mostly in cells and tissue that have the ability to produce mechanical work, that is, cells that use flagella for propulsion, animal muscle tissues, insect tissues etc. This observation obviously hints at a possible action for phosphagens in the transition from low- to high-energy demand. Here we show that this effect could be, under certain conditions, similar to a derivative control component. As mentioned earlier, this is not incompatible with the role of PCr as a spatial buffer, when PCr and Cr can be spatially organized or compartmentalized to shuttle energy from the mitochondria to the site of energy consumption (Bessman & Geiger 1981). In the simulation of figure 4, where a 100 per cent change in ATP demand was imposed, the PCr concentration was reduced by only 3 mM (simulation not shown), whereas muscle tissues often contain PCr at concentrations up to 35–40 mM. Thus, there is potentially enough PCr in muscle to perform both actions (spatial and temporal buffer).
Finally, in some tissues, the change in energy demand can be up to 50-fold (Liguzinski & Korzniewski 2006), and this would require a high buffering capacity from PCr. However, cells and tissues have other mechanisms to reduce the changes in ATP.
3.5. Integral feedback in energy metabolism: the forgotten side reaction
Glycolysis is usually presented as a linear pathway with nine reactions. However, this representation neglects a very important side reaction, the PFK2 (vPFK2 in figures 1 and 5). This reaction allows the accumulation of F26P, one of the strongest activators of glycolysis (it activates vPFK). F26P and its accumulation through the PFK2 reaction is an important regulation mechanism for the glycolytic flux (Pilkis 1990). The enzyme catalysing the vPFK2 reaction is bi-functional and can catalyse the reverse reaction (F26P to F6P; figure 1). As we will show here, this side reaction with the accumulation of an activator produces, under certain conditions, an integral feedback action on EM. And it is the integral action that can remove steady-state offset and provide perfect adaptation.
Figure 5.

Integral action in EM. States and reaction rates are per cent of steady-state values. Black lines, vPFK = 0; grey lines, vPFK ∝ AMP.
First, during an energy stress, the AK equilibrium (figure 1 and electronic supplementary material) produces AMP proportionally to the reduction in ATP concentration from the steady state (i.e. a few per cent drop in ATP can lead to a several fold increase in AMP). Thus, AMP is proportional to the ‘error’ in ATP (i.e. the difference from the steady state)
| 3.5 |
AMP then activates the AMP-dependent protein kinase (AMPK), which in turn activates vPFK2 (Hardie 2004). In this study, we assume the dynamics of AMPK can be neglected, and so we draw a direct relationship between AMP and vPFK2. This simply assumes a fast equilibrium between AMPK phosphorylation state and AMP concentration. Thus, vPFK2 is proportional to AMP, and the accumulation of F26P will be described as follows:
| 3.6 |
Thus, the amount of F26P present in the system will be proportional to the integral of AMP, that is, the integral of the error on ATP. As F26P activates a key step of glycolysis (vPFK), we can draw the following relationship:
| 3.7 |
And the integral feedback action of F26P thus becomes obvious. A similar identification of integral control (with its concomitant ability for perfect adaptation) has been made previously for other biological systems, with some examples found in Csete & Doyle (2002) or El-Samad et al. (2002).
Figure 5 shows simulation results in EM with and without the integral control mechanism (expanded from cases E and D in figure 2). As can be seen in figure 5, F26P can indeed be accumulated during energetic stress to activate glycolysis and produce homeostatic behaviour (see grey line for ATP in figure 5). The accumulation of F26P allows EM to be maintained in an active state, even though the ATP level is back to its original state, something that is technically impossible with enzyme regulation alone (see cases A–D). As was mentioned in a review by Okar et al. (2001), the PFK2 enzyme and action of F26P are found in all eukaryotes (but not in prokaryotes) and their roles in adaptation and homeostasis under changing external conditions are acknowledged. Interestingly, this mechanism would provide eukaryotes with a definite advantage over prokaryotes for the precise regulation of the glycolytic flux under varying energy loads.
Integral action is essential when perfect adaptation (e.g. zero steady-state error) is required. However, as can be seen in figure 5, the effect of integral action on vPFK can be destabilizing, as a small, damped oscillation is easily induced. Depending on the specific parameters of the system, the integral effect can also lead to unstable behaviour (simulations not shown). This is primarily because integral action depends upon the sum of past information, thus introducing a destabilizing effect. In addition, and as was the case for proportional control, the integral action is performed on the upstream part of glycolysis, and because delays are unavoidable before the activation of vOP and energy production, there is a further tendency for it to destabilize the loop.
In addition to giving perfect adaptation, there is another reason why it is advantageous to have the integral action on PFK. The ‘pace-making’ role of PFK in glycolysis is well known (Westerhoff 1995) and observations within the MCA framework also show that the enzyme PFK is highly coupled to energy demand (Thomas & Fell 1998). Thus, under various conditions, PFK controls the amount of substrate that enters the glycolytic system. Having integral action on this enzyme provides again an undisputable advantage, as it is the enzyme that has to be maintained in its active state during high demand periods.
Finally, it must be noted that many cellular stress signals affect AMPK and thus potentially affect vPFK2 and F26P dynamics. As regards energy stresses, it is known that F26P accumulation can occur because of hormonal regulation during exercise (Winder & Duan 1992). As mentioned by Holloszy (2008), AMPK is involved in short-term, biochemical adaptation (such as modelled here), but it is also involved in long-term adaptation to energy stresses (i.e. increased GLC transport capacity and increased mitochondrial biogenesis). Thus, although we concentrate our study here on only one possible role for F26P in biochemical regulation, with only one activation mechanism (i.e. AMPK signalling because of high AMP), it must be kept in mind that the integration of energetic stresses is much more broad and not yet fully understood (Hardie 2007). However, this complexity in cellular signals is also an argument for a rigorous, dynamic systems analysis, and the control framework presented here could be used to that end.
3.6. Feed-forward control: astrocyte–neuron coordination
The brain is probably the most complex tissue in the animal kingdom, and precise functioning and regulation of EM in the cerebral tissue is an area of research where many questions are yet to be answered. One of these questions regards the possible release of LAC by astrocytes to fuel EM in neurons. Since the astrocyte–neuron lactate shuttle (ANLS) hypothesis was put forward 15 years ago (Pellerin & Magistretti 1994), many studies have been performed, but with mixed results. For example, it was shown that cultured neurons can use LAC to fuel OP (Dringen et al. 1993) and, as mentioned earlier, it is also known that LAC can regulate ATP concentration in neurons (Ainscow et al. 2002). However, other studies and reviews raise doubt about the exact role of LAC in brain EM (Chih et al. 2001; Fillenz 2005), as neurons also use GLC to fuel their energy needs.
An important factor to consider in the role of LAC is the presence of glial cells (astrocytes) in the cerebral tissue. As part of the ANLS hypothesis, astrocytes are activated in coordination with neurons as excess neurotransmitters released by neurons during high-activity periods are taken up by glial cells. In order to perform this task, astrocytes need energy and they consequently undergo an increase in glycolytic rate and produce LAC. Measurements in the cerebral interstitial fluid during high-activity periods show a small initial dip (≈5%) in LAC concentration, followed by a significant increase (greater than 50%; Hu & Wilson 1997; Lowry & O'Neill 2006). This implies a possible mechanism where LAC is being consumed by neurons and produced by astrocytes at a higher rate but after an initial delay.
The presence of a secondary cell system (astrocytes) that produces energy substrate for the main functional system (neurons) is analogous to the feed-forward control action used in engineering control systems (Seborg et al. 1989, ch. 17). The aim of feed-forward control is to give an early and rapid response to a fast change in demand in a way that cannot be met by integral feedback action that must pass through a number of intermediate states. Thus, in the brain, EM information on the ‘disturbance’ in energy demand (i.e. increase in neurotransmitter circulation) is forwarded to astrocytes, which respond by producing LAC. The higher LAC concentration then favours uptake and oxidation in neurons and improves ATP regulation. This mechanism does not require any feedback action within neuronal metabolism (i.e. LAC will increase regardless of ATP levels in neurons), hence the feed-forward analogy. In classical control, this type of controller can be finely tuned to reject disturbances on the system. Again, analogies are also found in the systems biology literature, as this mechanism can be compared with the perfect adaptation system presented in Tyson et al. (2003).
Simulation results with this feed-forward LAC mechanism and a comparison to integral feedback are presented in figure 6. Two successive and short pulses in energy demand were implemented. The change in energy demand here is relatively small (25%) as it is reported that the basal metabolic rate in neurons is relatively important (i.e. as much as 90% of the active rate). In a previous study (Cloutier et al. in press), we observed that, during physiological stimulations, a maximum of 20–25% increase in energy demand could be observed. The input used in figure 6 thus allows an assessment of the capacity of the two control mechanisms (integral: blue lines; feed-forward: green lines) to adapt to repetitive bursts in activity, a control problem faced by neurons that must rapidly switch between the resting state and stimulation. Also note that our simulation qualitatively reproduces the LAC profiles mentioned previously, with a small initial dip followed by an overshoot.
Figure 6.

Comparison of integral feedback (blue lines) and feed-forward (green lines) for rapid transitions in energy demand. States and reaction rates are per cent of steady-state values.
As seen from the right-hand column of figure 6, the feed-forward mechanism with LAC production by an external system significantly improves the energy regulation. The changes in ATP are not large (less than 5%) in both the integral (blue lines) and feed-forward cases (green lines). However, the feed-forward scheme still reduces the ATP variations threefold (as compared with integral action) and produces a more stable behaviour. From a control theoretic viewpoint, this is to be expected, because the major problem of integral control is that it is slow to respond to changes in demand on the system, as the whole glycolytic pathway must be activated during stimulation and de-activated after the stimulus is removed. In control terminology, the integrators ‘wind up’ to compensate for a demand and then take time to ‘un-wind’ after the event (Seborg et al. 1989, ch. 8). Even though we have used a simplified, shorter pathway to describe glycolysis, it is always slower than the direct feeding of vOP with a sharp increase in LAC concentration (green lines for vOP and LAC in figure 6).
The superior performance of a feed-forward strategy occurs because it has no memory of the past and therefore responds instantaneously to demands—a very important feature in neuronal energy regulation. This point raises questions about the relevance of integral feedback in neuronal EM. As can be seen, the use of integral feedback would potentially be destabilizing for neurons submitted to short bursts in energy demand—the slow recovery of integral action would also introduce the potential of energy stress within the brain EM. It is therefore interesting to note that neuronal cells are the only eukaryotic cells reported to have no PFK2 activity (Bolanos et al. 2004; Rider et al. 2004). Thus, they would be the only cells in animal tissues not to rely on the integral action of F26P in their EM structure. As we can see from the control perspective, a neuronal EM structure where the integral action is replaced by a well-tuned feed-forward pathway would indeed improve ATP regulation.
Finally, the performance of this feed-forward system also depends on the specific parameters used in the modelling. Here, the modelling is a simplified version of a model for the brain EM, and it reproduces LAC profiles measured during sensory stimulations (see Cloutier et al. in press for further details). From this increase in LAC shuttling, the OP regulation can produce a fast and practically perfect adaptation of ATP levels in neurons. Thus, it seems that the reported LAC kinetics in the cerebral tissue do hint at a well-adapted feed-forward mechanism.
4. Conclusion
4.1. Control structure of energy metabolism
The main result of this study is a delineation of the metabolic regulation of EM in terms of basic control systems concepts. This was achieved through a dynamic analysis of energy regulation using a generic model for EM. As the model was built upon reported mechanisms in EM, our analysis allows a systems understanding of the problem of energy regulation in biological systems. Interestingly, strong evidence was found for the use within EM of the most widely used forms of control components (proportional, derivative, integral) and control structures (feedback, feed-forward and cascade control). These mechanisms and structures are summarized in figure 7, where the correspondence between control mechanisms and structures and their biophysical equivalents (text in grey) is shown.
Figure 7.

Mechanisms and control structures for EM. (a) Case ‘A’ is a general structure for a system (S), with input (u) managed by a controller (C). (b) Case ‘B’ shows cascade control (CC) to speed up the response. (c) Case ‘C’ shows feed-forward control (CFF) where a change in the load is used directly for fast regulation. Biological mechanisms are shown in grey.
Similar analogies between biological regulation and classical control have been reported in other studies, but, to the best of our knowledge, this is the first extensive study of such basic mechanisms and structures in EM. Within this framework, it was observed that cells with specific requirements for EM regulation will rely on the appropriate control structure to reduce ATP variations. This observation even holds for the regulation of energy in the brain, where two cell types (neurons and astrocytes) will cooperate through a tuned feed-forward mechanism in order to reduce ATP variations in the cells that have to perform a critical function.
Comparisons with experimental works and theoretical frameworks (such as MCA) also showed that a dynamic control analysis is totally coherent with the current knowledge on biological regulation. In this regard, our framework was able to reproduce the most common systems properties observed in EM, such as oscillations and homeostasis. Our approach thus offers added insight into, and a reappraisal of, known mechanisms for energy regulation.
4.2. Final comments
This study was focused on EM as a means of drawing analogies between biological mechanisms and control. In this spirit, the results obtained here cover the most common control components (PID) and structures (feedback, feed-forward and cascade control). These components and structures are fundamental to all dynamical control, such that the control framework presented here could eventually be extrapolated to other biological reaction systems. In this spirit, the proper classification of biological mechanisms in terms of corresponding control components and structures should help increase the appreciation of the role of the control theory in biological systems. For example, the basic controller components—proportional, derivative and integral—have quite specific control functions and corresponding advantages and limitations in their use. The ability to identify biological objects that perform these functions can therefore help us understand the capabilities and constraints of a biological system—just as it does in the analysis of physical systems.
We also re-emphasize that our description has been specifically aimed at describing the core control mechanisms and structures in EM. The description given here can be built upon to add additional substrates, reactions and more complex interactions. Such additions will modify the performance of the resulting control system, but the function of the core PID mechanisms and feedback/feed-forward structures will not be altered. We see therefore the control blocks and structures described here as offering the core framework for understanding the dynamic regulation of metabolism in general terms; a framework to which further additional control functions can be added.
The idea of comparing the dynamic regulation requirements of a biological system with potential control components could also be used to classify and analyse regulation mechanisms within a more rigorous framework. For example, cascade control is an expression of the more general control concept of state feedback. We therefore anticipate that within a control theoretic framework it will be possible to produce a systematic analysis using tools from control engineering, such as stability analysis, robustness etc., including a full consideration of the nonlinear nature of metabolic feedback that we (for simplicity) have avoided in this study. For a wider discussion of these issues and the potential role of control and feedback in biology, see Wellstead et al. (2008).
Acknowledgements
The authors wish to thank the anonymous reviewers for their insightful suggestions and references, and Rick Middleton for his additional insights on the control mechanisms described in this work. Financial support from the Science Foundation of Ireland (03/RP1/I382) is gratefully acknowledged.
References
- Ainscow E. K., Mirshamsi S., Tang T., Ashford M. L. J., Rutter G. A. 2002. Dynamic imaging of free cytosolic ATP concentration during fuel sensing by rat hypothalamic neurones: evidence for ATP-independent control of ATP-sensitive K+ channels. J. Physiol. 544, 429–445. ( 10.1113/jphysiol.2002.022434) [DOI] [PMC free article] [PubMed] [Google Scholar]
- Atherton D. P. 1982. Nonlinear control engineering. New York, NY: Van Nostrand Reinhold. [Google Scholar]
- Aubert A., Costalat R. 2005. Interactions between astrocytes and neurons studied using a mathematical model of compartimentalized energy metabolism. J. Cereb. Blood Flow Metab. 25, 1476–1490. ( 10.1038/sj.jcbfm.9600144) [DOI] [PubMed] [Google Scholar]
- Bali M., Thomas S. R. 2001. A modelling study of feedforward activation in human erythrocyte glycolysis. C. R. Acad. Sci. III 324, 185–199. [DOI] [PubMed] [Google Scholar]
- Bessman S., Geiger P. 1981. Transport of energy in muscle: the phosphocreatine shuttle. Science 211, 448–452. ( 10.1126/science.6450446) [DOI] [PubMed] [Google Scholar]
- Bolanos J. P., Cidad P., Garcia-Nogales P., Delgado-Esteban M., Fernandez E., Almeida A. 2004. Regulation of glucose metabolism by nitrosative stress in neural cells. Mol. Aspects Med. 25, 61–73. ( 10.1016/j.mam.2004.02.009) [DOI] [PubMed] [Google Scholar]
- Buttgereit F., Burmester G. R., Brand M. D. 2000. Bioenergetics of immune functions: fundamental and therapeutic aspects. Immunol. Today 21, 192–199. [DOI] [PubMed] [Google Scholar]
- Carew J. S., Huang P. 2002. Mitochondrial defects in cancer. Mol. Cancer 1, 9–14. ( 10.1186/1476-4598-1-9) [DOI] [PMC free article] [PubMed] [Google Scholar]
- Chance B., Gosh A. 1964. Oscillations of glycolytic intermediates in yeast cells. Biochem. Biophys. Res. Commun. 16, 174–181. [DOI] [PubMed] [Google Scholar]
- Chandra F. A., Buzi G., Doyle J. C. 2009. Linear control analysis of the autocatalytic glycolysis system. In Proc. of the American Control Conf., pp. 319–324. St Louis, MO: American Automatic Control Council. [Google Scholar]
- Chassagnole C., Noisommit-Rizzi N., Schmid J. W., Mauch K., Reuss M. 2002. Dynamic modeling of the central carbon metabolism of Escherichia coli. Biotechnol. Bioeng. 79, 53–73. ( 10.1002/bit.10288) [DOI] [PubMed] [Google Scholar]
- Chih C.-P., Lipton P., Roberts E. L. 2001. Do active cerebral neurons really use lactate rather than glucose? Trends Neurosci. 24, 573–578. ( 10.1016/S0166-2236(00)01920-2) [DOI] [PubMed] [Google Scholar]
- Cloutier M., Bolger F. B., Lowry J. P., Wellstead P. In press An integrative dynamic model of brain energy metabolism using in vivo neurochemical measurements. J. Comput. Neurosci. ( 10.1007/s10827-009-0152-8) [DOI] [PubMed] [Google Scholar]
- Csete M. E., Doyle J. 2002. Reverse engineering of biological complexity. Science 295, 1664–1669. ( 10.1126/science.1069981) [DOI] [PubMed] [Google Scholar]
- Dringen R., Wiesinger H., Hamprecht B. 1993. Uptake of lactate by cultured rat brain neurons. Neurosci. Lett. 163, 5–7. ( 10.1016/0304-3940(93)90215-7) [DOI] [PubMed] [Google Scholar]
- El-Samad H., Goff J. P., Khammash M. 2002. Calcium homeostasis and parturient hypocalcemia: an integral feedback perspective. J. Theor. Biol. 214, 17–29. ( 10.1006/jtbi.2001.2422) [DOI] [PubMed] [Google Scholar]
- Fell D. 1997. Understanding the control of metabolism, 1st edn London, UK: Portland Press. [Google Scholar]
- Fillenz M. 2005. The role of lactate in brain metabolism. Neurochem. Int. 47, 413–417. ( 10.1016/j.neuint.2005.05.011) [DOI] [PubMed] [Google Scholar]
- Hardie D. G. 2004. The AMP activated protein kinase: new players upstream and downstream. J. Cell Sci. 117, 5479–5487. ( 10.1242/jcs.01540) [DOI] [PubMed] [Google Scholar]
- Hardie D. G. 2007. AMP-activated/SNF1 protein kinases: conserved guardians of cellular energy. Nat. Rev. Mol. Cell Biol. 8, 774–785. ( 10.1038/nrm2249) [DOI] [PubMed] [Google Scholar]
- Hardie D. G. 2008. Role of AMP-activated protein kinase in the metabolic syndrome and in heart disease. FEBS Lett. 582, 81–90. ( 10.1016/j.febslet.2007.11.018) [DOI] [PubMed] [Google Scholar]
- Heinrich R., Reder C. 1991. Metabolic control analysis of relaxation processes. J. Theor. Biol. 151, 343–350. ( 10.1016/S0022-5193(05)80383-2) [DOI] [Google Scholar]
- Heinrich R., Schuster S. 1996. The regulation of cellular systems, 1st edn New York, NY: ITP Chapman & Hall. [Google Scholar]
- Heldt H. W., Klingenberg M., Milovancev M. 1972. Differences between the ATP/ADP ratios in the mitochondrial matrix and in the extramitochondrial space. Eur. J. Biochem. 30, 434–440. ( 10.1111/j.1432-1033.1972.tb02115.x) [DOI] [PubMed] [Google Scholar]
- Hochachka P., McClelland G. 1997. Cellular metabolic homeostasis during large-scale change in ATP turnover rates in muscles. J. Exp. Biol. 200, 381–386. [DOI] [PubMed] [Google Scholar]
- Holloszy J. O. 2008. Regulation by exercise of skeletal muscle content of mitochondria and GLUT4. J. Physiol. Pharmacol. 59, 5–18. [PubMed] [Google Scholar]
- Holzhütter H. G. 2004. The principle of flux minimization and its application to estimate stationary fluxes in metabolic networks. Eur. J. Biochem. 271, 2905–2922. ( 10.1111/j.1432-1033.2004.04213.x) [DOI] [PubMed] [Google Scholar]
- Hu Y., Wilson G. S. 1997. A temporal local energy pool coupled to neuronal activity: fluctuations of extracellular lactate levels in rat brain monitored with rapid-response enzyme-based sensor. J. Neurochem. 69, 1484–1490. [DOI] [PubMed] [Google Scholar]
- Kacser H., Burns J. A. 1973. The control of flux. Symp. Soc. Exp. Biol. 27, 65–104. [PubMed] [Google Scholar]
- Kensara O. A., Wooton S. A., Phillips D. I. W., Patel M., Hoffman D. J., Jackson A. A., Elia M.Hertfordshire Study Group. 2006. Substrate-energy metabolism and metabolic risk factors for cardiovascular disease in relation to fetal growth and adult body composition. Am. J. Physiol. Endocrinol. Metab. 291, E365–E371. ( 10.1152/ajpendo.00599.2005) [DOI] [PubMed] [Google Scholar]
- Korzeniewski B., Zoladz J. A. 2001. A model of oxidative phosphorylation in mammalian skeletal muscle. Biophys. Chem. 92, 17–34. ( 10.1016/S0301-4622(01)00184-3) [DOI] [PubMed] [Google Scholar]
- Lambeth M. J., Kushmerick M. J. 2002. A computational model for glycogenolysis in skeletal muscle. Ann. Biomed. Eng. 30, 808–827. ( 10.1114/1.1492813) [DOI] [PubMed] [Google Scholar]
- Liguzinski P., Korzeniewski B. 2006. Metabolic control over the oxygen consumption flux in intact skeletal muscle: in silico studies. Am. J. Physiol. Cell Physiol. 291, C1213–C1224. ( 10.1152/ajpcell.00078.2006) [DOI] [PubMed] [Google Scholar]
- Lotharius J., Brundin P. 2002. Pathogenesis of Parkinson's disease: dopamine, vesicles and α-synuclein. Nat. Rev. Neurosci. 3, 932–942. ( 10.1038/nrn983) [DOI] [PubMed] [Google Scholar]
- Lowry J. P., O'Neill R. D. 2006. Neuroanalytical chemistry in vivo using electrochemical sensors. In Encyclopedia of sensors (eds Grimes C. A., Dickey E. C., Pishko M. V.), pp. 501–524. Los Angeles, CA: American Scientific Publishers. [Google Scholar]
- Mangan S., Alon U. 2003. Structure and function of the feedforward loop network motif. Proc. Natl Acad. Sci. USA 100, 11 980–11 985. ( 10.1073/pnas.2133841100) [DOI] [PMC free article] [PubMed] [Google Scholar]
- Marshall J. E. 1979. Control of time delay systems, 1st edn New York, NY: Peter Peregrinus. [Google Scholar]
- Okar D. A., Manzano A., Navato-Sabate A., Riera L., Bartrons R., Lange A. J. 2001. PFK-2/FBPase-2: maker and breaker of the essential biofactor fructose-2,6-bisphosphate. Trends Biochem. Sci. 26, 30–35. ( 10.1016/S0968-0004(00)01699-6) [DOI] [PubMed] [Google Scholar]
- O'Rourke B., Ramza B., Marban E. 1994. Oscillations of membrane current and excitability driven by metabolic oscillations in heart cells. Science 265, 962–966. ( 10.1126/science.8052856) [DOI] [PubMed] [Google Scholar]
- Parihar M. S., Brewer G. J. 2007. Mitoenergetic failure in Alzheimer disease. Am. J. Physiol. Cell Physiol. 292, 8–23. ( 10.1152/ajpcell.00232.2006) [DOI] [PubMed] [Google Scholar]
- Pedersen P. L. 2007. Warburg, me and hexokinase 2: multiple discoveries of key molecular events underlying one of cancers’ most common phenotypes, the ‘Warburg Effect’, i.e. elevated glycolysis in the presence of oxygen. J. Bioenerg. Biomemb. 39, 211–222. ( 10.1007/s10863-007-9094-x) [DOI] [PubMed] [Google Scholar]
- Pellerin L., Magistretti P. J. 1994. Glutamate uptake into astrocytes stimulates aerobic glycolysis: a mechanism coupling neuronal activity to glucose utilization. Proc. Natl Acad. Sci. USA 91, 10625–10629. ( 10.1073/pnas.91.22.10625) [DOI] [PMC free article] [PubMed] [Google Scholar]
- Pilkis S. J. 1990. Fructose-2,6-bisphosphate: the unique sugar diphosphate, 1st edn Boca Raton, FL: CRC Press. [Google Scholar]
- Richard P. 2003. The rhythm of yeast. FEMS Microbiol. Rev. 27, 547–557. ( 10.1016/S0168-6445(03)00065-2) [DOI] [PubMed] [Google Scholar]
- Richter P. E., Ross J. 1981. Concentration oscillations and efficiency: glycolysis. Science 211, 715–717. ( 10.1126/science.6450447) [DOI] [PubMed] [Google Scholar]
- Rider M. H., Bertrand L., Vertommen D., Michels P. A., Rousseau G. G., Hue L. 2004. 6-Phosphofructo-2-kinase/fructose-2,6-bisphosphatase: head-to-head with a bifunctional enzyme that controls glycolysis. Biochem. J. 381, 561–579. [DOI] [PMC free article] [PubMed] [Google Scholar]
- Schmidt H., Jirstrand M. 2006. Systems Biology Toolbox for MATLAB: a computational platform for research in systems biology. Bioinformatics 22, 514–515. ( 10.1093/bioinformatics/bti799) [DOI] [PubMed] [Google Scholar]
- Schurr A. 2006. Lactate: the ultimate cerebral oxidative energy substrate? J. Cereb. Blood Flow Metab. 26, 142–152. ( 10.1038/sj.jcbfm.9600174) [DOI] [PubMed] [Google Scholar]
- Seborg D. E., Edgar T. F., Mellichamp D. A. 1989. Process dynamics and control, 1st edn New York, NY: Wiley. [Google Scholar]
- Selkov E. E. 1980. Instability and self-oscillations in the cell energy metabolism. Ber. Bunsenges. Phys. Chem. 84, 399–402. [Google Scholar]
- Seyfried T. N., Mukherjee P. 2005. Targeting energy metabolism in brain cancer: review and hypothesis. Nutr. Metab. 2, 30–39. ( 10.1186/1743-7075-2-30) [DOI] [PMC free article] [PubMed] [Google Scholar]
- Termonia Y., Ross J. 1981. Oscillations and control features in glycolysis: numerical analysis of a comprehensive model. Proc. Natl Acad. Sci. USA 78, 2952–2956. ( 10.1073/pnas.78.5.2952) [DOI] [PMC free article] [PubMed] [Google Scholar]
- Thomas S., Fell D. 1998. A control analysis exploration of the role of ATP utilisation in glycolytic-flux control and glycolytic-metabolite-concentration regulation. Eur. J. Biochem. 258, 956–967. ( 10.1046/j.1432-1327.1998.2580956.x) [DOI] [PubMed] [Google Scholar]
- Tyson J. J., Chen K. C., Novak B. 2003. Sniffers, buzzers, toggles and blinkers: dynamics of regulatory and signalling pathways in the cell. Curr. Opin. Cell Biol. 15, 221–231. ( 10.1016/S0955-0674(03)00017-6) [DOI] [PubMed] [Google Scholar]
- Voet D. J., Voet J. G. 2005. Biochemistry, 3rd edn New York, NY: Wiley. [Google Scholar]
- Wellstead P., Bullinger E., Kalamatianos D., Mason O., Verwoerd M. 2008. The role of control and systems theory in systems biology. Annu. Rev. Control 32, 33–47. ( 10.1016/j.arcontrol.2008.02.001) [DOI] [Google Scholar]
- Westerhoff H. 1995. Subtlety in control—metabolic pathway engineering. Trends Biotechnol. 13, 242–244. ( 10.1016/S0167-7799(00)88955-6) [DOI] [PubMed] [Google Scholar]
- Winder W. W., Duan C. 1992. Control of fructose 2,6-diphosphate in muscle of exercising fasted rats. Am. J. Physiol. Endocrinol. Metab. 262, E919–E924. [DOI] [PubMed] [Google Scholar]
- Yi T., Huang Y., Melvin S. I., Doyle J. 2000. Robust perfect adaptation in bacterial chemotaxis through integral feedback control. Proc. Natl Acad. Sci. USA 97, 4649–4653. ( 10.1073/pnas.97.9.4649) [DOI] [PMC free article] [PubMed] [Google Scholar]