Abstract
Hsp90 and tubulin are among the most abundant proteins in the cytosol of eukaryotic cells. Although Hsp90 plays key roles in maintaining its client proteins in their active state, tubulin is essential for fundamental processes such as cell morphogenesis and division. Several studies have suggested a possible connection between Hsp90 and the microtubule cytoskeleton. Because tubulin is a labile protein in its soluble form, we investigated whether Hsp90 protects it against thermal denaturation. Both proteins were purified from porcine brain, and their interaction was characterized in vitro by using spectrophotometry, sedimentation assays, video-enhanced differential interference contrast light microscopy, and native polyacrylamide gel electrophoresis. Our results show that Hsp90 protects tubulin against thermal denaturation and keeps it in a state compatible with microtubule polymerization. We demonstrate that Hsp90 cannot resolve tubulin aggregates but that it likely binds early unfolding intermediates, preventing their aggregation. Protection was maximal at a stoichiometry of two molecules of Hsp90 for one of tubulin. This protection does not require ATP binding and hydrolysis by Hsp90, but it is counteracted by geldanamycin, a specific inhibitor of Hsp90.
Keywords: Chaperone Chaperonin, Microtubules, Protein Denaturation, Protein Folding, Tubulin, Hsp90
Introduction
Chaperones are essential for cell life because of their involvement in the folding of newly synthesized proteins. Among the chaperones, the heat-shock protein of 90 kDa (Hsp90)3 is one of the most abundant and ubiquitously expressed cellular proteins (10–50 μm (1)) with a main function of helping other proteins maintain their conformation in an active state. Several client proteins of Hsp90 involved in cell proliferation and apoptosis (such as protein kinases and transcription factors) have been described (2–5). Although Hsp90 is fundamental for the life of normal cells, it also protects mutated proteins against cellular degradation, thus promoting cancer cell survival (6). Therefore, considerable efforts have been made to find inhibitors of its activity (7, 8).
Over the past decade several studies have suggested a possible relationship between Hsp90 and the microtubule cytoskeleton (9–15). Tubulin is a highly concentrated cellular protein (10–20 μm (16)) and is the building block of microtubules, which are involved in several crucial processes such as cell division and morphogenesis, compartmentalization, and organelle movement. Its fundamental role in the architecture and functioning of the mitotic spindle has also made this protein a classical target of antimitotic drugs. A direct interaction between Hsp90 and tubulin has previously been described (9), but Hsp90 is also known to interact with other chaperones and co-chaperones to perform its function (17–19). Therefore, whether Hsp90 can protect tubulin against denaturation in the absence of other factors remains unknown.
In this study we investigated the direct interaction between tubulin and Hsp90, both purified from porcine brain. Tubulin was subjected to thermal denaturation in the absence and in the presence of Hsp90, and its capacity to assemble into microtubules was analyzed by spectrophotometry, sedimentation assays, video-enhanced differential interference contrast (VE-DIC) light microscopy, and native polyacrylamide gel electrophoresis. We found that Hsp90 protects tubulin against thermal denaturation and maintains it in a state compatible for assembly. Although it is known that Hsp90 uses ATP to perform its functions, we demonstrate that ATP hydrolysis is not required for tubulin chaperoning. This protection is specific because geldanamycin, an Hsp90 inhibitor, counteracts the protective effect of Hsp90 on tubulin.
EXPERIMENTAL PROCEDURES
Protein Purification
The 90-kDa heat shock protein was purified from porcine brain according to Yonezawa et al. (20) modified by Garnier et al. (21). Hsp90 was dialyzed overnight in BRB80 (80 mm K-Pipes, 1 mm MgCl2, 1 mm EGTA, pH 6.8), centrifuged at 65,000 × g for 30 min at 4 °C, flash-frozen in liquid nitrogen, and stored at −80 °C. Protein concentration was determined by UV absorbance using an extinction coefficient of 124,000 m−1 cm−1 at 280 nm in BRB80 buffer assuming that Hsp90 was present as a dimer (22). Absorption was corrected for light scattering using the Beckman DU640B spectrophotometer software.
Tubulin was purified from porcine brains in two steps. The first step involved two cycles of assembly/disassembly according to Ashford et al. (23). After the second polymerization, microtubules were sedimented at 150,000 × g for 30 min at 37 °C. The pellets were resuspended in column buffer (50 mm K-Pipes, 1 mm MgCl2, 1 mm EGTA, 0.2 mm GTP, 1% β-mercaptoethanol, pH 6.8) at 4 °C and centrifuged at 150,000 × g for 30 min at 4 °C. The supernatants were pooled, and microtubule-associated proteins were removed from the preparation using phosphocellulose (Sigma) chromatography (5/20 cm) equilibrated in column buffer (50 mm K-Pipes, 1 mm MgCl2, 1 mm EGTA, 0.2 mm GTP, pH 6.8). Fractions containing tubulin were pooled, and the buffer was converted to BRB80 using conversion buffer (500 mm K-Pipes, 1 mm MgCl2, 1 mm EGTA, pH 6.8). MgCl2 and GTP concentrations were adjusted to 3 and 1 mm, respectively, and glycerol was added to reach a final concentration of 30%. Tubulin was polymerized once more, and the microtubules were sedimented at 220,000 × g on 10 ml of glycerol 60% cushion to remove free nucleotides. Pellets were resuspended at 4 °C in BRB80, and tubulin with GDP bound to its E-site was flash-frozen in liquid nitrogen and stored at −80 °C. Tubulin concentration was determined by UV absorbance using an extinction coefficient of 107,000 m−1 cm−1 at 275 nm in 1% SDS, with the consideration that tubulin is a dimer.
Tubulin Preparation for Polymerization and Incubation Experiments
Tubulin-GDP was resuspended in BRB80 buffer and supplemented with 0.1 mm GTP. The sample was incubated 5 min at 4 °C, permitting exchange of GDP for GTP in the tubulin E-site, and then centrifuged at 32,200 × g for 10 min at 4 °C to remove altered tubulin formed during freezing. The supernatant was taken, and GTP concentration was adjusted to 1 mm for both the polymerization and incubation experiments.
Long Term Tubulin Incubation Assay
This assay was performed with and without Hsp90 at concentrations indicated in the figure legends. Incubation was started by warming the samples to 37 °C; after 200 min, samples were cooled to 4 °C. Tubulin concentrations used are indicated in the figures. The turbidity time course was monitored at 350 nm using a thermostatted UVIKON XS spectrophotometer. Microtubule mass was measured by the variation in absorbance at the depolymerization to subtract nonspecific polymer formation during polymerization (i.e. aggregates) (9).
Sedimentable Tubulin and Absorbance
To correlate absorbance to sedimentable tubulin, tubulin (20.3 μm) was incubated at 37 °C, each 0.2 absorbance unity sample was taken, and the aggregation process was stopped at 4 °C. Samples were centrifuged for 20 min at 24,000 × g at 4 °C, and supernatants were assayed. The difference between initial tubulin concentration and supernatant concentration was interpreted as sedimentable tubulin.
Tubulin Preincubation
Tubulin at a concentration close to the critical concentration (Cr, 18–23 μm) was incubated for the indicated times at 37 °C in the absence or presence of Hsp90. Tubulin activity was then tested by spectrophotometry and optical video light microscopy.
Spectrophotometry
Preincubated samples (60 μl) were centrifuged on a 60-μl cushion (60% glycerol in BRB80, 1 mm GTP) at 24,000 g for 20 min at 4 °C (TL100 centrifuge, Beckman). The supernatants were collected for polymerization in BRB80, 1 mm GTP, 30%glycerol, and the pellets were analyzed on 10% SDS-PAGE gels. Polymerization was initiated by warming the samples to 37 °C, and depolymerization was induced by cooling the samples to 4 °C. The quantity of microtubules assembled is proportional to the variation in absorbance at 350 nm. Microtubule mass was measured by the variation in absorbance at the depolymerization, as previously described.
Video-enhanced Differential Interference Contrast Light Microscopy
Samples were prepared at 4 °C in perfusion chambers made of a slide and a coverslip separated by two strips of double-sided tape (24). Centrosomes purified from KE-37 lymphoblastic human cells (25, 26) were perfused into the chamber at a concentration of 1.8 × 10⁷ centrosomes/ml. Preincubated samples were centrifuged at 24,000 g for 20 min at 4 °C (TL100 centrifuge, Beckman). The surface of the perfusion chamber was saturated by a flow of a large volume of the supernatants containing tubulin alone or in association with Hsp90. The mixture containing tubulin in BRB80 1 mm GTP in the absence or presence of Hsp90 was perfused into the chamber, and microtubule assembly was observed under an Olympus BX51 microscope with its stage, objective, and condenser heated to 37 °C. The microscope was equipped with DIC prisms, an Apochromat 60×/1.4 NA oil immersion objective, an 8-bit black-and-white video camera (Sony, XC-ST70/CE), and an Argus 20 image processor (Hamamatsu). Images were recorded every 2 s for periods of about 3–5 min on a PC using Simple PCI software from Hamamatsu. Microtubule dynamics measurements and data analysis were performed using NIH Image and KaleidaGraph software as described previously (27). The uncertainty on the slopes (tubulin alteration speed) was calculated from the minimal and maximal regressions slopes obtained considering the standard deviations for extreme points. Differences on the slopes between experiments were evaluated using Student's t test.
Hsp90 Specificity and Cofactors
Hsp90 protection specificity was tested with tubulin long term incubation (200 min at 37 °C) under non-polymerization conditions (around the Cr for microtubule self-assembly). Tubulin was incubated in the presence of BSA at the same concentration as Hsp90. Moreover, Hsp90 protection was tested in the presence of GA and of ATP. Experiments were conducted as previously described.
Cross-linking Experiments of the Hsp90-Tubulin Complex
Tubulin (18 μm) was incubated in BRB80 buffer for 5 min at 39 °C in the absence or presence of increasing Hsp90 concentrations (16.5, 33, 49.6, and 66 μm). After incubation, samples were diluted 2-fold in BRB80, 0.1% glutaraldehyde, at room temperature. Samples were run on a 6% native PAGE and blotted onto polyvinyl difluoride membranes. Blots were first stained with Ponceau red solution (0.5% Ponceau red, 1% acetic acid) and probed with mouse anti-α-tubulin monoclonal antibody from Sigma. The primary antibody was detected using horseradish peroxidase-conjugated antibody and an enhanced chemiluminescence assay (ECL, PerkinElmer Life Sciences). After film exposure, relative luminescence intensity was determined using a Bio-Rad imager. Then Ponceau red staining and relative luminescence were aligned and superimposed.
Electrophoresis
PAGE under denaturing conditions (SDS) was carried out using 1.5-mm-thick 8% acrylamide slab gels (28). Gels were run using the Mini-Protean III apparatus from Bio-Rad. PAGE under native conditions was performed on 6% acrylamide slab gels (29).
RESULTS
Characterization of the Thermal Aggregation of Tubulin
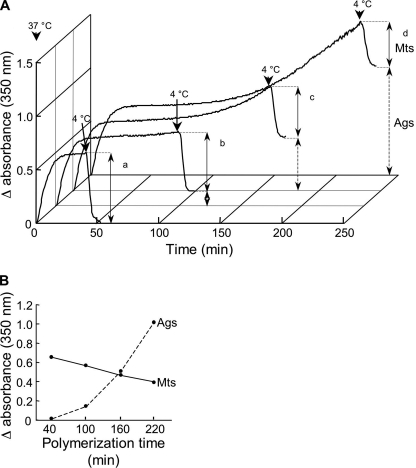
Tubulin of mammalian origin reassembles in vitro into microtubules when incubated at 37 °C in the presence of GTP. The polymerization process can be followed by measuring the variations in absorbance at 350 nm, providing a fair indication of the polymer mass assembled (30). However, because of the fragility of the protein, which rapidly denatures, these polymerization experiments do not usually exceed ∼1 h (31, 32). To determine whether Hsp90 could protect tubulin, we first investigated the optimal conditions for tubulin denaturation. Tubulin at 45 μm was incubated at 37 °C for times ranging from 40 to 220 min and further cooled to 4 °C to assess the presence of products that cannot be depolymerized (Fig. 1A). Incubation of tubulin for 40 min (Fig. 1A, curve a) revealed a classic polymerization curve characterized by a sigmoid assembly phase followed by a plateau at which the polymer mass remained constant. At this state, microtubules are known to alternate between growing and shrinking states as a result of their intrinsic dynamic instability (33). Cooling the sample to 4 °C allowed the turbidimetric trace to return to a value close to its original level, confirming the depolymerization of almost all the species. Increasing the incubation time to 100 min (b), 160 min (c), and 220 min (d) induced a second increase in turbidity, indicating formation of new polymeric species. Cooling of the specimens to 4 °C showed that these new species do not depolymerize and, thus, are likely tubulin aggregates. This process appeared to be time-dependent because the amount of aggregates increased with longer incubation times, whereas the quantity of microtubules decreased concomitantly (Fig. 1B). Regarding the sample polymerized for 220 min, the difference in absorbance attributable to aggregation was 1, which corresponded to 6.3 μm sedimentable tubulin, indicating that around 39 μm tubulin should have been available for polymerization. Thus, considering the tubulin Cr of 20 μm, the quantity of microtubules formed should have been 19 μm instead of 25 μm for the sample incubated 1 h, or a theoretical decrease of 24%, whereas the microtubule decrease observed was 34%.
FIGURE 1.
Characterization of tubulin aggregation. A, tubulin (45 μm) was assembled into microtubules at 37 °C in BRB80 buffer, 1 mm GTP. Depolymerization was induced by cooling the samples to 4 °C after 40 min (a), 100 min (b), 160 min (c), and 220 min (d). The solid and dashed vertical lines with arrowheads indicate the level of microtubule assembly and tubulin aggregation, respectively. B, variation of absorbance at 350 nm due to microtubules (Mts) and aggregates (Ags) as a function of time.
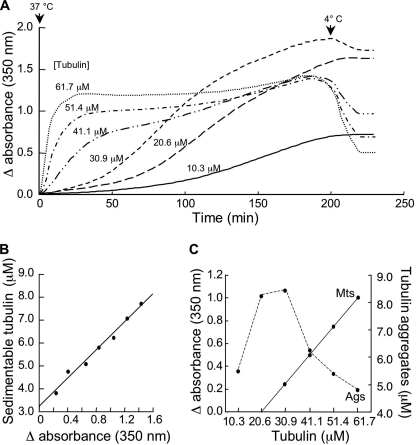
The soluble form of tubulin is highly sensitive to denaturation, but it is protected when incorporated into microtubules (31, 32). Thus, we asked whether tubulin aggregation would be reduced in the presence of microtubules. To address this question, tubulin was incubated for 200 min at concentrations below and above the Cr leading to microtubule self-assembly, which was determined to be 21 μm in our conditions (Fig. 2C). Fig. 2A shows a series of long term incubations at different tubulin concentrations. Below the Cr for microtubule self-assembly (<21 μm), the turbidimetric curves remained stable after cooling of the specimens to 4 °C, showing that only aggregation occurred. At 30.9 μm, only a few microtubules assembled, as emphasized by the slight turbidity decrease upon cooling. Increasing the initial tubulin concentration to 41.1, 51.4, and 61.7 μm resulted in classical turbidimetric assembly curves followed by a progressive increase in turbidity that revealed the formation of aggregates. One remarkable effect we noted was that the aggregation decreased with increasing tubulin concentrations and, thus, with the quantity of microtubules. To quantify the aggregation process, we measured the concentration of sedimentable tubulin as a function of the variation in absorbance for a sample that did not form microtubules (Fig. 2B). We found that the quantity of aggregates varied linearly with the absorbance. We used this relationship throughout the rest of the studies to convert the residual absorbance after cooling the samples to 4 °C to micromolar values of aggregated tubulin. Tubulin aggregation at 37 °C was maximal around the Cr for self-assembly and then rapidly decreased as more microtubules assembled (Fig. 2C). These results confirmed that tubulin in its soluble form is more prone to aggregate than when incorporated into microtubules.
FIGURE 2.
Characterization of aggregation as a function of tubulin concentration. A, tubulin was incubated at 37 °C at the indicated concentrations in BRB80 buffer, 1 mm GTP and cooled to 4 °C after 200 min. B, residual absorbance at 350 nm after cooling at 4 °C as a function of sedimentable tubulin (see “Experimental Procedures” for details) is shown. The linear relationship is expressed as [tub]Ags = 3.07 × absorbance + 3.25. C, shown is quantification of microtubules (solid line) and of aggregates (dashed line) with tubulin concentration. The presented experiment is representative of a set of 7.
Hsp90 Inhibits Thermal Aggregation of Tubulin
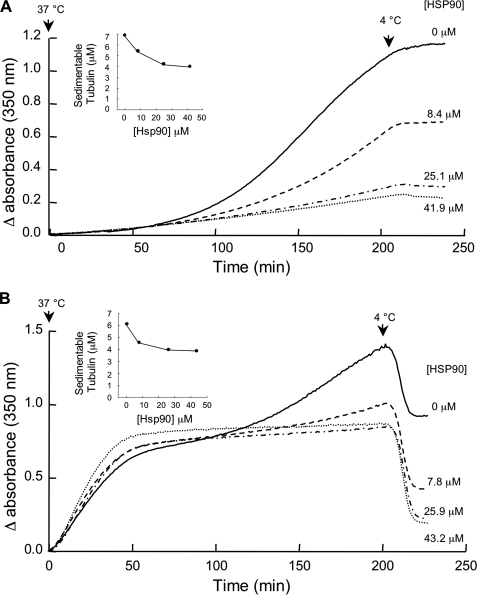
Having fixed the optimal conditions for tubulin aggregation, we asked whether Hsp90 could inhibit this process. In a first set of experiments, tubulin was incubated at 18 μm in the presence of increasing concentrations of Hsp90 (Fig. 3A). In the absence of Hsp90, aggregation was maximal, whereas the addition of increasing concentrations of Hsp90 inhibited this behavior up to a concentration of 25.1 μm. Increasing the Hsp90 concentration to 41.9 μm did not significantly enhance inhibition of tubulin aggregation. Yet it should be noted that we could not obtain complete protection of tubulin against aggregation, suggesting that tubulin is not tightly associated with Hsp90 and that the protective effect is more likely directed by an equilibrium between association and dissociation.
FIGURE 3.
Effect of Hsp90 on tubulin aggregation below (A) and above (B) the critical concentration for self-assembly. A, tubulin (18 μm) was incubated in BRB80 buffer, 1 mm GTP, in the absence or presence Hsp90 at the indicated concentrations. Aggregation was stopped by cooling the samples to 4 °C after 200 min of incubation. B, tubulin (45 μm) was assembled in BRB80 buffer, 1 mm GTP in the presence of increasing concentrations of Hsp90, and depolymerization was induced by cooling the samples to 4 °C after 200 min of incubation. The insets in A and B indicate the concentration of sedimentable tubulin as a function of Hsp90 concentration calculated from the remaining absorbance at 350 nm after depolymerization. The presented experiment is representative of a set of 4.
In a second set of experiments, tubulin was polymerized at 45 μm for 200 min in the presence of increasing concentrations of Hsp90 (Fig. 3B). Under these conditions, once the plateau was reached, tubulin alone aggregated with time. In the presence of increasing Hsp90 concentration, the plateau tended to remain stable; after cooling of the samples, the residual absorbance decreased in an Hsp90 concentration-dependent manner. These experiments showed that Hsp90 inhibited the aggregation phase observed at the plateau. Again, inhibition of aggregation was not complete because the turbidimetric traces did not return to their basal level upon cooling. Protection was also maximal for a free tubulin:Hsp90 ratio of about 1:2.2 (Fig. 3B, inset).
Hsp90 Maintains Tubulin in an Assembly-competent State; Quantification of the Protective Effect
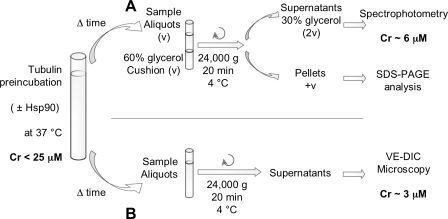
Previous experiments showed that Hsp90 effectively protects tubulin against thermal denaturation. Yet, it was unclear whether the tubulin that was kept in its soluble form in the presence of Hsp90 could polymerize. Because aggregation was maximal for free tubulin concentration below the Cr, we used two protocols to test the capacity of tubulin to polymerize at low concentrations after preincubation (Fig. 4).
FIGURE 4.
Experimental protocols developed to test tubulin activity after preincubation at 37 °C. Tubulin at a concentration near the critical concentration for self- assembly (18–23 μm) was incubated in BRB80 buffer at 37 °C in the absence or presence of Hsp90 for times ranging from 0 to 450 min. A, samples were centrifuged onto 60% glycerol cushions in BRB80, GTP 1 mm (v/v). The supernatants were collected and homogenized to give a final glycerol concentration of 30%. The capacity of tubulin to polymerize was then assessed by spectrophotometry (see Fig. 5). The pellets were analyzed on an 8% SDS-PAGE to evaluate the quantity of aggregated tubulin (Fig. 5, A and B, insets). B, samples were centrifuged, and the supernatants were collected to test tubulin polymerization activity in the presence of purified centrosomes using video-enhanced differential interference light (see Fig. 6).
Macroscopic Approach by Spectrophotometry
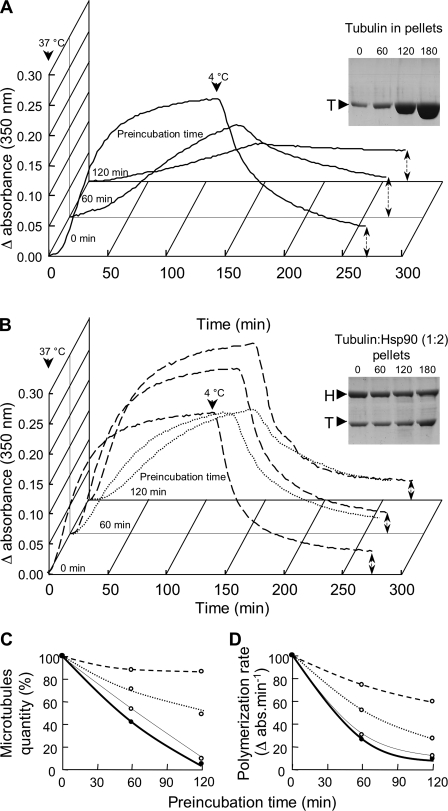
In the first set of experiments, the ability of tubulin to assemble into microtubules was assessed by spectrophotometry (see “Experimental Procedures” and Fig. 4A). Fig. 5 presents the results. In the absence of Hsp90, the quantity of microtubules formed dramatically decreased with tubulin preincubation times (Fig. 5A), whereas the quantity of aggregated tubulin increased accordingly (Fig. 5A, inset). In the presence of a 1.9-fold excess of Hsp90, the spectrophotometric curves obtained after 60 min and 120 min of preincubation were similar to that obtained in the absence of preincubation (dashed lines in Fig. 5B). This result was confirmed by an analysis of the pellets showing no substantial increase in aggregation with incubation time (Fig. 5B, inset).
FIGURE 5.
Hsp90 keeps tubulin soluble and preserves its capacity to assemble into microtubules. Tubulin at 22.3 μm was preincubated for times ranging from 0 to 180 min in the absence or presence of Hsp90. The samples were then prepared as indicated in Fig. 4A. Supernatants were used to test tubulin capacity to form microtubules after tubulin preincubation in the absence of Hsp90 (A) and in the presence of Hsp90 (B) at 20.7 μm (dotted lines) and 41.3 μm (dashed lines). Pellets were analyzed on an 8% SDS-PAGE (A and B, insets). Preincubation times are indicated at the top of the gels; T and H correspond to tubulin and Hsp90, respectively. The quantity of microtubules formed (C) and the apparent polymerization rate (D) are reported as a function of the preincubation time for tubulin alone (bold lines) and for tubulin preincubated in the presence of Hsp90 at 10.3 (thin lines), 20.7 (dotted lines), and 41.3 μm (dashed lines). The presented experiment is representative of a set of 5.
In agreement with the previous results, a stoichiometric ratio of tubulin:Hsp90 of 1:0.9 induced only a partial protection (dotted lines in Fig. 5B). Results obtained for the three tubulin:Hsp90 ratios are summarized in Fig. 5, C and D. Experiments performed at substoichiometry, i.e. tubulin:Hsp90 1:0.5, showed that the protective effect of Hsp90 was very low. Indeed, after a preincubation time of 120 min, few microtubules were formed, i.e. slightly more than what was observed for tubulin alone. The protective effect of Hsp90 started to become notable at stoichiometry and was maximal for a 1.9-fold excess of Hsp90 (Fig. 5C).
Similar conclusions could be deduced from the measurement of the global polymerization rate (Fig. 5D). Nevertheless, regarding this parameter, the Hsp90 protective effect was less spectacular. Indeed, for the preincubation time of 120 min in the presence of a 1.9-fold excess of Hsp90, we observed that even if the quantity of microtubules was poorly affected, the polymerization rate decreased by 40%.
To summarize, these results confirm that Hsp90 inhibits tubulin aggregation and maintains it in a conformational state compatible with its polymerization activity. The protective effect was maximal when tubulin was preincubated in the presence of a 1.9-fold excess of Hsp90. Under these conditions, the quantity of microtubules formed was not affected; thus, the binding of Hsp90 to tubulin did not modify the tubulin-microtubule equilibrium. Nevertheless, a significant decrease of the tubulin polymerization rate depending on preincubation time was observed.
Quantification of the Hsp90 Protective Effect by VE-DIC Light Microscopy
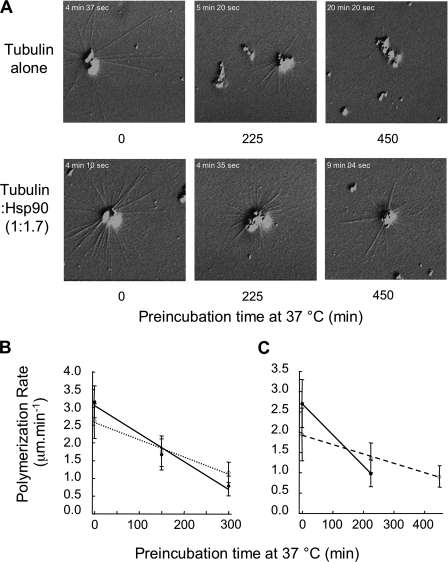
In a second set of experiments, we studied the ability of tubulin to assemble into microtubules after the preincubation step and quantified it using VE-DIC light microscopy (see “Experimental Procedures” and Fig. 4B). Considering the previously obtained results, we studied two tubulin:Hsp90 concentration ratios (1:0.9 and 1:1.7); see Fig. 6. Moreover, we increased preincubation times because the Cr was 3 μm in the presence of centrosomes (data not shown (27)). Fig. 6A shows typical images of microtubule-nucleated from purified centrosomes after sample preincubations of 0, 225, and 450 min. Tubulin alone (control) and tubulin incubated in the presence of a 1.7-fold excess of Hsp90 are shown. For tubulin alone, we observed that the number of microtubules decreased with increasing preincubation time. For 450 min of preincubation, no microtubules were observed. On the other hand, in the presence of a 2-fold excess of Hsp90, we observed microtubules at all preincubation times tested.
FIGURE 6.
Loss of tubulin activity and the Hsp90 protective effect quantified by video light microscopy. A, shown are video microscopy snapshots of microtubules during polymerization after 0, 225, and 450 min of preincubation. Tubulin alone at 21.9 μm (control) and tubulin incubated in the presence of Hsp90 at 37 μm are shown; see the protocol detailed in Fig. 4B. The indicated time at the top left corner corresponds to the time elapsed from the initiation of the video microscopy record. Results presented in graphs B and C were obtained from two independent experiments and show the evolution of microtubule polymerization rate as a function of preincubation time for tubulin alone (bold lines) and stoichiometric ratios of tubulin:Hsp90 of 1:0.9 (dotted line) and 1:1.7 (dashed line).
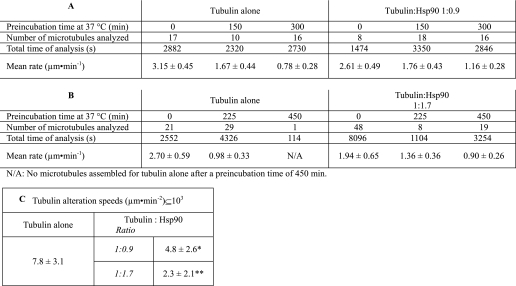
To follow tubulin alteration, we analyzed tubulin polymerization mean rates because this parameter is linearly related to the active tubulin concentration (34, 35). Table 1 shows a summary of the results. For tubulin alone, after 150 and 300 min of preincubation, the mean rate assembly of tubulin decreased by 50 and 75%, respectively. Tubulin became inactive between 300 and 450 min of preincubation. In the presence of Hsp90 at stoichiometry (1:0.9), the loss of tubulin activity was slower: −33% after 150 min of preincubation and −55% after 300 min. The protective effect was even stronger for the Hsp90 1.7-fold excess, with a decrease of −54% after 450 min. Tubulin polymerization rates gave a precise idea of tubulin activity; the linear regression of the plot showing the evolution of the activity as a function of preincubation time allowed us to calculate a new parameter; that is, the slope, which corresponds to the tubulin aggregation rate (Fig. 6, B and C). The mean aggregation rate was 7.8 ± 3.1 10−3 μm·min−2 for tubulin alone and 4.8 ± 2.6 10−3 and 2.3 ± 2.1 10−3 μm·min−2 in the presence of Hsp90 at 1:0.9 and 1:1.7 stoichiometric ratios, respectively.
TABLE 1.
VE-DIC light microscopy analysis; influence of Hsp90 on tubulin polymerization rate after preincubation at 37 °C (see Fig. 4B)
The protein concentrations during preincubation were 22.8 μm for tubulin and 20 μm for Hsp90 (A) and 21.9 μm for tubulin and 37 μm for Hsp90 (B). C, comparison of tubulin denaturation speeds is shown. Asterisk indicates p < 0.2 level of significance; double asterisk indicates p < 0.02 level of significance.
Geldanamycin Inhibits the Protection of Tubulin by Hsp90
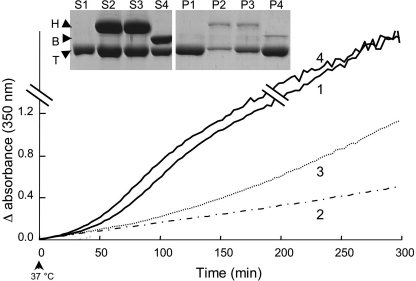
To test whether tubulin protection by Hsp90 is specific, we incubated tubulin in the presence of GA alone (first control), in the presence of BSA (second control) at the same concentration as Hsp90, and with Hsp90 with or without GA (Fig. 7). For control experiments, the turbidimetric curves display typical aggregation profiles, indicating that BSA did not influence tubulin aggregation. In the presence of Hsp90, the increase in turbidity was very weak compared with the controls. The addition of GA to the tubulin-Hsp90 sample partially inhibited the Hsp90-protective effect on tubulin. After centrifugation, SDS-PAGE analysis showed that the amounts of tubulin present in the supernatants were identical in both controls but higher in the presence of Hsp90 (Fig. 7, inset). Pellets analysis by SDS-PAGE reinforced this result; nevertheless, four to five times more tubulin aggregates were found in the tubulin-Hsp90-GA pellet compared with tubulin-Hsp90 (Fig. 7, inset). Taken together, these results clearly demonstrate that Hsp90 specifically protects tubulin from thermal denaturation.
FIGURE 7.
Specificity of the Hsp90 protective effect on tubulin. Shown is alteration of tubulin (16.3 μm) in the presence of geldanamycin (143 μm) (1), Hsp90 (20 μm) (2), Hsp90 and geldanamycin (20 and 143 μm, respectively) (3), and BSA (20 μm) (4). After incubation, samples were centrifuged, and supernatants (S) and pellets (P) were analyzed on an 8% SDS-PAGE. T, B, and H correspond to tubulin, BSA, and Hsp90, respectively. The presented experiment is representative of a set of 5.
Native-PAGE Tubulin Profile Induced upon Heating Is Modified in the Presence of Hsp90
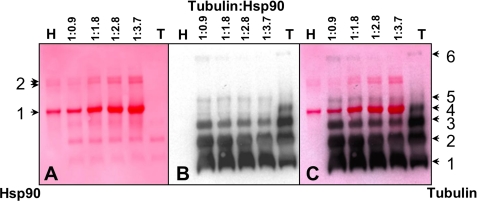
To delineate a tubulin-Hsp90 complex, we heated tubulin and Hsp90 at 39 °C for 5 min separately and at increasing ratios of Hsp90 versus tubulin. The protein complexes formed were cross-linked by using 0.1% glutaraldehyde and then analyzed by electroblotted native-PAGE. Ponceau red staining showed that Hsp90 appears predominantly as a dimer and oligomers, as indicated by left arrows 1 and 2 in Fig. 8A, respectively, whereas we observed three bands for warmed tubulin alone (Fig. 8A). Anti-α-tubulin antibody revealed five bands for heated tubulin alone (1, 2, 3, 4, and 6; Fig. 8B, right arrows). The migration pattern of heated tubulin was different in the presence of Hsp90. The intensity of bands 2, 3, and 6 decreased with increasing Hsp90 concentrations, and band 6 completely disappeared. In addition, regardless of the Hsp90 concentration tested, the tubulin band 4 was not detected. On the other hand, the intensity of tubulin band 1 increased in the presence of Hsp90. A new band (band 5) was detected only in the presence of Hsp90 and just above the Hsp90 dimer band. This new band was assigned to a tubulin-Hsp90 complex.
FIGURE 8.
Hsp90 modifies the native PAGE migration pattern of heated tubulin. Tubulin at 18 μm (T) and Hsp90 at 16.5 μm (H) were heated at 39 °C for 5 min separately or together at the indicated tubulin:Hsp90 stoichiometric ratios. A, shown is Ponceau red membrane staining of transferred proteins from native PAGE; arrows 1 and 2 on the left indicate the Hsp90 dimer and oligomers, respectively. B, labeling with anti-α-tubulin monoclonal antibody is shown. C, superimposition of Ponceau red staining and anti-α-tubulin antibody staining. Arrows 1–6 on the right correspond to tubulin bands.
DISCUSSION
In a first set of experiments, we characterized tubulin thermal denaturation and found that the tubulin alteration process is dependent on preincubation temperature (supplemental Fig. 1), on tubulin concentration, and on the presence of microtubules. Indeed, the increase of tubulin concentration above the Cr led to the multiplication of nucleation sites and, thus, microtubule number. In a concomitant way, the probability of tubulin dimer incorporation into microtubules increased, accelerating its turnover at microtubule ends and, thus, producing an autostabilization effect. At the steady state, the tubulin aggregation led to a decrease in the quantity of microtubules depending on incubation time. The real quantity of microtubules was lower than the theoretical quantity deduced from the concentration of sedimentable tubulin. This discrepancy highlights that in addition to aggregates, some soluble tubulin does not participate in the polymerization process. For tubulin concentrations below the Cr, the aggregation process increased with tubulin concentration; it was maximal for concentrations slightly higher than the Cr for assembly.
Long term incubation experiments clearly demonstrated that Hsp90 inhibited tubulin aggregation for tubulin concentrations under and above the Cr; this effect was maximal for an Hsp90 excess around 2-fold. In addition, no change was observed in the presence of ATP (supplemental Fig. 2). The Hsp90-protective effect on tubulin is ATP-independent, as has already been reported (36, 37), or Hsp90 can use GTP present in solution as previously suggested (38).
Using spectrophotometry, we demonstrated that Hsp90 maintains tubulin in an assembly-competent state. After a preincubation step in the presence of 1.9-fold Hsp90 excess, the microtubule quantity remained almost constant, whereas the tubulin polymerization rate was affected. This was probably the result of a sequestering effect of the tubulin dimer by the chaperone. This result suggests that the tubulin-Hsp90 equilibrium is progressively displaced.
Tubulin polymerization activity was also monitored by video light microscopy after preincubation. We detailed values of the dynamic instability parameters for all conditions tested. In contrast to our expectations, regardless of whether or not the sample contained Hsp90, we identified no evidence of any modification of the catastrophe frequency compared with non-preincubated tubulin alone at various concentrations (data not shown). Indeed, the catastrophe frequency is closely linked to polymerization rate and, thus, to tubulin concentration (39). This suggests that altered tubulin does not participate in the polymerization process. For non-preincubated samples, it is interesting to note that tubulin polymerization was slower in the presence of Hsp90 than in its absence. This Hsp90 inhibition effect on tubulin polymerization was previously observed under conditions in which the tubulin polymerization rate was very slow and Hsp90 excess higher (9). The longer the preincubation time is, the stronger the Hsp90 inhibition is, and the higher the affinity of Hsp90 for tubulin should be. This relationship clearly demonstrates that the decrease in tubulin activity measured in the presence of Hsp90 by VE-DIC light microscopy is not only the consequence of a potential tubulin alteration but also of increased tubulin sequestration by Hsp90. Thus, the Hsp90 protective effect measured by this protocol would be underestimated. Nevertheless, this speed was reduced by more than 3-fold in the presence of a 1.7-fold excess of Hsp90.
Experiments performed in the presence of a large GA excess have shown that tubulin protection by Hsp90 was partially inhibited. This observation reinforces the idea that the protective effect highlighted here is N-terminal nucleotide binding-independent. Nevertheless, the binding of GA at the N-terminal domain is known to induce conformational changes in the Hsp90 middle and C-terminal domains (40). These conformational long range structural effects arising from communication among the Hsp90 domains would be expected to modify the Hsp90 structure, explaining why GA only partially inhibited its activity. The Hsp90 middle and/or C-terminal domains would be implicated in tubulin thermal protection, as has been previously proposed (41–43). This simple experiment in the presence of GA will be useful to probe new potentially antitumoral molecules that target Hsp90 chaperone function.
As revealed by Native-PAGE, in the presence of Hsp90, tubulin bands corresponding to the higher molecular weights decreased or disappeared to the detriment of the band corresponding to native tubulin. Two hypotheses can be advanced; first, Hsp90 would interact with tubulin aggregates and dissociate them, or second, Hsp90 would bind to early unfolding intermediates and prevent their aggregation. Using spectrophotometry, we have tested whether Hsp90 could solubilize tubulin during aggregation; we observed no tubulin aggregate solubilization but only a slowing of the aggregation process after Hsp90 addition (data not shown). This outcome clearly indicates that Hsp90 cannot resolve tubulin aggregates and, rather, binds early unfolding intermediates, preventing their aggregation. A Western blot revealed a band just above the Hsp90 dimer that probably corresponded to an Hsp90 dimer-tubulin complex. Hsp90 is known to oligomerize in the presence of magnesium (44); these oligomers would correspond to the Hsp90 quaternary structures having the chaperone activity (45–47). We could not check for the presence of tubulin around the Hsp90 oligomer species. Considering the weakness of tubulin band intensity appearing just above the Hsp90 dimer and the low Hsp90 oligomer quantity compared with the dimer, it was unlikely that we would be able to identify any Hsp90 oligomer-tubulin complexes.
In summary, we demonstrated here that in vitro, dimeric soluble tubulin is prone to aggregate even at a physiological temperature despite the presence of microtubules. This sensitivity must be taken into account when studying microtubule intrinsic dynamic instability at steady state, especially when using nucleation centers, i.e. centrosomes or axonemes for optical video microscopy experiments. Under these experimental conditions, the quantity of microtubules formed is very low compared with the concentration of free tubulin, conditions that are highly favorable for tubulin denaturation. Thus, it appears to be preferable to work at lower temperatures (48, 49), i.e. less than 30 °C, that per se modify microtubule dynamic instability.
Hsp90 protects tubulin against denaturation under both polymerization and non-polymerization conditions with an optimal ratio of two Hsp90 dimers for one tubulin heterodimer. Furthermore, we show that Hsp90 maintains tubulin in an assembly-competent state for several hours. In addition, we generated evidence that tubulin protection by Hsp90 results from transient binding to highly structured early unfolding intermediates. Moreover, we demonstrate that the Hsp90 protective effect is specific and ATP-independent.
Hsp90 and tubulin are ubiquitous and among the most abundant proteins in all eukaryotic cells (50, 51). They play crucial roles as tubulin is indispensable to cell division and morphology, whereas the absence of Hsp90 is lethal. In the cell, it has been demonstrated that a significant portion of Hsp90 is associated with a tubulin-containing complex in a hypotonic cytosol preparation as in intact cells (12). Furthermore, Hsp90 has been shown to colocalize with the microtubules network in both interphase and mitotic mammalian cells (11, 12, 15). After heat stress, Hsp90 and Hsp70 are found in high molecular mass complexes with tubulin, and the authors have suggested that this macrocomplex may be an induced protective assembly rather than a normal processing intermediate (10). It is well known that in such stress conditions Hsp90 is overexpressed (52), whereas a concomitant disruption of microtubule organization, a decrease of nucleation activity, and a partial or total disassembly of the microtubule cytoskeleton occur, releasing an unstable tubulin dimer in the cytosol (53–58). In line with our results, we propose that at the cellular level and under stress conditions, Hsp90 would sequester soluble (i.e. unstable) tubulin dimers to prevent their irreversible aggregation and to maintain them in a conformational active state for several hours. Once the stress conditions have ended, tubulin would be able to form microtubules again, thus, restoring their cellular functions.
More generally, besides stress conditions, it is well known that the microtubule cytoskeleton undergoes an abrupt reorganization at the interphase-mitosis (G2/M) transition, leading to the decrease of the cellular microtubule quantity (59). Concomitantly, the free tubulin cytosolic concentration temporarily increases. At this key moment of cell cycle, Hsp90 would participate in maintaining tubulin dimer integrity, making it available to form the future mitotic spindle.
Supplementary Material
Acknowledgment
We thank Daniel Thomas for helpful discussions and critical reading of the manuscript.
This work was supported by a Ligue contre le Cancer grant (to C. G. awarded by the Conseil Scientifique Interrégional Grand-Ouest), a Région Bretagne Ph.D. grant (to L. M.), and Rennes Métropole (to D. C.).

The on-line version of this article (available at http://www.jbc.org) contains supplemental Figs. 1 and 2.
- Hsp90
- heat-shock protein of 90 kDa
- Hsp70
- heat-shock protein of 70 kDa
- BSA
- bovine serum albumin
- Cr
- critical concentration
- GA
- geldanamycin
- VE-DIC
- video-enhanced differential interference contrast light microscopy
- Pipes
- 1,4-piperazinediethanesulfonic acid.
REFERENCES
- 1.Nollen E. A., Morimoto R. I. (2002) J. Cell Sci. 115, 2809–2816 [DOI] [PubMed] [Google Scholar]
- 2.Sato S., Fujita N., Tsuruo T. (2000) Proc. Natl. Acad. Sci. U.S.A. 97, 10832–10837 [DOI] [PMC free article] [PubMed] [Google Scholar]
- 3.Vaughan C. K., Mollapour M., Smith J. R., Truman A., Hu B., Good V. M., Panaretou B., Neckers L., Clarke P. A., Workman P., Piper P. W., Prodromou C., Pearl L. H. (2008) Mol. Cell 31, 886–895 [DOI] [PMC free article] [PubMed] [Google Scholar]
- 4.Wegele H., Müller L., Buchner J. (2004) Rev. Physiol. Biochem. Pharmacol. 151, 1–44 [DOI] [PubMed] [Google Scholar]
- 5.Müller L., Schaupp A., Walerych D., Wegele H., Buchner J. (2004) J. Biol. Chem. 279, 48846–48854 [DOI] [PubMed] [Google Scholar]
- 6.Richter K., Buchner J. (2001) J. Cell. Physiol. 188, 281–290 [DOI] [PubMed] [Google Scholar]
- 7.Schnaider T., Somogyi J., Csermely P., Szamel M. (2000) Cell Stress Chaperones 5, 52–61 [DOI] [PMC free article] [PubMed] [Google Scholar]
- 8.Radanyi C., Le Bras G., Marsaud V., Peyrat J. F., Messaoudi S., Catelli M. G., Brion J. D., Alami M., Renoir J. M. (2009) Cancer Lett 274, 88–94 [DOI] [PubMed] [Google Scholar]
- 9.Garnier C., Barbier P., Gilli R., Lopez C., Peyrot V., Briand C. (1998) Biochem. Biophys. Res. Commun. 250, 414–419 [DOI] [PubMed] [Google Scholar]
- 10.Williams N. E., Nelsen E. M. (1997) J. Cell Sci. 110, 1665–1672 [DOI] [PubMed] [Google Scholar]
- 11.Redmond T., Sanchez E. R., Bresnick E. H., Schlesinger M. J., Toft D. O., Pratt W. B., Welsh M. J. (1989) Eur. J. Cell Biol. 50, 66–75 [PubMed] [Google Scholar]
- 12.Sanchez E. R., Redmond T., Scherrer L. C., Bresnick E. H., Welsh M. J., Pratt W. B. (1988) Mol. Endocrinol. 2, 756–760 [DOI] [PubMed] [Google Scholar]
- 13.Giustiniani J., Daire V., Cantaloube I., Durand G., Poüs C., Perdiz D., Baillet A. (2009) Cell. Signal. 21, 529–539 [DOI] [PubMed] [Google Scholar]
- 14.Liang P., MacRae T. H. (1997) J. Cell Sci. 110, 1431–1440 [DOI] [PubMed] [Google Scholar]
- 15.Czar M. J., Welsh M. J., Pratt W. B. (1996) Eur. J. Cell Biol. 70, 322–330 [PubMed] [Google Scholar]
- 16.Hiller G., Weber K. (1978) Cell 14, 795–804 [DOI] [PubMed] [Google Scholar]
- 17.Vaughan C. K., Gohlke U., Sobott F., Good V. M., Ali M. M., Prodromou C., Robinson C. V., Saibil H. R., Pearl L. H. (2006) Mol. Cell 23, 697–707 [DOI] [PMC free article] [PubMed] [Google Scholar]
- 18.Pearl L. H., Prodromou C. (2006) Annu. Rev. Biochem. 75, 271–294 [DOI] [PubMed] [Google Scholar]
- 19.Siligardi G., Hu B., Panaretou B., Piper P. W., Pearl L. H., Prodromou C. (2004) J. Biol. Chem. 279, 51989–51998 [DOI] [PubMed] [Google Scholar]
- 20.Yonezawa N., Nishida E., Sakai H., Koyasu S., Matsuzaki F., Iida K., Yahara I. (1988) Eur. J. Biochem. 177, 1–7 [DOI] [PubMed] [Google Scholar]
- 21.Garnier C., Protasevich I., Gilli R., Tsvetkov P., Lobachov V., Peyrot V., Briand C., Makarov A. (1998) Biochem. Biophys. Res. Commun. 249, 197–201 [DOI] [PubMed] [Google Scholar]
- 22.Garnier C., Lafitte D., Jorgensen T. J., Jensen O. N., Briand C., Peyrot V. (2001) Eur. J. Biochem. 268, 2402–2407 [DOI] [PubMed] [Google Scholar]
- 23.Ashford A. J., Anderson S. S. L., Hyman A. A. (1998) in Cell Biology: A Laboratory Handbook (Cells J. E. ed.) 2nd Ed., pp. 205–212, Academic Press, San Diego, CA [Google Scholar]
- 24.Andersen S. S., Karsenti E. (1997) J. Cell Biol. 139, 975–983 [DOI] [PMC free article] [PubMed] [Google Scholar]
- 25.Bornens M., Paintrand M., Berges J., Marty M. C., Karsenti E. (1987) Cell Motil. Cytoskeleton 8, 238–249 [DOI] [PubMed] [Google Scholar]
- 26.Chrétien D., Buendia B., Fuller S. D., Karsenti E. (1997) J. Struct. Biol. 120, 117–133 [DOI] [PubMed] [Google Scholar]
- 27.Chrétien D., Fuller S. D., Karsenti E. (1995) J. Cell Biol. 129, 1311–1328 [DOI] [PMC free article] [PubMed] [Google Scholar]
- 28.Laemmli U. K. (1970) Nature 227, 680–685 [DOI] [PubMed] [Google Scholar]
- 29.Kim D., Lee Y. J., Corry P. M. (1992) J. Cell. Physiol. 153, 353–361 [DOI] [PubMed] [Google Scholar]
- 30.Gaskin F. (1982) Methods Enzymol. 85, 433–439 [DOI] [PubMed] [Google Scholar]
- 31.Day R. M., Gupta J. S., MacRae T. H. (2003) Cell Stress Chaperones 8, 183–193 [DOI] [PMC free article] [PubMed] [Google Scholar]
- 32.Mozo-Villarías A., Morros A., Andreu J. M. (1991) Eur. Biophys. J. 19, 295–300 [DOI] [PubMed] [Google Scholar]
- 33.Mitchison T., Kirschner M. (1984) Nature 312, 237–242 [DOI] [PubMed] [Google Scholar]
- 34.Arnal I., Heichette C., Diamantopoulos G. S., Chrétien D. (2004) Curr. Biol. 14, 2086–2095 [DOI] [PubMed] [Google Scholar]
- 35.Walker R. A., O'Brien E. T., Pryer N. K., Soboeiro M. F., Voter W. A., Erickson H. P., Salmon E. D. (1988) J. Cell Biol. 107, 1437–1448 [DOI] [PMC free article] [PubMed] [Google Scholar]
- 36.Jakob U., Lilie H., Meyer I., Buchner J. (1995) J. Biol. Chem. 270, 7288–7294 [DOI] [PubMed] [Google Scholar]
- 37.Miyata Y., Yahara I. (1992) J. Biol. Chem. 267, 7042–7047 [PubMed] [Google Scholar]
- 38.Marcu M. G., Schulte T. W., Neckers L. (2000) J. Natl. Cancer Inst. 92, 242–248 [DOI] [PubMed] [Google Scholar]
- 39.Vitre B., Coquelle F. M., Heichette C., Garnier C., Chrétien D., Arnal I. (2008) Nat. Cell Biol. 10, 415–421 [DOI] [PubMed] [Google Scholar]
- 40.Phillips J. J., Yao Z. P., Zhang W., McLaughlin S., Laue E. D., Robinson C. V., Jackson S. E. (2007) J. Mol. Biol. 372, 1189–1203 [DOI] [PubMed] [Google Scholar]
- 41.Young J. C., Schneider C., Hartl F. U. (1997) FEBS Lett. 418, 139–143 [DOI] [PubMed] [Google Scholar]
- 42.Scheibel T., Siegmund H. I., Jaenicke R., Ganz P., Lilie H., Buchner J. (1999) Proc. Natl. Acad. Sci. U.S.A. 96, 1297–1302 [DOI] [PMC free article] [PubMed] [Google Scholar]
- 43.Yamada S., Ono T., Mizuno A., Nemoto T. K. (2003) Eur. J. Biochem. 270, 146–154 [DOI] [PubMed] [Google Scholar]
- 44.Garnier C., Barbier P., Devred F., Rivas G., Peyrot V. (2002) Biochemistry 41, 11770–11778 [DOI] [PubMed] [Google Scholar]
- 45.Nemoto T. K., Fukuma Y., Yamada S., Kobayakawa T., Ono T., Ohara-Nemoto Y. (2004) Biochemistry 43, 7628–7636 [DOI] [PubMed] [Google Scholar]
- 46.Thorne M. E., McQuade K. L. (2004) Biochem. Biophys. Res. Commun. 323, 1163–1171 [DOI] [PubMed] [Google Scholar]
- 47.Nemoto T. K., Ono T., Tanaka K. (2001) Biochem. J. 354, 663–670 [DOI] [PMC free article] [PubMed] [Google Scholar]
- 48.Manna T., Honnappa S., Steinmetz M. O., Wilson L. (2008) Biochemistry 47, 779–786 [DOI] [PubMed] [Google Scholar]
- 49.Manna T., Thrower D. A., Honnappa S., Steinmetz M. O., Wilson L. (2009) J. Biol. Chem. 284, 15640–15649 [DOI] [PMC free article] [PubMed] [Google Scholar]
- 50.Pratt W. B. (1998) Proc. Soc. Exp. Biol. Med. 217, 420–434 [DOI] [PubMed] [Google Scholar]
- 51.Nogales E., Wang H. W. (2006) Curr. Opin. Cell Biol. 18, 179–184 [DOI] [PubMed] [Google Scholar]
- 52.Hickey E., Brandon S. E., Sadis S., Smale G., Weber L. A. (1986) Gene 43, 147–154 [DOI] [PubMed] [Google Scholar]
- 53.Debec A., Marcaillou C. (1997) Biol. Cell 89, 67–78 [DOI] [PubMed] [Google Scholar]
- 54.van Bergen en Henegouwen P. M., Linnemans A. M. (1987) Exp. Cell Res. 171, 367–375 [DOI] [PubMed] [Google Scholar]
- 55.Knox J. D., Mitchel R. E., Brown D. L. (1991) Exp. Cell Res. 194, 275–283 [DOI] [PubMed] [Google Scholar]
- 56.Coss R. A., Dewey W. C., Bamburg J. R. (1982) Cancer Res. 42, 1059–1071 [PubMed] [Google Scholar]
- 57.Malawista S. E., De Boisfleury Chevance A. (1982) J. Cell Biol. 95, 960–973 [DOI] [PMC free article] [PubMed] [Google Scholar]
- 58.Vidair C. A., Doxsey S. J., Dewey W. C. (1995) J. Cell. Physiol. 163, 194–203 [DOI] [PubMed] [Google Scholar]
- 59.Zhai Y., Kronebusch P. J., Simon P. M., Borisy G. G. (1996) J. Cell Biol. 135, 201–214 [DOI] [PMC free article] [PubMed] [Google Scholar]
Associated Data
This section collects any data citations, data availability statements, or supplementary materials included in this article.


