Abstract
Nontransformed cells can force tumor cells to assume a normal morphology and phenotype by the process of contact normalization. Transformed cells must escape this process to become invasive and malignant. However, mechanisms underlying contact normalization have not been elucidated. Here, we have identified genes that are affected by contact normalization of Src-transformed cells. Tumor cells must migrate to become invasive and malignant. Src must phosphorylate the adaptor protein Cas (Crk-associated substrate) to promote tumor cell motility. We report here that Src utilizes Cas to induce podoplanin (Pdpn) expression to promote tumor cell migration. Pdpn is a membrane-bound extracellular glycoprotein that associates with endogenous ligands to promote tumor cell migration leading to cancer invasion and metastasis. In fact, Pdpn expression accounted for a major part of the increased migration seen in Src-transformed cells. Moreover, nontransformed cells suppressed Pdpn expression in adjacent Src-transformed cells. Of >39,000 genes, Pdpn was one of only 23 genes found to be induced by transforming Src activity and suppressed by contact normalization of Src-transformed cells. In addition, we found 16 genes suppressed by Src and induced by contact normalization. These genes encode growth factor receptors, adaptor proteins, and products that have not yet been annotated and may play important roles in tumor cell growth and migration.
Keywords: Cancer, Cell, Cell/Cell-Cell Interaction, Phosphorylation/Kinases/Tyrosine, Cell Junctions, Cell Migration
Introduction
Cells transformed by a variety of chemicals, viral agents, and oncogenes, including Src, can be normalized by contact with nontransformed cells. This process is called “contact normalization” (1, 2). Genetically transformed cells can assume a normal morphology and reside in many organs, including skin, breast, and intestine, while they are normalized by contact with adjacent normal cells (for review, see Refs. 1, 2). Transformed cells must escape this form of growth control to “break out” of their microenvironment and invade new sights. The ability of tumor cells to migrate is critical for this process.
Src is a membrane-bound tyrosine kinase that has been implicated in many types of cancer (3). Src phosphorylates the focal adhesion adaptor protein Cas2 (Crk-associated substrate) to promote the nonanchored growth and migration required for tumor cell invasion and metastasis. Therefore, Src transformation of homozygous null Cas knock-out (CasKo) cells does not fully promote their anchorage independence or ability to migrate. These transformed growth characteristics can be conferred to CasKo cells by transfection with wild type Cas (4–7).
Although the importance of Src and Cas in tumor cell migration has been well documented, mechanisms by which Src promotes cell migration have not been thoroughly elucidated. We hypothesized that contact normalization could be used to help elucidate these mechanisms. We used a nonbiased comprehensive strategy to find genes affected by Src and contact normalization.
Here, we show that Src utilizes Cas to induce podoplanin (Pdpn) expression, which is suppressed during contact normalization of Src-transformed cells. Pdpn is a membrane-bound extracellular glycoprotein that associates with endogenous ligands to promote tumor cell migration leading to cancer invasion and metastasis (8–10). In addition, we identify other genes affected by contact normalization that play important roles in tumor cell growth and migration, including growth factor receptors, adaptor proteins, and genes that have not yet been annotated.
EXPERIMENTAL PROCEDURES
Cell Culture
Nontransformed and Src-transformed wild type mouse embryonic fibroblasts, homozygous null Cx43 knock-out brain cells (Cx43Ko), and homozygous null Cas knock-out cells (CasKo) have been described previously (6, 11–13). Cells were maintained in Dulbecco's modified Eagle's medium (HyClone SH30021.01) supplemented with 25 mm HEPES and 10% bovine growth serum (HyClone SH30541.03) at 37 °C, 5% CO2, and 100% humidity. cDNA encoding murine Pdpn or Tmem163 was released from pCMV-Sports-pdpn (Open Biosystems MMM1013-7513215) or pYX-Asc-Tmem163 (Open Biosystems MMM1013-98685813) with EcoRI and XbaI and inserted into the complementary sites of pEF4 to create pEF4Pdpn or pEF4Tmem163, respectively. Cells were transfected with pEF4Pdpn, empty pEF4 vector, siRNA directed against mouse Pdpn (Dharmacon L-048117-01-005), or control siRNA (Dharmacon D-001810--10-05) with Lipofectamine 2000 (14, 15). Cells transfected with pEF4 expression vectors were selected with zeocin. Clones were not taken from any cell lines, thus minimizing potential effects of clonal variation.
Layered Culture System
A layered culture system was used to allow separated populations of transformed and nontransformed cells to form intercellular junctions with each other as described (13, 16). Briefly, 10,000 Src-transformed cells were plated on porous membranes (Costar 3542) containing 300,000 nontransformed cells on the other side. Transformed cells and nontransformed cells were able to form intercellular junctions through the pores in the membrane; however, the membrane pore size (3 μm) is small enough to prevent cells (about 20 μm in diameter) from actually migrating to the other side of the membrane (12, 13, 16). Transformed cells were also plated alone, directly above 300,000 nontransformed cells, or 1 mm above 300,000 nontransformed cells as controls. Nontransformed cells were also plated on these membranes as controls. Cells were harvested and analyzed 24 h after plating.
Expression Microarrays
Gene expression in nontransformed, Src-transformed, and contact normalized Cx43Ko cells was examined by microarray analysis with 430 2.0 Mouse Expression Array gene chips (Affymetrix) as described previously (12). These arrays contain ∼45,000 probe sets that represent >30,000 genes. Affected probe sets displayed a difference of at least 4-fold between transformed and control cells, or at least a 2-fold change with p < 0.05 by t test with n = 3. Genes that were increased by contact normalization were also decreased by Src, but not affected by diffusible factors from nontransformed cells or contact with other transformed cells. Conversely, genes that were decreased by contact normalization were increased by Src, but not affected by diffusible factors from nontransformed cells or contact with other transformed cells. All comparisons were done with cells from parallel cultures to control for variability in reagents or experimental conditions. Expression analysis was performed with Vector Xpression software 4.0 (Invitrogen).
RT-PCR
RNA was purified with Tri-reagent (Sigma T9424). cDNA was synthesized from 1 μg of RNA by with Protoscript First Strand cDNA Synthesis Kit (New England Biolabs E6500S). PCR was performed with 1 μl of cDNA with forward and reverse primers specific for GAPDH (5′-TGCATCCTGCACCACCAACT-3′ and 5′-TGCCTGCTTCACCACCTTC-3′, hygromycin phosphotransferase (5′-CATGGCGTGATTTCATATGCGCGA-3′ and 5′-TCCAGAAGAAGATGTTGGCGACCT-3′), puromycin acetyltransferase (5′-ACCGAGCTGCAAGAACTCTTCCTC-3′ and 5′-AGGAGGCCTTCCATCTGTTGCT-3′), Pdpn (5′-ACCAACACAGACGACCAAGACACT-3′ and 5′-AAGCATCCACTGTGCCTTCAGTTC-3′), Fhl1 (5′-GAGAAGTTCGACTGTCACTACTGC-3′ and 5′-CTGATCCTGGTAAGTGATTCCTCC-3′), 4930408O21Rik (5′-TGTTCTCAGAGCCCAGCATCACTT-3′ and 5′-ACATCCTCTCAGCTGGTTCCTTCA-3′), 1700012B09Rik (5′-CTGTGAACCGCATAAGAGAATCAAGGAGG-3′ and 5′-TGCCTCGAGTAGTACTTGGCTTGT-3′), Tmem163 (5′-ATAGAGTCTGTCATCATGGGCTGG-3′ and 5′-ACAGGCTTCCTGTCAAGCAGAGA-3′), Loc677224 (5′-AACATCCCAGAGCCTTTGACTCCT-3′ and 5′-CAAAGCTGCCATAGCTCTATTCGG-3′), 1810008K04Rik (5′-AAGCCAGGACTCTCACATGCAACT-3′ and 5′-AGCTTTGCAGATGGAACGGAACAC-3′), and D4bwg0951e (5′-TGGATGGCATCTCAGTAGGGAGCTA-3′ and 5′-TTGCACACCAGTCCCATGCAAA-3′). GAPDH was amplified at 95 °C for 5 min, 95 °C for 30 s, 55 °C for 30 s, and 72 °C for 30 s for 30 cycles, followed by 72 °C for 5 min. Hygromycin phosphotransferase was amplified at 95 °C for 5 min, 95 °C for 30 s, and 72 °C for 1 min for 30 cycles, followed by 72 °C for 5 min. The other genes were amplified at 95 °C for 5 min, 95 °C for 30 s, 60 °C for 30 s, and 72 °C for 30 s for 30 cycles, followed by 72 °C for 5 min. qPCR was performed with 0.5 μl of cDNA amplified 95 °C for 10 min followed by 95 °C for 15 s, and 60 °C for 1 min for 30 cycles in a StepOne RT-PCR machine with SYBR Green master mix and analyzed with StepOne Software version 2.0 (Applied Biosystems).
Western Blotting
Western blotting was performed as described previously (12). Protein (10 μg/lane) was resolved by SDS-PAGE, transferred to Immobilon-P membranes (Millipore IH1079562), and incubated with antisera specific for Pdpn (Santa Cruz Biotechnology SC53553), Cas (Santa Cruz Biotechnology SC860), active Src kinase (Cell Signaling Technology 2010), v-Src (Upstate Biotechnology 05-185), Tmem163 (raised against the sequence VQSDEERQPRISESGQFS, representing amino acids 43–60 of mouse Tmem163, in rabbits as described previously) (12, 14), or β-actin (Sigma A1978). Primary antiserum was recognized by appropriate secondary antiserum conjugated to horseradish peroxidase and detected using Enhanced Chemiluminescence (Millipore WBKLS0500). After blotting, membranes were stained with India ink to verify equal loading and transfer.
Immunofluorescence Microscopy
Cells (300,000/dish) were cultured on 35-mm poly-d-lysine-coated glass-bottomed culture dishes (MatTek P35GC-1.5-14-C) for 24 h. Cells were fixed with 2% paraformaldehyde, permeabilized with 0.2% Triton X-100 in phosphate-buffered saline for 10 min, washed three times with 0.1% Tween 20 in phosphate-buffered saline followed by 1% bovine serum albumin in phosphate-buffered saline for 30 min, incubated with Pdpn antiserum (1:100) overnight at 4 °C, washed, and then labeled with goat anti-Syrian hamster IgG conjugated to Alexa Fluor 488 (Molecular Probes A21110). Cells were visualized on Zeiss Axiovert or PASCAL microscope systems as described (14, 15).
Cell Growth, Migration, and Toxicity Assays
Cell growth and migration were assayed as described previously (12, 14). Briefly, anchored and nonanchored growth was measured by plating 20,000 cells/well on standard 12-well cluster plates (Falcon 353043) or ultralow attachment 24-well cluster plates (Corning 3473), respectively, and counting cells at defined times by Coulter counter. To examine membrane cell migration, 200,000 cells were plated on cell culture inserts with a 8-μm pore size (Transwell-Clear; Costar 3428) in 6-well cluster plates and grown for 24 h. Cells were then released separately from the top of the membrane, bottom of the membrane, and well beneath the membrane and counted. Migration and colonization was quantitated as the percentage of cells that moved to the bottom of the membrane or well beneath the membrane, respectively. Cell migration was also examined by a wound-healing assay and quantitated as the number of cells that entered a 1.8-mm2 or 0.9-mm2 area of the wound during 24 h. Cells were stained with 0.2% trypan blue and counted with a hemocytometer to evaluate cytotoxicity.
RESULTS
Identification of Genes Affected by Src and Contact Normalization
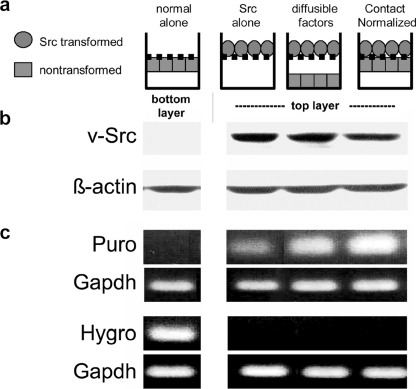
Tumor cells must overcome contact normalization by adjacent nontransformed cells in their microenvironment to become malignant or metastatic (17). We have developed a layered culture system to identify genes involved in this process (12, 13). Src-transformed cells were incubated on a porous membrane directly over nontransformed cells (see Figs. 1–3). The transformed cells and nontransformed cells were able to form intercellular junctions through the pores in the membrane while being retained as separate populations. Thus, although intercellular junctions formed between the transformed and nontransformed cells, the layers were retained as distinct populations that were harvested separately. As controls, transformed cells were also incubated alone, or 1 mm over nontransformed cells to enable communication by diffusible factors but not direct contact. As we have reported previously, cellular material is not transferred between harvested cell layers (12–14, 16, 18). This was verified by the retention of the Src kinase and mRNA encoding puromycin acetyltransferase in the transformed cells and mRNA encoding hygromycin phosphotransferase in nontransformed cells (Fig. 1).
FIGURE 1.
Layered culture system. a, nontransformed or Src-transformed Cx43Ko cells were incubated beneath or on top of a porous membrane that prevents actual mixing of the cell populations. Transformed cells separated by 1 mm from nontransformed cells enabled communication by diffusible factors but not intercellular junctions. Transformed cells incubated directly over nontransformed cells allowed for intercellular junctional communication and contact normalization. b, contact-normalized tumor cells were separately harvested and analyzed for v-Src or β-actin by Western blot analysis (20 μg/lane). c, each cell layer from the contact normalized configuration was separately harvested and analyzed by RT-PCR to detect mRNA encoding hygromycin phosphotransferase (Hygro; conferring hygromycin resistance to nontransformed cells), puromycin acetyltransferase (Puro; conferring puromycin resistance to transformed cells), or GAPDH (as a control). v-Src protein and puromycin acetyltransferase mRNA were retained in the transformed cell preparations, whereas hygromycin phosphotransferase mRNA was retained in the nontransformed cell preparations. Although RT-PCR data are only shown from nontransformed cells plated alone, all nontransformed cells in this system contained hygromycin phosphotransferase mRNA levels similar to nontransformed cells plated alone and no detectable puromycin acetyltransferase mRNA.
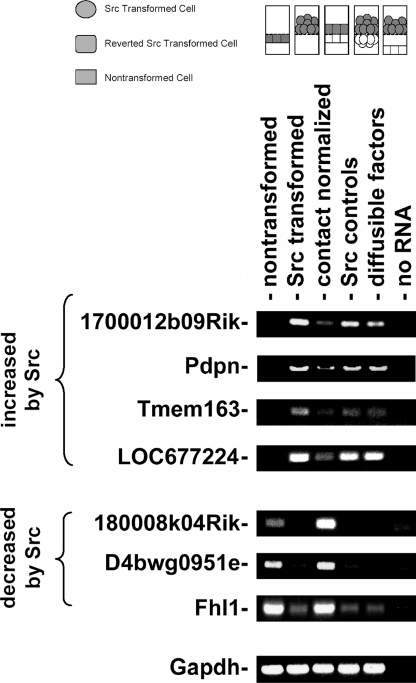
FIGURE 2.
RT-PCR analysis of the effects of Src and contact normalization on the expression of several genes. Src-transformed cells were cultured on porous membranes directly above nontransformed cells (contact normalized), directly above another layer of transformed cells (Src controls), or 1 mm above nontransformed cells (diffusible factors). Nontransformed and Src-transformed cells were also plated alone. Each cell layer was separately harvested and analyzed by RT-PCR to detect mRNA species as indicated. A control lane from reaction without reverse transcriptase is also indicated.
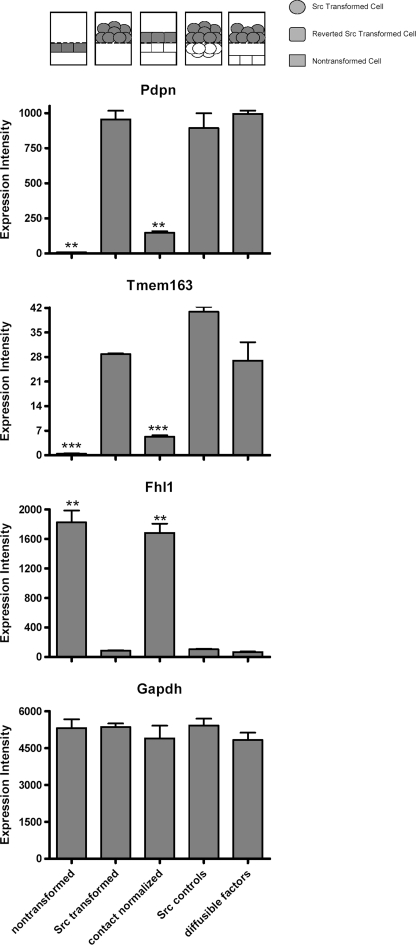
FIGURE 3.
Effects of Src and contact normalization on Pdpn, Tmem163, Fhl1, and GAPDH mRNA expression examined by microarrays. Src-transformed cells were cultured on porous membranes directly above nontransformed cells (contact normalized), directly above another layer of transformed cells (Src controls), or 1 mm above nontransformed cells (diffusible factors). Nontransformed and Src-transformed cells were also plated alone. Each cell layer was separately harvested and analyzed by Affymetrix expression microarrays to detect mRNA species as indicated. Data are shown as expression intensity from microarray analysis (mean ± S.E., n = 2). Configuration of cells in the layered culture system is presented on the top of the histograms, with the target cells filled in gray. Double and triple asterisks indicate p < 0.01 and p < 0.001 compared with Src-transformed cells by t test, respectively.
We utilized Affymetrix microarrays to identify genes involved in contact normalization. About 45,000 probe sets were examined, representing >39,000 transcripts. The expression of genes represented by 10928 probe sets, or up to about 25% of the transcriptome, was affected 2-fold or more by transforming Src kinase activity. The expression of genes represented by up to 5560 probe sets was higher in Src-transformed cells than nontransformed cells, whereas the expression of genes represented by up to 5368 probe sets was lower. However, the expression of only 39 genes was found to be significantly affected during contact normalization of Src-transformed cells (see Table 1). The mRNA levels of several of these genes, including Pdpn, Tmem163, Fhl1, and 5 expressed sequence tags were verified by RT-PCR as shown in Fig. 2.
TABLE 1.
Genes affected by contact normalization of Src transformed cells
| Symbol | Probe sets | Fold change |
Gene name | |
|---|---|---|---|---|
| Srca | CNb | |||
| Genes increased by Src and decreased during contact normalization | ||||
| 1700012B09Rikc | 1428984_a_at | 115 | −3.4 | RIKEN cDNA 1700012B09 gene |
| Pdpnc | 1419309_at | 93 | −4.7 | Podoplanin |
| Tmem163c | 1428077_at | 58 | −5.5 | Transmembrane protein 163 |
| Smoc2 | 1415935_at | 47 | −6.6 | SPARC-related modular calcium binding 2 |
| Pstpip2 | 1421410_a_at | 41 | −4.5 | Proline-serine-threonine phosphatase-interacting protein 2 |
| Mal | 1417275_at | 30 | −5.6 | Myelin and lymphocyte protein |
| Lepr | 1425644_at | 28 | −4.7 | Leptin receptor |
| Elavl2 | 1421883_at | 26 | −9.9 | Embryonic lethal abnormal vision-like 2 |
| Igsf11 | 1460607_at | 26 | −5.0 | Immunoglobulin superfamily, member 11 |
| Mafb | 1451715_at | 14 | −6.7 | v-Maf protein B |
| LOC677224c | 1435703_at | 13 | −3.5 | Similar to RIKEN cDNA 2810457I06 |
| 4930408O21Rikc | 1431741_a_at | 8.8 | −4.8 | RIKEN cDNA 4930408O21 gene |
| Elmod1 | 1457223_at | 8.3 | −5.0 | ELMO domain-containing 1 |
| Atp13a4 | 1438707_at | 7.8 | −4.7 | ATPase type 13A4 |
| Kdr | 1449379_at | 6.6 | −3.7 | Kinase insert domain protein receptor |
| C9 | 1422815_at | 5.4 | −4.9 | Complement component 9 |
| Genes decreased by Src and increased during contact normalization | ||||
| Fgf7 | 1438405_at | −130 | 46 | Fibroblast growth factor 7 |
| D10Bwg1379e | 1435050_at | −95 | 13 | DNA segment Chr 10 Brigham and Women's Genetics 1379 expressed |
| Sox11 | 1431225_at | −93 | 16 | SRY box-containing gene 11 |
| Ccl20 | 1422029_at | −91 | 12 | Chemokine (C-C motif) ligand 20 |
| Vcam1d | 1448162_at | −78 | 22 | Vascular cell adhesion molecule 1 |
| 1415989_at | −56 | 16 | ||
| 1451314_a_at | −55 | 12 | ||
| Sema3e | 1427673_a_at | −71 | 8.3 | Semaphorin 3E |
| Sdprd | 1416779_at | −47 | 13 | Serum deprivation response |
| 1416778_at | −39 | 11 | ||
| Epha4 | 1429021_at | −44 | 8.3 | Eph receptor A4 |
| Ntn1 | 1454974_at | −42 | 17 | Netrin 1 |
| Cabc1 | 1417066_at | −32 | 5.0 | Chaperone, ABC1 activity of bc1 complex like (Schizosaccharomyces pombe) |
| Spry1 | 1415874_at | −26 | 4.5 | Sprouty homolog 1 (Drosophila) |
| Loxl1 | 1451978_at | −25 | 9.9 | Lysyl oxidase-like 1 |
| 1810008K04Rikc | 1441254_at | −19 | 9.0 | RIKEN cDNA 1810008K04 gene |
| Pdgfrb | 1436970_a_at | −18 | 3.9 | Platelet-derived growth factor receptor β polypeptide |
| D4Bwg0951ec | 1428384_at | −17 | 4.2 | DNA segment Chr 4 Brigham and Women's Genetics 0951 expressed |
| Fhl1c,d | 1417872_at | −16 | 11 | Four and a half LIM domains 1 |
| Gpr126 | 1437408_at | −16 | 5.7 | G protein-coupled receptor 126 |
| 1437409_s_at | −13 | 5.7 | ||
| Egfr | 1435888_at | −16 | 5.2 | Epidermal growth factor receptor |
| Itih2 | 1417618_at | −12 | 7.3 | Inter-α-trypsin inhibitor heavy chain 2 |
| Epb4.1l3 | 1419062_at | −12 | 5.6 | Erythrocyte protein band 4.1-like 3 |
| Il1rl1 | 1425145_at | −9.7 | 8.3 | Interleukin 1 receptor-like 1 |
| Wnt5a | 1448818_at | −9.1 | 4.6 | Wingless-related MMTV integration site 5A |
| Tmem56 | 1434553_at | −8.2 | 4.4 | Transmembrane protein 56 |
a Expression in Src-transformed cells divided by expression in nontransformed cells.
b Expression in transformed cells divided by expression in transformed cells undergoing contact normalization.
c Effects confirmed by RT-PCR (see Fig. 1).
d Genes previously shown to be induced by contact normalization.
As shown in Table 1, the expression of 23 genes was suppressed by Src and increased by contact normalization. Some of these genes encode proteins that mediate events including growth factor signaling (Fgf7, Epha4, Spry1, Pdgfrb, Gpr126, Egfr, Wnt5a, and Il1rl1) and transcription (Sox11 and Fhl1). Many of these genes have been implicated in the regulation of tumor cell growth and migration. For example, recent experiments indicate that Epb4.1l3 (erythrocyte protein band 4.1-like 3) (19) and Itih2 (inter-α-trypsin inhibitor heavy chain) (20) can suppress tumor cell invasion and metastasis. Induction of three of these genes, Vcam1, Sdpr, and Fhl1, has been previously associated with contact normalization (13). Interestingly, these genes are candidate biomarkers that are suppressed in malignant tumor cells (14). For example, Src utilizes Cas to suppress Fhl1 expression to promote tumor cell migration (12).
The expression of 16 genes was increased by Src and suppressed by contact normalization. These genes are of great interest because they may be required for malignant growth and metastasis. These genes encode proteins that mediate events including cation (Smoc2, Atp13a4) and glutamate (Tmem163) transport, neuronal development (Mal), energy homeostasis (Lepr), mRNA transcription (Mafb) and stabilization (Elavl2), cell adhesion (Igsf11), growth factor signaling (Kdr), immunological activity (C9), and cell migration (Pdpn). Some of these gene products may act as biomarkers and targets for chemotherapy. For example, inhibitors have been generated to target kinase insert domain receptor (Kdr) to prevent VEGF signaling and suppress angiogenesis required for malignant tumor growth (21). Immunological reagents have also been targeted to immunoglobulin superfamily 11 (IGSF11) (22) and Pdpn (23) to prevent tumor cell invasion and metastasis.
Src Increases Pdpn Expression in Transformed Cells
We have found previously that Src suppresses Fhl1 expression to promote tumor cell migration and that this effect is reversed during contact normalization (12, 14). As shown in Fig. 3, our data are consistent with these previous reports. Fhl1 mRNA expression was decreased by >10-fold in Src-transformed cells compared with nontransformed cells. In addition, contact normalization increased Fhl1 mRNA levels to those seen in nontransformed cells. Moreover, direct contact with other Src-transformed cells or diffusible factors from nontransformed cells did not significantly affect Fhl1 mRNA expression in transformed cells (see Fig. 3).
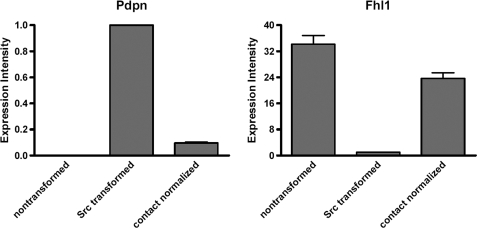
In contrast to Fhl1, Src increased the expression of Pdpn, which is a membrane-bound extracellular glycoprotein that associates with endogenous ligands to promote cell motility leading to tumor cell invasion and metastasis (8–10). As shown in Fig. 3, Src increased Pdpn mRNA expression by nearly 10-fold. In addition, contact normalization decreased Pdpn mRNA expression in transformed cells by about 80%. As with Fhl1, contact with other Src-transformed cells, or diffusible factors from nontransformed cells, did not significantly affect Pdpn expression in transformed cells (see Fig. 3). As shown in Fig. 4, the effects of Src transformation and contact normalization on Fhl1 and Pdpn mRNA expression were confirmed by qRT-PCR, as well as standard RT-PCR shown in Fig. 3.
FIGURE 4.
qRT-PCR analysis of the effects of Src transformation and contact normalization on the expression of Pdpn and Fhl1 mRNA. mRNA transcripts encoding Pdpn and Fhl1 from nontransformed cells, Src-transformed cells, and contact-normalized transformed cells were examined by qRT-PCR. Values were standardized to GAPDH as an internal control and are shown as expression intensities relative to Src-transformed cells that were normalized to a value of 1.0 (mean ± S.E. (error bars), n = 4).
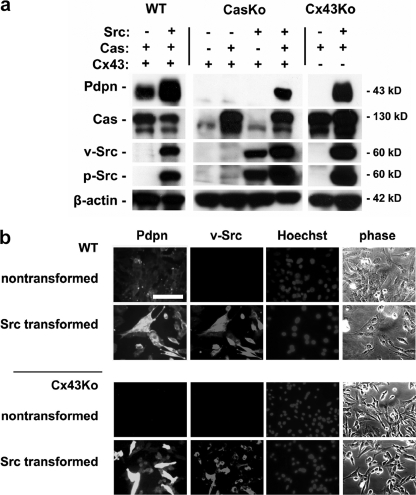
As predicted by mRNA analysis, transforming Src kinase activity increased Pdpn protein expression. Because the gap junction protein Cx43 can affect transformed cell migration (24, 25), the effects of Src on Pdpn expression were analyzed in Cx43Ko and wild type cells. Western blotting, shown in Fig. 5a, revealed that Src augmented Pdpn protein expression in both cell types. These findings were confirmed by immunofluorescence microscopy as shown in Fig. 5b.
FIGURE 5.
Src utilizes Cas to augment Pdpn protein expression in transformed cells. a, protein from nontransformed and Src-transformed Cx43Ko cells, CasKo cells transfected with Cas or parental vectors, and wild type (WT) cells was analyzed by Western blotting to detect Pdpn, v-Src, active Src, Cas, and β-actin. b, Pdpn, Src, and nuclei were visualized by immunofluorescence microscopy in nontransformed and Src-transformed wild type and Cx43Ko cells. Differential interference contrast images are also shown. Scale bar, 100 μm.
Src Augments Pdpn Expression to Promote Cell Migration
The effects of Src on Pdpn expression are intriguing because Pdpn can promote tumor cell migration leading to malignant and metastatic growth (9, 23, 26). We have found previously that Src utilizes Cas to suppress Fhl1 expression to promote nonanchored cell growth and migration of transformed cells (12). Therefore, the effects of Src on Pdpn expression were examined in cells with and without Cas. As shown in Fig. 5a, more Pdpn was found in Src-transformed CasKo cells transfected with Cas than control transfectants. These data indicate that Src utilizes Cas to augment Pdpn expression and promote tumor cell migration.
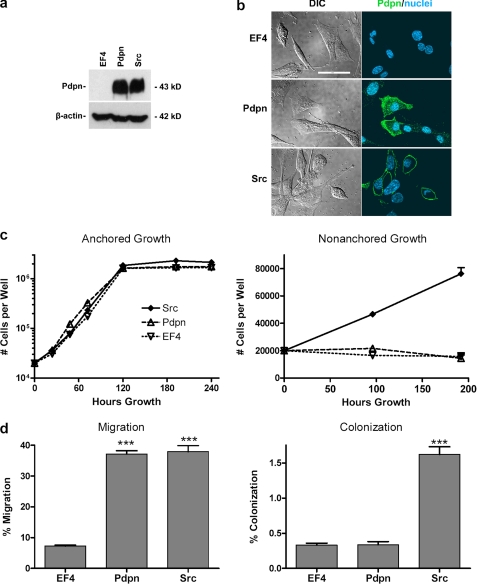
The effects of Pdpn on cell motility were also examined by transfection with cDNA. Western blot analysis, shown in Fig. 6a, demonstrates that nontransformed cells transfected with cDNA encoding Pdpn expressed Pdpn protein levels comparable with Src-transformed cells. Immunofluorescent microscopy, shown in Fig. 6b, found Pdpn localized to the plasma membrane where it may act as a signaling receptor (9, 23, 27). Pdpn expression did not significantly affect the growth or anchorage dependence of nontransformed cells (Fig. 6c). However, as shown in Fig. 6d, Pdpn expression did augment the ability of nontransformed cells to migrate by >5-fold, achieving levels comparable with Src-transformed cells. Thus, Pdpn did not require transforming Src activity to promote cell migration. Nonetheless, because Pdpn did not augment nonanchored growth (Fig. 6c), it was not sufficient to increase colonization of nontransformed cells, as assayed by the ability of cells to migrate through porous membranes and dissociate from the membranes to attach and grow on the well 1 mm under the membranes as shown in Fig. 6d.
FIGURE 6.
Pdpn expression is sufficient to increase migration of nontransformed cells. a, protein from nontransformed Cx43Ko cells transfected with cDNA encoding Pdpn, the empty parental vector (EF4), or v-Src was examined by Western blotting to detect Pdpn or β-actin. b, Pdpn (green) and nuclei (blue) were visualized by confocal immunofluorescence microscopy. Differential interference contrast images are also shown. Scale bar, 50 μm. c, cells (20,000/well) were cultured in anchored or nonanchored conditions and counted at the time points indicated. Data are shown as the number of cells/well (mean ± S.E. (error bars), with n = 2 for anchored growth and n = 4 for nonanchored growth). d, cells were plated on porous membranes and counted 24 h later. Migration was quantitated as the percent of cells that migrated from the top of the membrane to the bottom of the membrane, whereas colonization was quantitated as the percent of cells that migrated to the well beneath the membrane (mean ± S.E. (error bars), n = 3). Triple asterisks denote p < 0.001 compared with control transfectants by t test.
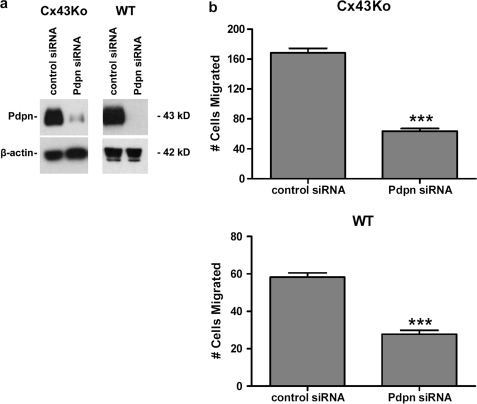
The effects of Pdpn on the motility of Src-transformed cells were examined by transfection with siRNA. As shown in Fig. 7a, Pdpn protein expression was decreased in Src-transfected cells transfected with siRNA directed against Pdpn. Wound-healing assays, shown in Fig. 7b and supplemental Fig. 1, indicate that this decrease in Pdpn expression reduced the migration of Src-transformed cells by >60%. These data indicate that Src induces Pdpn expression to promote cell migration. However, incomplete suppression of transformed cell migration by Pdpn siRNA also suggests that factors other than Pdpn can increase cell motility.
FIGURE 7.
Pdpn expression is required to promote migration of transformed cells. a, protein from Src-transformed Cx43Ko or wild type (WT) cells transfected with control siRNA or siRNA directed against Pdpn was examined by Western blotting to detect Pdpn or β-actin. b, cell migration was analyzed by wound healing and quantitated as the number of cells to enter a 1.8-mm2 area in the middle of the wound in 24 h (mean ± S.E., n = 4). Triple asterisks denote p < 0.0001 compared with control transfectants by t test.
DISCUSSION
Nontransformed cells can force tumor cells to assume a normal morphology and phenotype by the process of contact normalization (1, 2, 28). Contact normalization is a powerful process. For example, transformed keratinocytes that comprise up to 4% of epidermal volume can be controlled in human skin for decades (29). We sought to identify genes expressed by transformed cells that are not controlled by contact normalization to elucidate novel mechanisms that lead to tumor cell invasion and metastasis.
Src-transformed cells were used to create a model system for these assays. Src is a clinically relevant oncogenic kinase that phosphorylates Cas to promote tumor cell migration (4, 6, 7, 30, 31). We have previously utilized Affymetrix U74 expression arrays to analyze the effects of contact normalization on the expression of about 14,000 genes (13). In the present assays, we utilized more advanced (Affymetrix 431) expression arrays to achieve a more reliable and comprehensive analysis of the transcriptome. Although approximately 25% of ∼39,000 transcripts examined by these arrays were affected by transforming Src kinase activity, only 39 of these, representing approximately 0.01% of the transcriptome, were affected by contact normalization.
In addition to confirming our previous findings that Src inhibits the expression of the potential tumor suppressors Fhl1, Sdpr, and Vcam1, which are induced by contact normalization (13), the present data have identified additional candidate tumor suppressors, as well as potential tumor promoters. Most notably, we found that Src utilized Cas to induce Pdpn expression and that Pdpn expression was suppressed during contact normalization of Src-transformed cells. These data are consistent with reports of Fos, a component of the AP1 transcription factor acting downstream of tumor promoters, including TPA and Src, inducing Pdpn during skin carcinogenesis (32).
Pdpn is a well characterized biomarker that can promote tumor cell invasion and metastasis (8–10). Indeed, our data indicate that Pdpn signaling is both necessary and sufficient to promote tumor cell migration. Pdpn is found at the invasive front of many types of tumors, which is consistent with its role in promoting malignant invasion (9, 27).
Compounds that prevent interaction between Pdpn and its natural ligand(s) can effectively inhibit tumor cell migration (9, 33). Clec-2 has been reported to associate with Pdpn and increase tumor cell migration, and antiserum that blocks binding of Clec-2 to Pdpn can suppress tumor cell metastasis (23). However, microarray analysis indicated that the cells used in our study did not express Clec-2 (data not shown), which is normally expressed by platelets (23).
Taken together, our data indicate that Pdpn acts downstream of Src and Cas to promote cell migration. This study presents an example of how genes that are induced by Src and suppressed by contact normalization can be utilized as biomarkers and promising targets for chemotherapy. For example, we have previously reported that Src utilizes Cas to suppress Fhl1 expression, which can be induced by contact normalization and suppress tumor cell migration (12–14). On the other side of the coin, our data indicate that Src induces the expression of genes that are suppressed by contact normalization and promote tumor cell migration. In addition to Pdpn, these genes, exemplified by Kdr and Igsf11, may serve as biomarkers and chemotherapeutic targets. Kdr, which is also called Vefgr2, is a receptor for Vegfa (34), and can be targeted to prevent VEGF signaling and suppress angiogenesis required for malignant tumor growth (21). Antisera directed against IGSF11 can also be used to prevent tumor cell invasion and metastasis (22).
In addition to known genes, this strategy has also identified genes involved in contact normalization that have not yet been annotated (see Table 1), and, like Pdpn and Kdr, may also encode transmembrane proteins that can be targeted by chemotherapeutic reagents. For example, Tmem163 expression was elevated in Src-transformed cells, but decreased by contact normalization. Interestingly, elevated Tmem163 mRNA expression has also been found in papillary thyroid carcinoma (Gene Expression Omnibus data set GDS1732/1552626) and nodular lymphocyte-predominant Hodgkin lymphoma (35). Tmem163 is predicted to form an integral membrane protein with six transmembrane helices. In addition to mRNA analysis shown in Figs. 2 and 3, Western blotting experiments indicate that Tmem163 protein expression was elevated in transformed cells and nontransformed cells transfected with Tmem163 cDNA. Moreover, Tmem163 transfectants grew nearly twice as fast and migrated several times the rate of control transfectants (see supplemental Figs. 2 and 3). Thus, the study of genes affected by Src and contact normalization should help elucidate mechanisms that underlie tumor cell growth and migration.
Supplementary Material
Acknowledgments
We thank Xun Li and Richard Gordan for help with cell culture and Michael Law for help with qRT-PCR.
This work was supported, in whole or in part, by National Institutes of Health Grant CA88085 (to G. S. G.). This work was also supported by the Department of Molecular Biology, the Research Foundation of the University of Medicine and Dentistry of New Jersey, and by a grant-in-aid for Scientific Research on Priority Areas from the Ministry of Education, Culture, Sports, Science and Technology of Japan (to H. I.).

The on-line version of this article (available at http://www.jbc.org) contains supplemental Figs. 1–3.
- Cas
- Crk-associated substrate
- CasKo
- Cas knock-out
- Pdpn
- podoplanin
- siRNA
- small interfering RNA
- RT
- reverse transcription
- GAPDH
- glyceraldehyde-3-phosphate dehydrogenase.
REFERENCES
- 1.Rubin H. (2006) Bioessays 28, 515–524 [DOI] [PubMed] [Google Scholar]
- 2.Rubin H. (2008) Adv. Cancer Res. 100, 159–202 [DOI] [PubMed] [Google Scholar]
- 3.Yeatman T. J. (2004) Nat. Rev. Cancer 4, 470–480 [DOI] [PubMed] [Google Scholar]
- 4.Honda H., Oda H., Nakamoto T., Honda Z., Sakai R., Suzuki T., Saito T., Nakamura K., Nakao K., Ishikawa T., Katsuki M., Yazaki Y., Hirai H. (1998) Nat. Genet. 19, 361–365 [DOI] [PubMed] [Google Scholar]
- 5.Klemke R. L., Leng J., Molander R., Brooks P. C., Vuori K., Cheresh D. A. (1998) J. Cell Biol. 140, 961–972 [DOI] [PMC free article] [PubMed] [Google Scholar]
- 6.Goldberg G. S., Alexander D. B., Pellicena P., Zhang Z. Y., Tsuda H., Miller W. T. (2003) J. Biol. Chem. 278, 46533–46540 [DOI] [PMC free article] [PubMed] [Google Scholar]
- 7.Brábek J., Constancio S. S., Siesser P. F., Shin N. Y., Pozzi A., Hanks S. K. (2005) Mol. Cancer Res. 3, 307–315 [DOI] [PubMed] [Google Scholar]
- 8.Scholl F. G., Gamallo C., Vilaró S., Quintanilla M. (1999) J. Cell Sci. 112, 4601–4613 [DOI] [PubMed] [Google Scholar]
- 9.Wicki A., Christofori G. (2007) Br. J. Cancer 96, 1–5 [DOI] [PMC free article] [PubMed] [Google Scholar]
- 10.Martín-Villar E., Megias D., Castel S., Yurrita M. M., Vilaró S., Quintanilla M. (2006) J. Cell Sci. 119, 4541–4553 [DOI] [PubMed] [Google Scholar]
- 11.Patwardhan P., Shen Y., Goldberg G. S., Miller W. T. (2006) J. Biol. Chem. 281, 20689–20697 [DOI] [PMC free article] [PubMed] [Google Scholar]
- 12.Shen Y., Jia Z., Nagele R. G., Ichikawa H., Goldberg G. S. (2006) Cancer Res. 66, 1543–1552 [DOI] [PubMed] [Google Scholar]
- 13.Alexander D. B., Ichikawa H., Bechberger J. F., Valiunas V., Ohki M., Naus C. C., Kunimoto T., Tsuda H., Miller W. T., Goldberg G. S. (2004) Cancer Res. 64, 1347–1358 [DOI] [PubMed] [Google Scholar]
- 14.Li X., Jia Z., Shen Y., Ichikawa H., Jarvik J., Nagele R. G., Goldberg G. S. (2008) Cancer Sci. 99, 1326–1333 [DOI] [PMC free article] [PubMed] [Google Scholar]
- 15.Shen Y., Khusial P. R., Li X., Ichikawa H., Moreno A. P., Goldberg G. S. (2007) J. Biol. Chem. 282, 18914–18921 [DOI] [PubMed] [Google Scholar]
- 16.Goldberg G. S., Moreno A. P., Lampe P. D. (2002) J. Biol. Chem. 277, 36725–36730 [DOI] [PubMed] [Google Scholar]
- 17.Rubin H. (2007) Adv. Cancer Res. 98, 117–147 [DOI] [PubMed] [Google Scholar]
- 18.Li X., Shen Y., Ichikawa H., Antes T., Goldberg G. S. (2009) Oncogene 28, 4272–4283 [DOI] [PubMed] [Google Scholar]
- 19.Cavanna T., Pokorná E., Veselý P., Gray C., Zicha D. (2007) J. Cell Sci. 120, 606–616 [DOI] [PubMed] [Google Scholar]
- 20.Werbowetski-Ogilvie T. E., Agar N. Y., Waldkircher de Oliveira R. M., Faury D., Antel J. P., Jabado N., Del Maestro R. F. (2006) Cancer Res. 66, 1464–1472 [DOI] [PubMed] [Google Scholar]
- 21.Schenone S., Bondavalli F., Botta M. (2007) Curr. Med. Chem. 14, 2495–2516 [DOI] [PubMed] [Google Scholar]
- 22.Watanabe T., Suda T., Tsunoda T., Uchida N., Ura K., Kato T., Hasegawa S., Satoh S., Ohgi S., Tahara H., Furukawa Y., Nakamura Y. (2005) Cancer Sci. 96, 498–506 [DOI] [PMC free article] [PubMed] [Google Scholar]
- 23.Kato Y., Kaneko M. K., Kunita A., Ito H., Kameyama A., Ogasawara S., Matsuura N., Hasegawa Y., Suzuki-Inoue K., Inoue O., Ozaki Y., Narimatsu H. (2008) Cancer Sci. 99, 54–61 [DOI] [PMC free article] [PubMed] [Google Scholar]
- 24.Xu X., Francis R., Wei C. J., Linask K. L., Lo C. W. (2006) Development 133, 3629–3639 [DOI] [PubMed] [Google Scholar]
- 25.Shao Q., Wang H., McLachlan E., Veitch G. I., Laird D. W. (2005) Cancer Res. 65, 2705–2711 [DOI] [PubMed] [Google Scholar]
- 26.Nakazawa Y., Sato S., Naito M., Kato Y., Mishima K., Arai H., Tsuruo T., Fujita N. (2008) Blood 112, 1730–1739 [DOI] [PubMed] [Google Scholar]
- 27.Wicki A., Lehembre F., Wick N., Hantusch B., Kerjaschki D., Christofori G. (2006) Cancer Cell 9, 261–272 [DOI] [PubMed] [Google Scholar]
- 28.Glick A. B., Yuspa S. H. (2005) Semin. Cancer Biol. 15, 75–83 [DOI] [PubMed] [Google Scholar]
- 29.Jonason A. S., Kunala S., Price G. J., Restifo R. J., Spinelli H. M., Persing J. A., Leffell D. J., Tarone R. E., Brash D. E. (1996) Proc. Natl. Acad. Sci. U. S. A. 93, 14025–14029 [DOI] [PMC free article] [PubMed] [Google Scholar]
- 30.Bouton A. H., Riggins R. B., Bruce-Staskal P. J. (2001) Oncogene 20, 6448–6458 [DOI] [PubMed] [Google Scholar]
- 31.Chodniewicz D., Klemke R. L. (2004) Biochim. Biophys. Acta 1692, 63–76 [DOI] [PubMed] [Google Scholar]
- 32.Durchdewald M., Guinea-Viniegra J., Haag D., Riehl A., Lichter P., Hahn M., Wagner E. F., Angel P., Hess J. (2008) Cancer Res. 68, 6877–6883 [DOI] [PubMed] [Google Scholar]
- 33.Kunita A., Kashima T. G., Morishita Y., Fukayama M., Kato Y., Tsuruo T., Fujita N. (2007) Am. J. Pathol. 170, 1337–1347 [DOI] [PMC free article] [PubMed] [Google Scholar]
- 34.Olsson A. K., Dimberg A., Kreuger J., Claesson-Welsh L. (2006) Nat. Rev. Mol. Cell. Biol. 7, 359–371 [DOI] [PubMed] [Google Scholar]
- 35.Brune V., Tiacci E., Pfeil I., Döring C., Eckerle S., van Noesel C. J., Klapper W., Falini B., von Heydebreck A., Metzler D., Bräuninger A., Hansmann M. L., Küppers R. (2008) J. Exp. Med. 205, 2251–2268 [DOI] [PMC free article] [PubMed] [Google Scholar]
Associated Data
This section collects any data citations, data availability statements, or supplementary materials included in this article.


