Abstract
More than ten different approaches for improving the lower detection limit of polymeric membrane ion-selective electrodes have been suggested during the recent years. In this contribution, their principles are briefly summarized with a focus to their general practical applicability. The methods that are the most rugged and the easiest to implement in a routine laboratory will be highlighted.
Keywords: Polymeric membrane, Ion-selective electrodes, Lower detection limits
1. Introduction
In the course of less than ten years, tremendous advances have been achieved in the field of potentiometric trace analysis. The starting point was the discovery that the sensing membranes of conventional ion-selective electrodes (ISEs) contaminated the samples and massively deteriorated their lower detection limits and their selectivity behavior. Meanwhile, ISEs of massively improved performance have been developed for more than 10 analytes and research on sensors with improved lower detection limits is conducted in about 15 laboratories world-wide and has led, so far, to more than 50 scientific papers. While the general principles and the achieved improvements have been reviewed [1–4] the idiosyncrasies of the various techniques used to achieve them were, so far, not yet critically compared. Several practical applications of the sensors with improved lower detection limits have been published [5–8]. A number of different strategies have been proposed and implemented to achieve these improvements. The diversity of approaches may be confusing for a newcomer in the field of potentiometric trace analysis. Moreover, due to the steady progress, some of the earlier methods are no longer considered optimal. The goal of this review article is to present the different approaches and value them in terms of generality, ease of application, and ruggedness of the results. Possible pitfalls will be briefly mentioned and the most versatile ways to make high-performance ISEs will be pointed out.
3. Experimental
3.1. Reagents
The ionophores N,N,N′,N′-tetradodecyl-3,6-dioxaoctanedithioamide (ETH 5435) and N,N-dicyclohexyl-N′,N′-dioctadecyl-3-oxapentanediamide (ETH 5234), poly(vinyl chloride) (PVC), bis(2-ethylhexyl) sebacate (DOS), sodium tetrakis[3,5-bis-(trifluoromethyl)phenyl]borate (NaTFPB), tetradodecylammonium tetrakis(4-chlorophenyl)borate (ETH 500), tridodecylmethylammonium chloride, and tetrahydrofuran (THF) were all Selectophore®, tetraethylammonium nitrate (Et4NNO3) was puriss, and the other salts and disodium ethylendiamine tetraacetic acid (Na2EDTA) puriss. p.a. from Fluka (Buchs, Switzerland); the NaOH solution was Titrisol® from Merck (Darmstadt, Germany). Lithium tetrakis(pentafluorophenyl)borate (LiTpFPB) was a gift from the laboratory of Prof. P. Bühlmann (University of Minnesota). Aqueous solutions were prepared with freshly deionized water (specific resistance, >18 MΩ cm) from a NANOpure® reagent grade water system (Barnstead, Basel, Switzerland).
3.2. Ion-selective membranes and electrodes
The compositions of the membranes are listed in Table 1. The membrane components (totaling around 370 mg) were dissolved in THF (2.5 ml) during ca. 2 h and poured into a glass ring (37 mm i.d.) fixed on a glass plate and covered with another glass plate. After overnight evaporation of the solvent at room temperature, disks of 5 mm in diameter were punched from the master membrane (thickness, ca. 250 μm) and glued with a PVC/THF slurry to a plasticized PVC tubing mechanically fixed onto a 1000-μl pipette tip. The inner filling solutions were 1.0 × 10⁻³ M Na2EDTA with 1.0 × 10⁻⁴ M Cd(NO3)2 (Figure 4, left), 2.0 × 10⁻² M Et4NNO3 with 1.0 × 10⁻² M Cd(NO3)2 (Figure 4, right), 2.5 × 10⁻² M Et4NNO3 with 1.0 × 10⁻² M Cd(NO3)2 (Figure 10, left), 1.45 × 10⁻² M Et4NNO3 with 1.0 × 10⁻² M Cd(NO3)2 (Figure 10, right), and 10−3 CaCl2, 10–4 M NaCl, 5 × 10⁻² M Na2EDTA adjusted to pH 9.0 with 10−1 M NaOH (calculated activities of free Ca2+, 5.5 × 10⁻¹¹ M; Figure 11). Before measurements, the Cd2+-selective ISEs were conditioned for 1.5 d in 10−4 M Cd(NO3)2 and 1 d in 10−7 M Cd(NO3)2 containing 10−5 M NaNO3 as background. Between measurements, they were stored in the dark in 10−7 M Cd(NO3)2 containing the same background. The Ca2+-selective ISEs (Figure 11) were conditioned in a 10−1 M CaCl2 solution for 2 d.
Table 1.
Composition of the membranes.
| ISE | Ionophore mmol kg−1 | Lipophilic anionic site mmol kg−1 | ETH 500 mmol kg−1 | DOS wt % | PVC wt % |
|---|---|---|---|---|---|
| Figure 4 | ETH 5435, 16.44 | NaTFPB, 5.02 | 9.86 | 64.8 | 32.2 |
| Figure 10, left | ETH 5435, 15.82 | NaTFPB, 5.01 | 9.99 | 54.9 | 42.1 |
| Figure 10, right | ETH 5435, 15.70 | LiTpFPB, 4.63 | 10.11 | 53.8 | 43.3 |
| Figure 11 | ETH 5234, 13.62 | NaTFPB, 5.34 | – | 65.4 | 32.2 |
Fig. 4.
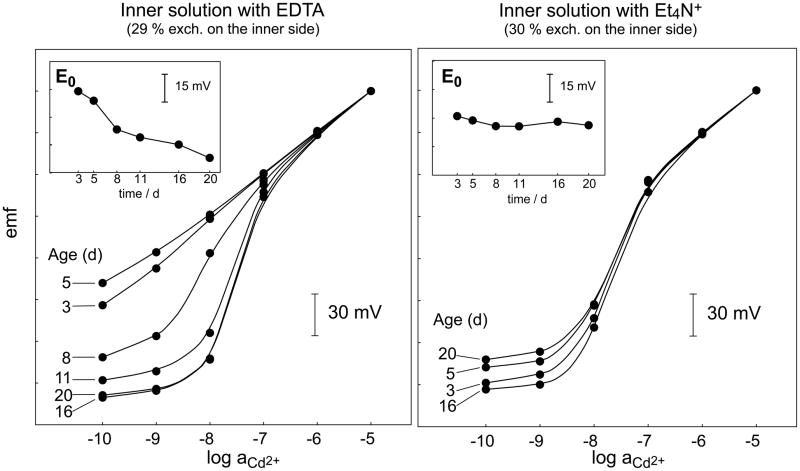
Reproducibility of calibration curves obtained with Cd(NO3)2 with 10−5 M NaNO3 as background over a period of 20 d with Cd2+-selective ISEs (see Experimental) whose inner solution contained EDTA (left panel) or tetraethylammonium chloride (Et4N+; right panel). Between measurements, the ISEs were stored in the dark in 10−7 M Cd(NO3)2 containing the same ionic background. Inserts: Long-term potential stabilities.
Fig. 10.
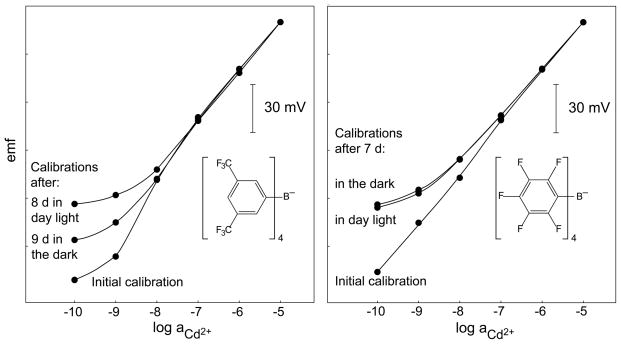
Calibration curves obtained in Cd(NO3)2 with 10−5 M NaNO3 as background electrolyte at pH 5.5 with two identical ISEs for each panel. The membranes contained tetrakis[3,5-bis(trifluoromethyl)phenyl]borate (TFPB−; left panel) or tetrakis(penta-fluorophenyl)borate (TpFPB−; right panel) as anionic sites. The inner solutions were 2.5 × 10⁻² M Et4NNO3 with 1.0 × 10⁻² M Cd(NO3)2 (18.8 % exchange of Cd2+ for Et4N+; left panel) and 1.45 × 10⁻² M Et4NNO3 with 1.0 × 10⁻² M Cd(NO3)2 (27.4 % exchange of Cd2+ for Et4N+; right panel). After recording the initial calibration curves, the ISEs were stored separately in 10−7 M Cd(NO3)2, one of each pairs in day light and the other in the dark, and then calibrations were made again.
Fig. 11.
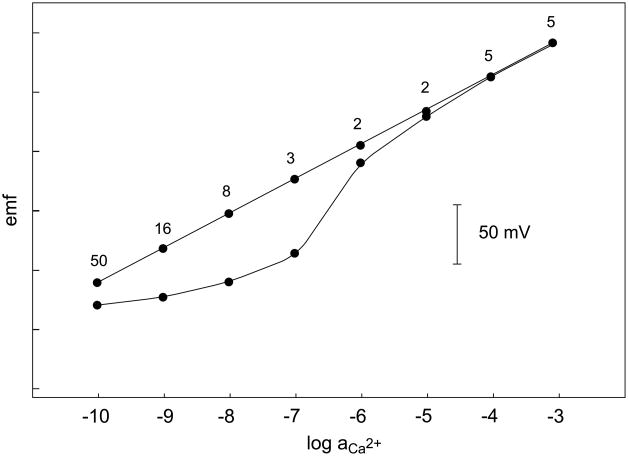
Calibration curves obtained by successive dilutions with a Ca2+-selective ISE having an inner solution with a buffered low activity of Ca2+ (see Experimental). Top curve: potential readings after 2–50 min (shown as labels), bottom curve: potential readings 30 min after each sample change.
3.3 EMF measurements
Measurements were performed with a 16-channel electrode monitor (Lawson Labs Inc., Malvern, USA) in magnetically stirred solutions. The electrodes were characterized at room temperature. If corrections were necessary, activity coefficients were calculated according to the Debye–Hückel approximation and EMF values were corrected for liquid-junction potentials with the Henderson equation. Sample pH values were determined with a Metrohm glass electrode (No. 6.0133.100, Metrohm AG, Herisau, Switzerland). The reference electrode was a Metrohm double junction Ag/AgCl type No. 6.0729.100 with 3 M KCl as reference electrolyte and 1 M NH4NO3 as bridge electrolyte.
4. Results and Discussion
4.1 The Bias
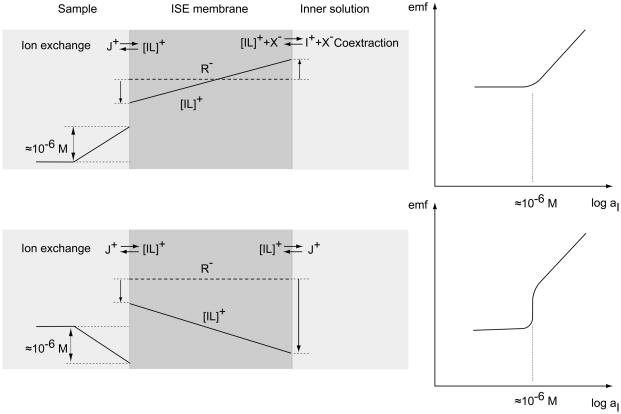
With conventional plasticized PVC-membranes, a zero-current flux of the primary ions from the membrane into the sample may maintain a local ion activity of as high as ca. 10−6 M in the sample layer at the membrane surface. It is caused by a transmembrane concentration gradient of primary ions. Such a gradient occurs whenever the membrane is not symmetrically bathed, i.e., when the compositions of the sample and the inner solution are not the same. If the concentration of the primary ions is decreasing toward the sample, it is increased by the ion flux; if the gradient has an opposite sign, it decreases. Both situations cause a less than optimal response (see Figure 1). The steady-state response of ISEs in the presence of zero-current ion fluxes has been successfully described by assuming that local ionic equilibrium is maintained at the membrane/solution interface [9–15]. The bias, i.e., the deviation of the concentration ci of the primary ions at the membrane surface (which is sensed) from that in the bulk (cbulk) of the sample is given by Eq. 1:
| (1) |
where D are the diffusion coefficients and d the thicknesses of the diffusion phases, “memb” refers to the membrane phase, “aq” to the unstirred layer of the sample, and [IL] is the concentration of the primary ion complex in the membrane adjacent to the sample or the inner solution ([IL]′). For simplicity, it is assumed that the ionophore L is in excess and forms strong complexes with the primary ion in the membrane. Direct evidence of enhanced ion concentrations near the membrane was obtained by scanning electrochemical microscopy [16].
Fig. 1.
Transmembrane concentration gradients of the primary ions and schematic response curves. The concomitant gradients of the interfering ions (J+) and/or coextractad anions (X−) are not shown. Top panel: A concentration profile decreasing toward the sample induces an enhanced primary ion concentration in its surface layer (around 10−6 M with conventional membranes) so that lower concentrations cannot be measured. Lower panel: If the concentration decreases toward the inner solution, sample ions are siphoned off. An apparently super-Nernstian response is observed at a critical concentration (around 10−6 M with conventional membranes) and the membrane is insensitive to further dilutions.
It is important to note that the bias can be positive (increased primary ion concentration) or negative (see Figure 1). In the latter case, the membrane siphons off analyte ions from the surface layer and an apparently super-Nernstian response is observed. The strategies of improving the response behavior of ISEs with liquid inner contact can be seen as influencing one of the parameters of the second term on the right of Eq. 1.
4.2 Compensation with External Current
One early approach made use of external current to compensate for the biasing zero-current ion fluxes [17–19]. While the method is fundamentally well understood [20], except in one more recent study Michalska [21], it has not been applied frequently and never for practical applications. The fundamental problem seems to be that the required external current depends on the composition of the sample. If an inappropriate value is used with an unknown sample, the results will likely be biased by the external current. So far, therefore, this interesting method cannot be used to determine concentrations in real samples for which the composition is not known.
4.3 Adjusting the Ionic Concentration at the Inner Side of the Membrane
In essence, the bias is generated by a transmembrane concentration gradient, which can be reduced by adjusting the concentration of the relevant ions at the inner membrane side to the value at the sample side, by decreasing the total ionic content, or by increasing the thickness of the membrane. The first approaches dealt with the adjustment of concentrations since even earlier, a rather high concentration of the primary ion salt was traditionally used as internal solution. This may lead to coextraction of the primary ions together with their hydrophilic counterions into the membrane containing an ionophore that forms strong complexes (Figure 1). The upper detection limit of polymeric membranes is reached when the coextracted amount of the primary ions is of the order of the ions initially present in the membrane (RT/z, with RT the total concentration of anionic sites and z the charge of the primary ions). Since, however, very small concentration differences of ≪ 1% of the total ionic concentration may induce relevant ion fluxes [9, 12] the coextraction becomes relevant already at concentrations far below the upper detection limit. To eliminate such effects, Mathison and Bakker diluted the inner solution of a K+-selective ISE and indeed observed an improvement of the lower detection limit [22]. A simple dilution of the inner solution did, however, not lead to excellent detection limit. The reason is a second gradient generating effect, namely the exchange of a small fraction of primary ions by interfering ones at the sample side of the membrane (Figure 1). Such an exchange eventually leads to the lower detection limit, which, according to the usual definition [23, 24], is achieved for ions of the same charge when 50% of the primary ions is replaced by interfering ions [25]. Since this detection limit, which is a direct function of the selectivity coefficients and the composition of the background electrolyte, does not depend on ion fluxes, it has been termed as “static lower detection limit” [4]. However, the replacement of a very small fraction of ≪ 1% of the total ionic concentration may induce relevant ion fluxes and therefore the ion exchange process influences ion fluxes already at much higher concentration than the static lower detection limit. These fluxes then eventually define the dynamic lower detection limit, which is always less good than the static one (cf. Figure 2, [4]).
Fig. 2.
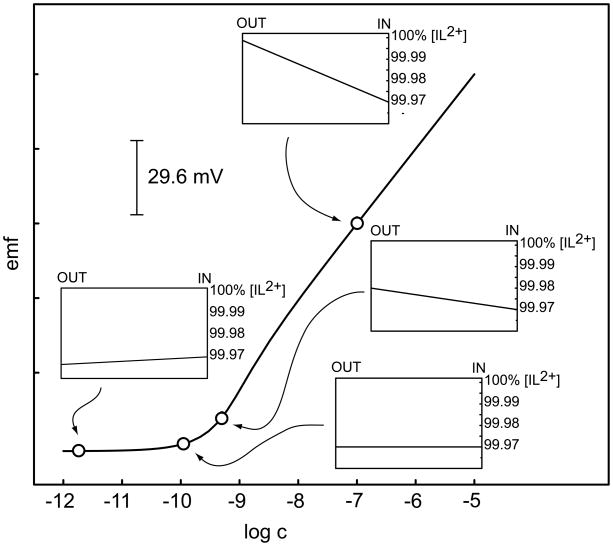
Calculated electrode response curve for a I2+-selective polymer membrane electrode at pH 7.0 with , RT = 5 mM, and q = 0.001 (cf. [2]). The static lower detection limit would be 10−17 M ((107)2 × 10⁻³). The inner solution is designed to induce a small net ion-exchange with interfering ions at the inner side of the membrane. At cI = 10−7 M, the concentration gradient within the membrane has no apparent effect on the observed potential since the sample is sufficiently concentrated. The maximum deviation from Nernst response is shown with sample cI = 10−9.3 M. Here, the inward flux depletes the sample phase boundary phase so that the concentration at the membrane surface is just half that of the sample bulk. At cI = 10−9.9 M, the same portion of I2+ is exchanged at both sides of the membrane so that no gradient is present and the emf response lies perfectly on the Nernst response curve. Further dilution of the sample leads to an outward flux of ions that completely dictates the response behavior of the electrode (see cI = 10−11.8 M).
Originally, an ion buffer such as EDTA or NTA was added to the inner solution to improve the lower detection limit of the ISE membane [26] and this method has been used by different groups later on [27–30]. It is important to note that in the absence of a sufficiently high concentration of an interfering ion the presence of an ion buffer in the inner solution does not necessarily bring about an improvement of the detection limit [31]. The ratio of the primary ion concentration in the presence ([ILn]) and in the absence ([ILn]o = RT/z) of interfering ions can be estimated from the Nicolsky equation for ions of the same charge (Eq. 2) and from the corresponding extended formalism [25, 32] if monovalent and divalent ions are simultaneously present (Eq. 3, cf. [14, 15]).
| (2) |
| (3) |
These equations are based on the assumption that strong complexes are formed with an ionophore that is present in excess in the membrane and do not take into account ion pair formation. Since they only contain measurable parameters, a rational design of the inner solution is possible once the relevant selectivity coefficients have been determined [14, 15]. An experimental control of remaining ion fluxes is possible by measuring the influence of stirring or the speed of rotation with rotating disc ISEs [33] on the EMF signal (Figure 3).
Fig. 3.
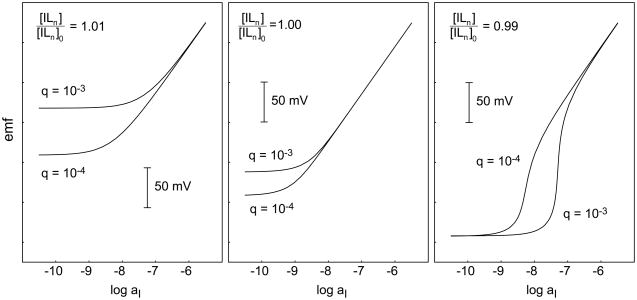
Calculated EMF responses (cf. [33]) of ion-selective electrodes with different inner solution compositions, shown for two values of q (Eq 1). Left: The inner solution leads to a 1% increase in the primary ion concentration at the inner membrane side. The concomitant leaching of primary ions into the sample is reduced by reducing q (faster stirring). Right: The inner solution leads to a 1% decrease in the primary ion concentration at the inner membrane side. The concomitant uptake of primary ions from the sample into the membrane leads to a super-Nernstian step, which is shifted to lower concentrations by reducing q (faster stirring). Middle: Even if [ILn] = [ILn]0 at the inner membrane side, at low sample ion concentrations a concentration gradient emerges and induces an outward flux of primary ions, which is reduced by stronger stirring. Generally, the sign of potential change upon increasing the stirring rate is characteristic of the direction of primary ion fluxes in a given situation.
Since complexing agents are not available for all relevant ions (e.g., for alkali metal cations), ion exchange resins were also used to maintain a constant low concentration of the primary ions in the inner solution [33–35]. In fact, neither a complexing agent nor an ion exchange resin would be required if the concentration of the primary ions were high enough (≥ ca. 10−5 M) to be approximately constant also in the presence of ion fluxes [36]. However, since the ISE membranes for trace analysis are very selective, the required concentration of the interfering ions to achieve a relevant exchange of primary ions in the membrane would be, in general, prohibitively high. A possibility is to use alkylammonium such as tetraethylammonium salts in the inner solution, which, due to their lipophilicity, are strongly interfering even for membranes containing highly selective ionophores [7]. Long-term potential instabilities have been repeatedly observed with complexing agents such as EDTA in the inner solution, probably due to their extraction into the membrane [15]. With ion exchange resins, the exact composition of the inner solution and its long-term stability may be biased by changes in the capacity and selectivity of the resin due to swelling [37]. None of these problems occur with strongly interfering ions as components of the inner solution. The improvement of the long-term stability through replacing EDTA by tetraethylammonium chloride in the inner solution of a Cd2+ ISE is documented by Figure 4.
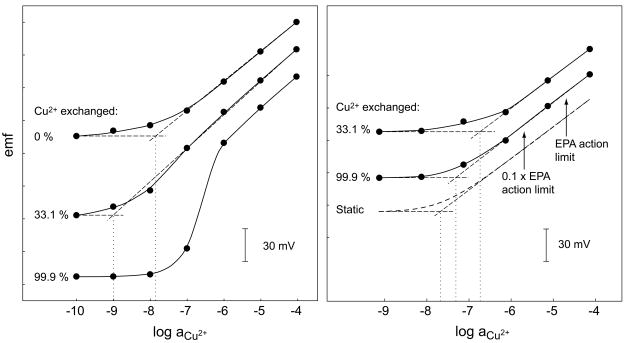
Whatever method is used, the adjustment of the inner solution alone is not sufficient to achieve optimal performance of an ISE. It must be kept in mind that the inner solution is just optimal for a single sample composition and a new sample is likely to induce a concentration gradient (cf. Figure 2). Nevertheless, it is worth selecting an inner solution that balances the ion exchange brought about by a typical sample. It must be noted that different applications may require different compositions of the inner solution. This is demonstrated in Figure 5 with a Cu2+-selective electrode with different inner solutions [7]. With 10−5 NaCl and pH 6.6 as ionic background, the inner solution that leads to a calculated exchange of 33.1% Cu2+ by (Et4)N+ on the inner membrane side is optimal while the inner solution inducing an exchange of 99.9% of Cu2+ leads to a strongly super-Nernstian response below 10−6 M Cu2+ (Figure 5. left). However, the latter inner solution is optimal when measuring Cu2+ at pH 5.5 with an ionic background typical for drinking water samples (Figure 5, right). This can be understood by considering that in such samples the static lower detection limit is as high as 10−7.7 M so that at sample concentrations <10−6 M a significant amount of Cu2+ is replaced by interfering ions on the sample side of the membrane. With NaCl as a background, much less Cu2+ is replaced by Na+ so that this inner solution induces a concentration profile of the primary ions that strongly decreases toward the inner solution.
Fig. 5.
Left: Calibration curves obtained with Cu2+-selective ISEs with Cu(NO3)2 containing 10−5 M NaCl as background electrolyte at a pH of ca. 6.6. The inner solution is 10−4 M Cu(NO3)2 with different concentrations of tetraethylammonium nitrate to maintain the exchange of Cu2+ for Et4N+ as indicated. Right: Calibration curves obtained with the same ISEs in Cu(NO3)2 solutions having a cationic background typical of drinking water, i.e., 1.3 × 10⁻³ M Ca2+, 3.1 × 10⁻⁴ M Mg2+, 2.2 × 10⁻⁴ M Na+, and 3.3 × 10⁻⁵ M K+. The pH was adjusted to 5.5 with 0.1 M HNO3. Arrows show the action limit and 0.1 of it following the norms by the U.S. Environmental Protection Agency (EPA). The response functions calculated according to the static model are shown with dashed lines (cf. [7]).
4.4 Increasing the Membrane Thickness
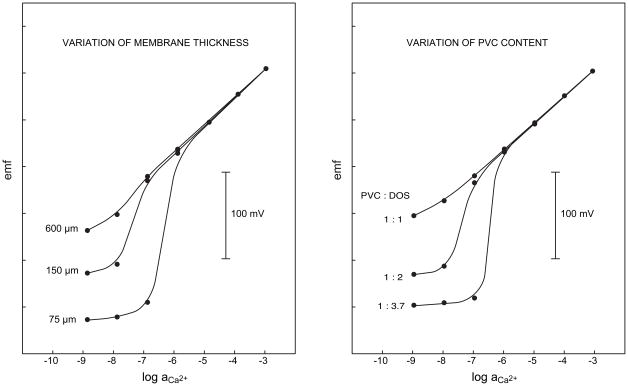
According to Eq. 1, the difference between the concentrations at the membrane surface and the bulk of the sample can be easily reduced by increasing the thickness of the membrane. Conventionally, the thickness of the polymeric membranes is around 100–200 μm. The left panel in Figure 6 shows the responses of three different Ca2+-selective membranes under otherwise the same conditions [38]. The inner solution brings about a calculated exchange of 80% Ca2+ by Na+ on the inner membrane side, which induces a strongly super-Nernstian response below 10−6 M with a ca. 75 μm thick membrane. An increase of the thickness to 150 μm shifts the super-Nernstian step by about one order of magnitude to lower concentrations and with 600 μm the response is close to Nenrstian [38].
Fig. 6.
Influence of the membrane thickness (left, 33 wt % PVC) and the PVC contetnt (right, membrane thickenss 150 μm) on the response of Ca2+-selective ISEs with 10−3 M CaCl2, 5 × 10⁻² M Na2EDTA, pH 5. as inner solution (cf. [38]).
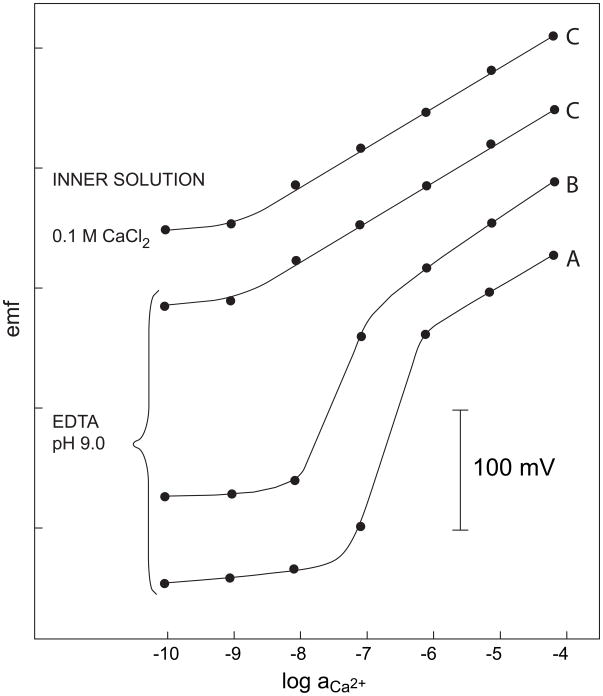
Even thicker membranes can be easily prepared in capillaries [39]. The response of three Ca2+-selective membranes is shown in Figure 7. With 5 × 10⁻² M Na2EDTA as inner solution of pH 9 without any added Ca2+, the primary ion is quantitatively replaced by Na+ at the inner membrane side. The conventional membrane A of 200 μm thickness shows the expected super-Nernstian response below 10−6 M CaCl2. Membrane B, which had a thickness of 6.5 mm, was prepared in a glass capillary (i.d. 200 μm). Although it had only 5 wt.% PVC and thus a higher diffusion coefficient, due to its thickness the super-Nernsitan step was shifted to lower concentrations by about one order of magnitude. Membrane C had a similar thickness of 5 mm and was prepared by filling a monolithic capillary of low porosity with the membrane solution without PVC. With this membrane, no super-Nernstian response was observed and the calibration curve was virtually identical when using 10−1 M CaCl2 as inner solution [39].
Fig. 7.
Calibration curves for Ca2+-selective membrane electrodes. (A) Conventional PVC membrane of 200 μm thickness, (B) membrane with 5 wt % PVC in a glass capillary, membrane thickness 6.5 mm, (C) monolithic capillary filled with the membrane solution without PVC, membrane thickness 5 mm (cf. [39]).
4.5 Accelerating Ion Fluxes in Water
It is surprising at first glance, but it is the limited diffusion rate in the aqueous sample that leads to the bias described above. Although the ionic diffusion coefficients in the aqueous phase are about two orders of magnitude larger than in the organic phase, due to the rather high concentrations in the membrane (milimolar range) this slow diffusion is sufficient to significantly change the composition of the sample near the membrane if the bulk concentration is in the submicromolar range. Therefore, any measure to make fluxes more efficient is helpful. The beneficial effect of stirring has been shown repeatedly [27, 38]. The use of a wall jet brings about an especially efficient reduction of the thickness of the unstirred layer and has improved the lower detection limit of a Ca2+-selective electrode by one order of magnitude [17]. Rotating electrode potentiometry had a similar effect with an additional improvement by placing a small membrane eccentrically relative to the rotation axis [40].
4.6 Suppressing Ion Fluxes in the Membrane
A simple way of reducing the concentration gradient of primary ions in a membrane is to diminish its ionic content. By lowering the concentration of the ion exchanger, the super-Nernstian response caused by too strong ion exchange on the inner membrane side has been indeed shifted to lower concentration [38]. Modifying the concentration of the ion exchanger may be used to fine-tune a membrane but it must be kept in mind that other properties such as the selectivity behavior and the upper detection limit might also be influenced. Due to the presence of ionic impurities on the order of 0.1 mmol kg−1 [41–43] on one hand and the limited solubilities of the components in the membrane matrix on the other, the available concentration range is currently quite limited.
Another possibility of suppressing the fluxes of ions in the membrane is to reduce their mobility. Various strategies have been successfully tested along these lines. Different groups described sensors based on ionophores covalently bound to the membrane matrix [44–49] but the goal of these earlier contributions was the improvement of the life time and not the suppression of ion fluxes in view of trace measurements. More recently, the strong reduction of disturbing ion fluxes was demonstrated by different groups [50, 51]. A practical limitation of this successful strategy is the rather involved work required to covalently immobilize an ionophore, and the possibility that membranes have inferior selectivity compared to their classical counterparts [48–52] (for an exception see [47].
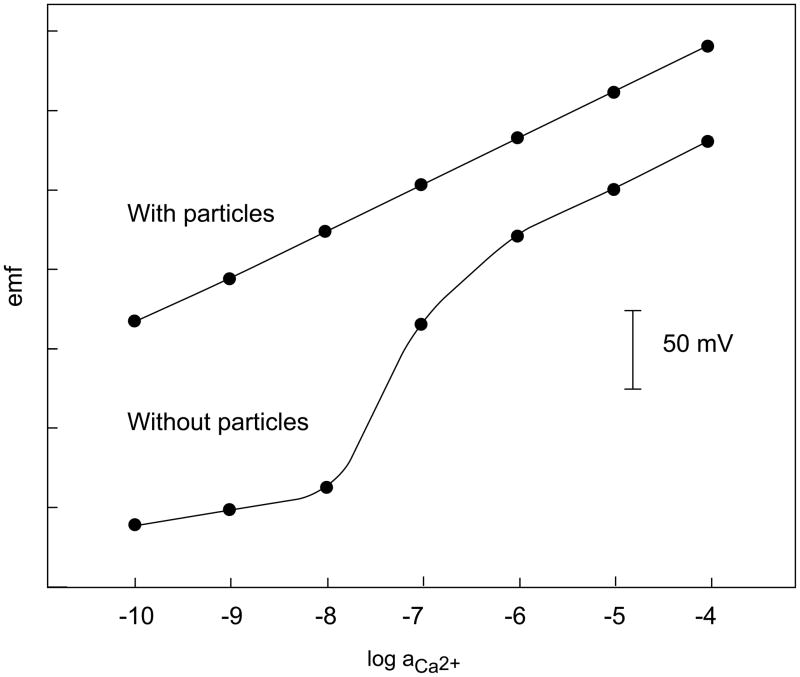
Another method of reducing transmembrane ion fluxes made use of lipophilic silica gel particles of 15 ± 35 μm diameter added to the membrane matrix [53]. It was shown that the apparent super-Nernstian response of ISEs caused by a strong flux of primary ions from the sample to the inner solution can be suppressed completely (cf. Figure 8). While this method is very simple to apply, in some cases the selectivity behavior was adversely influenced by the particles [53].
Fig. 8.
Response of two ISEs having 10−3 M CaCl2 and 5 × 10⁻² M Na2EDTA, pH 9.0 (5 × 10⁻¹¹ M free Ca2+) as inner solution without (bottom) and with 16 wt % of lipophilic silica gel particles on the outer (sample) side (top) (cf. [53]).
An even easier way of reducing the diffusion coefficients can be achieved by using other membrane compositions. An increase in the polymeric content of PVC membranes is an efficient way of influencing the diffusion coefficients [54, 55]. There is in fact merely a historical reason to still make PVC membranes with about 66 wt.% plasticizer and 33 wt.% PVC [56]. Membranes with 40 % PVC are already rather robust [38] but an even higher PVC content is possible if necessary. The upper limit is set by the membrane resistance and the solubility of the active sensing ingredients. As shown in the right panel of Figure 6, the super-Nernstian step induced by the internal solution of low Ca2+-activity is entirely suppressed with a membrane containing 50 wt% PVC. It must be noted that the widely applied method of gluing the sensing membranes to a PVC tubing has a beneficial effect since plasticizer from the membrane is slowly diffusing into the tubing and the membranes become harder.
A very promising approach is the use of polyacrylates and/or methacrylates as membrane matrix. Such matrices have been proposed already more than 20 years ago [57] but only recently they have been investigated more systematically [58–60]. By careful selection of the portion or hard (short chain) and soft (long chain) components [59, 61] or alternatively the amount of cross-linking agents [62], plasticizer-free membranes of tailored hardness can be prepared. They inherently show improved lower detection limits [63] which is obviously due to the strong reduction of the diffusion coefficients [60]. These polymers are also the likely candidates to prepare robust solid-contact electrodes (see also below) [64, 65].
4.7 Solid Contact
At first glance, solid contact ion-selective electrodes seem to be the perfect solution to achieve low detection limit potentiometric sensors. After all, the key problem described above is the concentration inequality between the two sides of the ion-selective membrane. If this system is altered to represent a two-phase system, one should be able to reach equilibrium upon each sample change, and hence achieve detection limits that are free of ion flux effects.
Unfortunately, practical systems are not so simple. A typical membrane contains primary ions at about the millimolar level. If just a small part of it leaches out because of ion-exchange it may significantly increase the primary ion concentration near the membrane, at least at short times. The required measuring times may not be long enough to achieve the desired equilibrium state mentioned above.
Solid contact ion-selective electrodes have been known for some 30 years, and it has been generally recognized that the redox processes at the inner membrane side have often been ill-defined, thereby leading to drifting potentials [66, 67]. A redox active layer is therefore of paramount importance for practical stability [68]. Lipophilic and redox active self-assembled monolayers have been shown to be useful systems for this purpose [69, 70], and it was found that without such layers a water film is present between the membrane and the solid contact [71, 72]. Indeed, a thin water layer may be the source for substantial potential instabilities as the electrolyte composition of this layer may slowly change as a function of the sample composition [72].
Conducting polymers are attractive materials for intermediate layers between the membrane and the underlying metal electrode because of their high redox capacity and their ion to electron transducing properties [73–75]. While they are now well established for use in ion-selective electrodes [75–76], low detection limits with conducting polymers as solid contacts were only reported relatively recently. Michalska and co-workers described ion sensors for potassium on the basis of a polypyrrole intermediate layer that exhibited detection limits in the sub-micromolar range [63]. Another example with a calcium electrode showed even better lower detection limits (nanomolar concentration range), but it is still unclear whether the observed calibration curve was sufficiently robust and repeatable for practical applications [77]. Conductive polymers may exhibit a number of potential challenges, however. According to Michalska’s work, they may spontaneously oxidize, and this process must be coupled to an ion flux across the membrane [78]. The use of chelators in the conducting polymer [79] or the application of a cathodic or anodic current during conditioning [21] were shown to alter this flux during measurement and may be a means for optimization of the electrode.
Other work by Pretsch was more concerned about the presence of a water layer with conducting polymers, and drastically different results observed with electrochemically deposited and solvent cast conducting polymer films were explained with hydrophilic, water saturated pores with the former procedure [64]. Such water will act as a third phase and invariable lead to potential drifts, and may also explain the results obtained by Michalska. At this stage, it has not yet been unequivocally shown which effect is the more dominant one that leads to electrode instability (polymer discharge or water layer). Several recent contributions showed that the use of conducting polymers layers that apparently do not contain a significant amount of water result in solid-contact ISEs with performances as good as of better than achievable with liquid contacts [64, 65, 80, 81]. Based on the ongoing intensive research [63, 65, 77–79, 81, 82] it is expected that processes will be fully understood soon so that straightforward procedures will be available to easily prepare high-performance solid-contact ISEs.
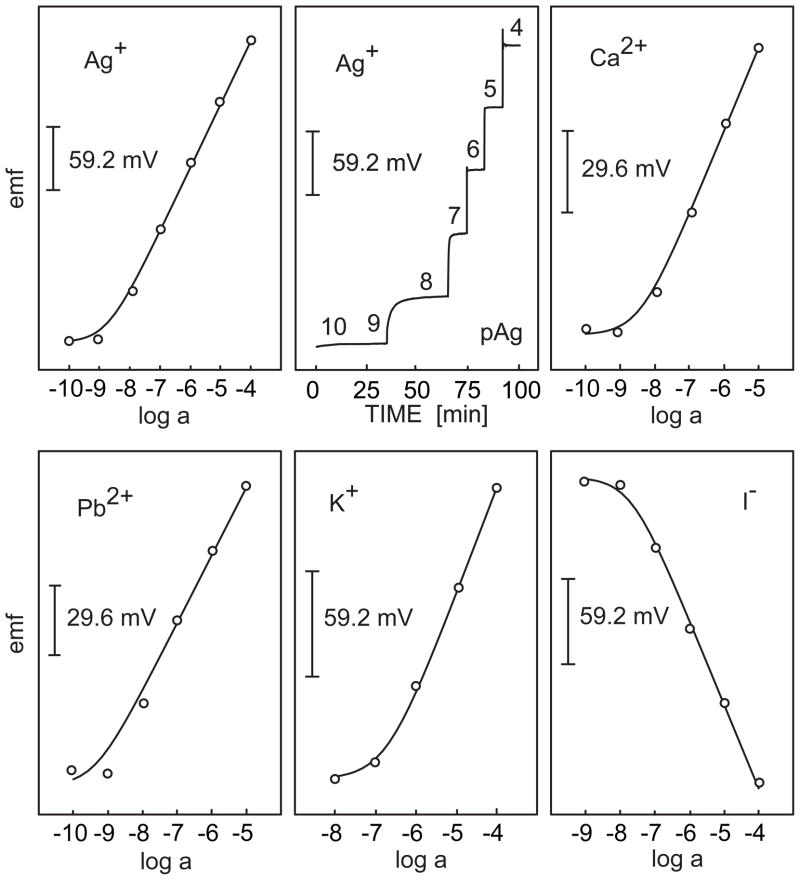
Recent work seems to suggest that lipophilic conducting polymers that resist oxidation, such as poly(octylthiophene) (POT), are most suited for the fabrication of robust ion-selective electrodes [64, 65, 83]. Indeed, a recent paper by Ivaska’s group showed that undoped POT films may function as ion-selective membranes on their own, with a remarkable selectivity towards silver ions [83]. Spectroscopic evidence suggests, however, that even silver ions are not capable of oxidizing the POT layer, making these materials very promising, robust candidates for solid contact ISEs. Figure 9 presents the response of a wide range of ion-selective electrodes fabricated with undoped POT as conducting polymer underlayer and a plasticizer-free methylmethacrylate–decylmethacrylate copolymer as ion-selective membrane [65]. The observed low detection limits with these systems are quite impressive and should stimulate further work in this area. Indeed, miniaturized solid contact ISEs are most likely to become an attractive method of preparing ISEs with good detection limits.
Fig. 9.
Response of different ion-selective electrodes with internal solid contact whose lower detection limit is as good as or better than their counterparts with liquid inner contact (cf. [65]).
4.8 Discussion
It is apparent from the above discussion that numerous strategies have been successfully tested during the past few years to prepare membranes that suffer much less from ion flux effects. While all the mentioned approaches were successful, it is clear that some of them are rather demanding while others are simple to implement. Clearly, there are at best historical reasons for using rather concentrated solutions of the primary ions as inner solution, of making membranes with a thickness of only 100–200 μm and with a PVC content of only 33 wt.%. Of course, good stirring is essential for any of the resulting ion sensors and easy to accomplish.
Ion-selective membranes with an aqueous inner contact have been most rigorously studied in the past years in view of lowering the detection limit, and are certainly the best understood systems. The detection limit, however, is influenced not only by the inner solution composition but also by the sample. This means that one cannot prepare an electrode that will give optimal detection limit for measurement in an unknown sample. This problem can only be avoided by minimizing or eliminating the influence of the inner solution. Three attractive strategies have been discussed above, increase of membrane thickness, decrease of membrane area, and/or use of solid contact ion sensors.
Increasing the membrane thickness is easy to accomplish, at the cost of increased membrane resistance. One important caveat of this approach is a drastically increased conditioning time, which may become impractical. Here it may be imperative to use preconditioned membranes, with all relevant ions added in their final required concentrations. A reduction of the diffusion coefficients after conditioning the membrane is also a possible approach to overcome this problem, for example by diffusion-induced plasticizer loss or by polymerization.
The use of polymeric microspheres dispersed at the sample side of the membrane has been shown to very effectively lower the detection limit. This approach is attractive because it can be easily accomplished with available materials, and conditioning times are not expected to increase substantially. Currently, however, it has not been explored with more than two systems, of which one exhibited reduced ion selectivity. More work is needed to show that this is a universal approach to the realization of low detection limit potentiometric sensors.
Solid contact ISEs are, at least theoretically, the most attractive systems to achieve low detection limit ion sensors. If the solid contact (typically, a conductive polymer) behaves ideally, the indicator electrode should behave as a two-phase, rather than a three-phase diffusion system. In principle, this should ultimately allow one to achieve detection limits that are governed by the thermodynamic principles of ion-exchange, without involving concentration polarization processes. While the current state-of-the-art is not yet at this stage, it is today possible to fabricate a wide range of low detection limit solid contact ion sensors with the same basic composition of the solid contact layer. At present, the key drawbacks of this approach are the relative immaturity of this technology and the fact that the best behaved sensors have been achieved with materials that needed to be synthesized in-house.
Another emerging approach is the replacement of plasticized PVC by polyacrylate/methacrylates as membrane matrices without plasticizer. Currently, however, such membrane materials are not commercially available and different groups use different synthetic recipes. Depending on their thickness, preconditioning might be mandatory also with such membranes.
With the improved lower detection limits, potentiometry, of course, encounters the problems inherent in trace analysis: the problem of impurities. This involves the lack of sufficiently pure salts as reference materials and impurities originating virtually from everywhere, including polymeric containers [84]. Some other artifacts are specific for potentiometry. Although tetraphenylborates, the mostly widely used anion exchangers in cation-selective membranes, are sufficiently lipophilic [85], their photostability is insufficient. As shown in Figure 10, after already 9 days the responses to nanomolar concentrations of Cd2+-membranes kept in the dark or in the light significantly differ from each other. Although carboranes are promising alternatives [86, 87] sufficiently lipophilic derivatives are currently not commercially available.
The slow response of ISEs to samples of submicromolar activity was originally a problem. More recently, especially with solid-contact ISEs and when using membranes with slower diffusion coefficients (e.g., harder PVC, polyacrylates/polymethacrylates), the response times are on the order of minutes [7, 39, 64, 65] (cf. Figure 9). A proper conditioning of the membranes is, however, mandatory. Concentrations higher than 10−4 or 10−5 M should be avoided because of memory effects. This is well understood in the case of PVC membranes that contain water droplets [88], which would equilibrate with the conditioning solution. The fastest responses are obtained if the membrane is conditioned in a solution having similar composition as the sample.
When characterizing ISEs for trace analysis, it is important to demonstrate that the responses correspond to steady-state situations. Otherwise, the response curves might be artificially improved as shown in Figure 11. Time responses should therefore be provided when characterizing new electrodes.
5. Conclusions
Tremendous advances have been made during the past few years in the field of potentiometric trace analysis. To achieve good detection limits and selectivity behavior sophisticated specialized knowledge is no longer needed. As outlined in this paper there already exist several routinely applicable methods to fabricate ISE membranes of very good performance. Although some others are about to emerge, and further improvements can be expected, the field is now ready to wide-scale applications.
Acknowledgments
This work was financially supported by ETH Research Grant TH-32/04-3, the Swiss National Science Foundation, and the National Institutes of Health (grant 002189).
References
- 1.Bakker E, Bühlmann P, Pretsch E. Electroanalysis. 1999;11:915. [Google Scholar]
- 2.Bakker E, Pretsch E. Trends Anal Chem. 2001;20:11. [Google Scholar]
- 3.Bakker E, Pretsch E. Anal Chem. 2002;74:420A. doi: 10.1016/j.trac.2006.10.006. [DOI] [PMC free article] [PubMed] [Google Scholar]
- 4.Bakker E, Pretsch E. Trends Anal Chem. 2005;24:199. doi: 10.1016/j.trac.2005.01.003. [DOI] [PMC free article] [PubMed] [Google Scholar]
- 5.Ceresa A, Bakker E, Hattendorf B, Günther D, Pretsch E. Anal Chem. 2001;73:343. doi: 10.1021/ac001034s. [DOI] [PubMed] [Google Scholar]
- 6.Slaveykova VI, Wilkinson KJ, Ceresa A, Pretsch E. Environ Sci Technol. 2003;37:1114. doi: 10.1021/es025993a. [DOI] [PubMed] [Google Scholar]
- 7.Szigeti Z, Bitter I, Tóth K, Latkoczy C, Fliegel DJ, Günther D, Pretsch E. Anal Chim Acta. 2005;532:129. [Google Scholar]
- 8.Plaza S, Szigeti Z, Geisler M, Martinoia E, Pretsch E. Anal Biochem. 2005;347:10. doi: 10.1016/j.ab.2005.09.030. [DOI] [PubMed] [Google Scholar]
- 9.Sokalski T, Zwickl T, Bakker E, Pretsch E. Anal Chem. 1999;71:1204. [Google Scholar]
- 10.Sokalski T, Ceresa A, Fibbioli M, Zwickl T, Bakker E, Pretsch E. Anal Chem. 1999;71:1210. [Google Scholar]
- 11.Morf WE, Badertscher M, Zwickl T, de Rooij NF, Pretsch E. J Phys Chem B. 1999;103:11346. [Google Scholar]
- 12.Zwickl T, Sokalski T, Pretsch E. Electroanalysis. 1999;11:673. [Google Scholar]
- 13.Morf WE, Badertscher M, Zwickl T, Reichmuth P, de Rooij NF, Pretsch E. J Phys Chem B. 2000;104:8201. [Google Scholar]
- 14.Ion AC, Bakker E, Pretsch E. Anal Chim Acta. 2001;440:71. [Google Scholar]
- 15.Ceresa A, Radu A, Peper S, Bakker E, Pretsch E. Anal Chem. 2002;74:4027. doi: 10.1021/ac025548y. [DOI] [PubMed] [Google Scholar]
- 16.Gyurcsányi RE, Pergel E, Nagy R, Kapui I, Lan BTT, Tóth K, Bitter I, Lindner E. Anal Chem. 2001;73:2104. doi: 10.1021/ac000922k. [DOI] [PubMed] [Google Scholar]
- 17.Lindner E, Gyurcsányi RE, Buck RP. Electroanalysis. 1999;11:695. [Google Scholar]
- 18.Pergel E, Gyurcsányi RE, Tóth K, Lindner E. Anal Chem. 2001;73:4249. doi: 10.1021/ac010094a. [DOI] [PubMed] [Google Scholar]
- 19.Bedlechowicz I, Sokalski T, Lewenstam A, Maj-Zurawska M. Sens Actuators B. 2005;108:836. [Google Scholar]
- 20.Morf WE, Badertscher M, Zwickl T, de Rooij NF, Pretsch E. J Electroanal Chem. 2002;526:19. [Google Scholar]
- 21.Michalska A. Electroanalysis. 2005;17:400. [Google Scholar]
- 22.Mathison S, Bakker E. Anal Chem. 1998;70:303. doi: 10.1021/ac990387s. [DOI] [PubMed] [Google Scholar]
- 23.Guilbault GG, Durst RA, Frant MS, Freiser H, Hansen EH, Light TS, Pungor E, Rechnitz G, Rice NM, Rohm TJ, Simon W, Thomas JDR. Pure Appl Chem. 1976;48:127. [Google Scholar]
- 24.Bakker E, Pretsch E, Bühlmann P. Anal Chem. 2000;72:1127. doi: 10.1021/ac991146n. [DOI] [PubMed] [Google Scholar]
- 25.Nägele M, Bakker E, Pretsch E. Anal Chem. 1999;71:1041. doi: 10.1021/ac980962c. [DOI] [PubMed] [Google Scholar]
- 26.Sokalski T, Ceresa A, Zwickl T, Pretsch E. J Am Chem Soc. 1997;119:11347. [Google Scholar]
- 27.Sokalski T, Bedlechowicz I, Maj-Zurawska M, Hulanicki A. Fresenius J Anal Chem. 2001;370:367. doi: 10.1007/s002160100799. [DOI] [PubMed] [Google Scholar]
- 28.Bedlechowicz I, Maj-Zurawska M, Sokalski T, Hulanicki A. J Electroanal Chem. 2002;537:111. [Google Scholar]
- 29.Södergard M, Csoka B, Nagy G, Ivaska A. Anal Lett. 2004;36:2909. [Google Scholar]
- 30.Kim BH, Hong HP, Cho KT, On JH, Jun YM, Jeong IS, Cha GS, Nam H. Talanta. 2005;66:794. doi: 10.1016/j.talanta.2004.12.033. [DOI] [PubMed] [Google Scholar]
- 31.Bakker E, Willer M, Pretsch E. Anal Chim Acta. 1993;282:265. [Google Scholar]
- 32.Bakker E, Meruva RK, Pretsch E, Meyerhoff ME. Anal Chem. 1994;66:3021. doi: 10.1021/ac00091a600. [DOI] [PubMed] [Google Scholar]
- 33.Radu A, Bakker E. Anal Chem. 2003;75:6922. doi: 10.1021/ac0346961. [DOI] [PubMed] [Google Scholar]
- 34.Qin W, Zwickl T, Pretsch E. Anal Chem. 2000;72:3236. doi: 10.1021/ac000155p. [DOI] [PubMed] [Google Scholar]
- 35.Malon A, Radu A, Qin W, Qin Y, Ceresa A, Maj-Zurawska M, Bakker E, Pretsch E. Anal Chem. 2003;75:3865. doi: 10.1021/ac026454r. [DOI] [PubMed] [Google Scholar]
- 36.Wang CY, Hu XY, Leng ZZ, Jin FD. Electroanalysis. 2003;15:709. [Google Scholar]
- 37.Inczédy J. Analytical applications of ion exchangers. Pergamon; Oxford: 1966. [Google Scholar]
- 38.Ceresa A, Sokalski T, Pretsch E. J Electroanal Chem. 2001;501:70. [Google Scholar]
- 39.Vigassy T, Huber CG, Wintringer R, Pretsch E. Anal Chem. 2005;77:3966. doi: 10.1021/ac050424h. [DOI] [PubMed] [Google Scholar]
- 40.Vigassy T, Gyurcsányi RE, Pretsch E. Electroanalysis. 2003;15:1270. [Google Scholar]
- 41.Lindner E, Gráf E, Nigreisz Z, Tóth K, Pungor E, Buck RP. Anal Chem. 1988;60:295. [Google Scholar]
- 42.Nägele M, Pretsch E. Mikrochim Acta. 1995;121:269. [Google Scholar]
- 43.Gyurcsányi RE, Lindner E. Anal Chem. 2002;74:4060. doi: 10.1021/ac020120k. [DOI] [PubMed] [Google Scholar]
- 44.Daunert S, Bachas LG. Anal Chem. 1990;62:1428. doi: 10.1021/ac00202a018. [DOI] [PubMed] [Google Scholar]
- 45.Kimura K, Matsuba T, Tsujimura Y, Yokoyama M. Anal Chem. 1992;64:2508. [Google Scholar]
- 46.Reinhoudt DN, Engbersen JFJ, Brzózka Z, van den Vlekkert HH, Honig GWN, Holterman HAJ, Verkerk UH. Anal Chem. 1994;66:3618. [Google Scholar]
- 47.Heng LY, Hall EAH. Electroanalysis. 2000;12:178. [Google Scholar]
- 48.Malinowska E, Gawart L, Parzuchowski P, Rokicki G, Brzózka Z. Anal Chim Acta. 2000;421:93. [Google Scholar]
- 49.Bereczki R, Gyurcsányi RE, Agai B, Tóth K. Analyst. 2005;130:63. doi: 10.1039/b410410b. [DOI] [PubMed] [Google Scholar]
- 50.Qin Y, Peper S, Radu A, Ceresa A, Bakker E. Anal Chem. 2003;75:3038. doi: 10.1021/ac0263059. [DOI] [PubMed] [Google Scholar]
- 51.Püntener M, Vigassy T, Baier E, Ceresa A, Pretsch E. Anal Chim Acta. 2004;503:187. [Google Scholar]
- 52.Ambrose TM, Meyerhoff ME. Electroanalysis. 1996;8:1095. [Google Scholar]
- 53.Vigassy T, Gyurcsányi RE, Pretsch E. Electroanalysis. 2003;15:375. [Google Scholar]
- 54.Püntener M, Fibbioli M, Bakker E, Pretsch E. Electroanalysis. 2002;14:1329. [Google Scholar]
- 55.Long R, Bakker E. Anal Chim Acta. 2004:91. [Google Scholar]
- 56.Moody GJ, Oke RB, Thomas JDR. Analyst. 1970;95:910. [Google Scholar]
- 57.Cattrall RW, Hamilton IC, Iles PJ. Anal Chim Acta. 1985;169:403. [Google Scholar]
- 58.Heng LY, Hall EAH. Anal Chem. 2000;72:42. doi: 10.1021/ac9904765. [DOI] [PubMed] [Google Scholar]
- 59.Qin Y, Peper S, Bakker E. Electroanalysis. 2002;14:1375. [Google Scholar]
- 60.Heng LY, Tóth K, Hall EAH. Talanta. 2004;63:73. doi: 10.1016/j.talanta.2003.12.051. [DOI] [PubMed] [Google Scholar]
- 61.Heng LY, Hall EAH. Anal Chim Acta. 2000;403:77. [Google Scholar]
- 62.Heng LY, Hall EAH. Anal Chim Acta. 2001;443:25. [Google Scholar]
- 63.Michalska A, Appaih-Kusi C, Heng LY, Walkiewicz S, Hall EAH. Anal Chem. 2004;76:2031. doi: 10.1021/ac0353132. [DOI] [PubMed] [Google Scholar]
- 64.Sutter J, Radu A, Peper S, Bakker E, Pretsch E. Anal Chim Acta. 2004;523:53. [Google Scholar]
- 65.Chumbimuni-Torres KY, Rubinova N, Radu A, Kubota LT, Bakker E. Anal Chem. 2006;78 doi: 10.1021/ac050749y. ASAP. [DOI] [PMC free article] [PubMed] [Google Scholar]
- 66.Cattrall RW, Drew DW, Hamilton IC. Anal Chim Acta. 1975;76:269. [Google Scholar]
- 67.Hulanicki A, Trojanowicz M. Anal Chim Acta. 1976;87:411. [Google Scholar]
- 68.Liu D, Meruva RK, Brown RB, Meyerhoff ME. Anal Chim Acta. 1996;321:173. [Google Scholar]
- 69.Fibbioli M, Bandyopadhyay K, Liu SG, Echegoyen L, Enger O, Diederich F, Bühlmann P, Pretsch E. Chem Commun. 2000:339. [Google Scholar]
- 70.Fibbioli M, Bandyopadhyay K, Liu SG, Echegoyen L, Enger O, Diederich F, Gingery D, Bühlmann P, Persson H, Suter UW, Pretsch E. Chem Mater. 2002;14:1721. [Google Scholar]
- 71.Fogt EJ, Untereker DF, Norenberg MS, Meyerhoff ME. Anal Chem. 1985;57:1995. doi: 10.1021/ac00286a048. [DOI] [PubMed] [Google Scholar]
- 72.Fibbioli M, Morf WE, Badertscher M, de Rooij NF, Pretsch E. Electroanalysis. 2000;12:1286. [Google Scholar]
- 73.Cadogan A, Gao Z, Lewenstam A, Ivaska A, Diamond D. Anal Chem. 1992;64:2496. [Google Scholar]
- 74.Lindfors T, Ivaska A. Anal Chem. 2004;76:4387. doi: 10.1021/ac049439q. [DOI] [PubMed] [Google Scholar]
- 75.Bobacka J. Electroanalysis. 2006;18:7. [Google Scholar]
- 76.Bobacka J. Anal Chem. 1999;71:4932. doi: 10.1021/ac990497z. [DOI] [PubMed] [Google Scholar]
- 77.Michalska A, Konopka A, Maj-Zurawska M. Anal Chem. 2003;75:141. doi: 10.1021/ac025916y. [DOI] [PubMed] [Google Scholar]
- 78.Michalska A, Dumanska J, Maksymiuk K. Anal Chem. 2003;75:4964. [Google Scholar]
- 79.Konopka A, Sokalski T, Michalska A, Lewenstam A, Maj-Zurawska M. Anal Chem. 2004;76:6410. doi: 10.1021/ac0492158. [DOI] [PubMed] [Google Scholar]
- 80.Sutter J, Lindner E, Gyurcsányi R, Pretsch E. Anal Bioanal Chem. 2004;380:1. doi: 10.1007/s00216-004-2737-4. [DOI] [PubMed] [Google Scholar]
- 81.Sutter J, Pretsch E. Electroanalysis. 2006;18:19. doi: 10.1002/elan.200603539. [DOI] [PMC free article] [PubMed] [Google Scholar]
- 82.Michalska AJ, Maksymiuk K. Talanta. 2004;63:109. doi: 10.1016/j.talanta.2003.12.001. [DOI] [PubMed] [Google Scholar]
- 83.Vazquez M, Bobacka J, Ivaska A. J Solid State Electrochem. 2005;9:865. [Google Scholar]
- 84.Moody JR, Lindstrom RM. Anal Chem. 1977;49:2264. [Google Scholar]
- 85.Telting-Diaz M, Bakker E. Anal Chem. 2001;73:5582. doi: 10.1021/ac010526h. [DOI] [PubMed] [Google Scholar]
- 86.Peper S, Qin Yu, Almond P, McKee M, Telting-Diaz M, Albrecht-Schmitt T, Bakker E. Anal Chem. 2003;75:2131. doi: 10.1021/ac026056o. [DOI] [PubMed] [Google Scholar]
- 87.Qin Y, Bakker E. Anal Chem. 2003;75:6002. doi: 10.1021/ac034447c. [DOI] [PubMed] [Google Scholar]
- 88.Chan ADC, Harrison DJ. Anal Chem. 1993;65:32. [Google Scholar]


