Abstract
Summary: Skyline is a Windows client application for targeted proteomics method creation and quantitative data analysis. It is open source and freely available for academic and commercial use. The Skyline user interface simplifies the development of mass spectrometer methods and the analysis of data from targeted proteomics experiments performed using selected reaction monitoring (SRM). Skyline supports using and creating MS/MS spectral libraries from a wide variety of sources to choose SRM filters and verify results based on previously observed ion trap data. Skyline exports transition lists to and imports the native output files from Agilent, Applied Biosystems, Thermo Fisher Scientific and Waters triple quadrupole instruments, seamlessly connecting mass spectrometer output back to the experimental design document. The fast and compact Skyline file format is easily shared, even for experiments requiring many sample injections. A rich array of graphs displays results and provides powerful tools for inspecting data integrity as data are acquired, helping instrument operators to identify problems early. The Skyline dynamic report designer exports tabular data from the Skyline document model for in-depth analysis with common statistical tools.
Availability: Single-click, self-updating web installation is available at http://proteome.gs.washington.edu/software/skyline. This web site also provides access to instructional videos, a support board, an issues list and a link to the source code project.
Contact: brendanx@u.washington.edu
Supplementary information: Supplementary data are available at Bioinformatics online.
1 INTRODUCTION
In recent years, the promise of targeted proteomics has gained significant attention. However, the tools for its practice have been either limited and cumbersome or proprietary and specific to a particular instrument vendor (Supplementary Text 1). Skyline was explicitly designed to accelerate targeted proteomics experimentation and foster broad sharing of both methods and results across instrument platforms (Supplementary Fig. 1). The software is developed under the open source Apache 2.0 License as part of the ProteoWizard project. An official public release is freely available and currently in use in many proteomics labs, both commercial and academic.
2 DESIGN AND IMPLEMENTATION
Skyline uses the MSData component of the ProteoWizard Data Access Library (Kessner et al., 2008) to provide unprecedented import of native output files from Agilent, Applied Biosystems, Thermo Fisher Scientific and Waters triple quadrupole instruments (Supplementary Text 2, Fig. 2). File conversion is unnecessary, although Skyline can also read selected reaction monitoring (SRM) data in XML formats (Supplementary Material). This critical requirement favored the choice of C# and Windows Forms as a development platform, since all of the required vendor libraries existed as Windows-only DLLs, and ProteoWizard already had a common language infrastructure binding.
Fig. 2.
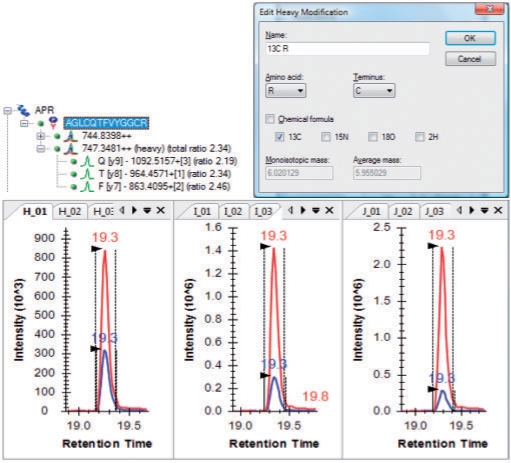
Skyline support for isotope-labeled internal standards and quantitation.
Other considerations in the choice of C# and Windows Forms included:
Familiar Windows-based graphical user interface that is intuitive to learn and use.
High-performance, low-latency, rich data interaction.
ClickOnce installation, which makes Skyline easy to install from a web site without administrator privileges, as well as self-updating.
Growing availability of open source and freely available C# software like ZedGraph, NHibernate, SQLite.NET and DigitalRune docking windows.
The development of Skyline as a rich-client application presented the opportunity to build classic, event-driven, document-view software with its unique multilevel undo and redo support (Supplementary Fig. 3). This architecture gives Skyline powerful method editing capabilities that can easily be undone and makes it responsive in displaying large amounts of complex graphical data. We use an immutable tree (Okasaki, 1998) for the document model to maintain these features while performing background processing.
2.1 Method building
Skyline provides several ways of building and editing SRM methods. Most users establish their Skyline document by pasting protein sequences or lists of peptides, precursors and product ion transitions either into a dialog or directly into the document. Transition lists and results for private and published experiments, including MRMer (Martin et al., 2008) and CPTAC Study 7 (Addona et al., 2009), conducted before Skyline was developed, are easily recreated in Skyline through these mechanisms.
Peptides can also be typed into the document. A background Proteome database, built from the FASTA formatted sequences for an experiment's expected protein matrix, adds further direct editing features like auto-complete from protein description fragments, protein names and peptide sequences (Supplementary Fig. 4). Skyline digests proteins and fragments peptides in silico to support direct peptide, precursor and transition picking, as well as automated picking using filters or spectral libraries.
2.2 Spectral library support
Skyline supports reading a variety of public spectral library formats (Supplementary Text). It also builds BiblioSpec libraries (Frewen et al., 2006) (Supplementary Fig. 5) from the peptide search results of many common search engines (Supplementary Text). These custom-built libraries provide full access to library features for peptide spectrum matches acquired in local labs as well as those stored in repositories like PeptideAtlas (Desiere et al., 2006).
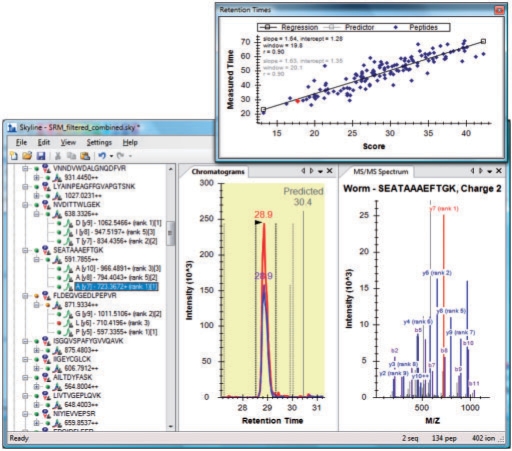
Matching spectra are shown in a graph pane with ion peak intensity ranking expressed in both the graph and document tree (Fig. 1). Transitions matching the most intense ions can be automatically selected, as described previously (Prakash et al., 2009), and imported results can be compared with the spectra for verification of ion ratios when no labeled internal standard is present.
Fig. 1.
Skyline user interface with results, retention time prediction and spectral library views.
2.3 Quantitation
Because of the high sensitivity and specificity of SRM, it has been widely used for quantitative measurements using labeled internal standards. Skyline fully supports these experiments with dialogs for defining static and heavy isotope modifications (Fig. 2) and assigning them broadly or explicitly to individual peptides. After importing result files, Skyline calculates ratios between the unlabeled peptide and the labeled internal standard and provides direct editing of integration boundaries.
2.4 Results analysis
Results analysis in Skyline begins with importing SRM mass spectrometer files in either native or portable format. Skyline caches them in a single high-performance data file which is usually a small fraction of the size of the original files, can be loaded in under a second for experiments with over 50 sample injections and simplifies sharing even complex experiments (Supplementary Fig. 6). During cache creation, the CRAWDAD peak detector (Finney et al., 2008) is used to calculate transition peaks which are then grouped by precursor and stored for quick display in a chromatogram graph pane. With enough screen resolution, Skyline can display useful information in 10 or more graph panes simultaneously and update them all as the selection changes without noticeable latency (Fig. 2). Hydrophobicity scores from SSRCalc (Krohkin et al., 2004) can be displayed in these graphs to increase confidence in peptide identification using retention time prediction (Fig. 1).
The unique Skyline custom report designer provides complete access to the data contained in the document model, allowing it to be flexibly exported to comma separated value format for further analysis with statistical tools like Excel and R (Supplementary Fig. 7).
3 SUMMARY AND FUTURE DIRECTION
Skyline development continues under the demands of its funding projects with regular public updates and enhancements expected. We hope Skyline will foster broad advances in the use and sharing of targeted proteomics methods and their results.
Supplementary Material
ACKNOWLEDGEMENTS
The authors would like to thank the entire National Cancer Institute-supported Clinical Proteomic Technology Assessment for Cancer (CPTAC) Verification Working Group and the growing community of Skyline users for providing critical feedback during the software development.
Funding: Vanderbilt University under National Institutes of Health/National Cancer Institute (U24CA126479) through the NIC CPTAC program; National Institutes of Health (R01 DK069386, P41 RR011823, P30 AG013280 and R01 HL082747).
Conflict of Interest: none declared.
REFERENCES
- Addona T, et al. Multi-site assessment of the precision and reproducibility of multiple reaction monitoring–based measurements of proteins in plasma. Nat. Biotech. 2009;27:633–641. doi: 10.1038/nbt.1546. [DOI] [PMC free article] [PubMed] [Google Scholar]
- Desiere F, et al. The PeptideAtlas project. Nucliec Acids Res. 2006;34:D655–D658. doi: 10.1093/nar/gkj040. [DOI] [PMC free article] [PubMed] [Google Scholar]
- Finney G, et al. Label-free comparative analysis of proteomics mixtures using chromatographic alignment of high-resolution μLC-MS data. Anal. Chem. 2008;80:961–971. doi: 10.1021/ac701649e. [DOI] [PubMed] [Google Scholar]
- Frewen BE, et al. Analysis of peptide MS/MS spectra from large-scale proteomics experiments using spectrum libraries. Anal. Chem. 2006;78:5678–5684. doi: 10.1021/ac060279n. [DOI] [PubMed] [Google Scholar]
- Kessner D, et al. ProteoWizard: open source software for rapid proteomics tools development. Bioinformatics. 2008;24:2534. doi: 10.1093/bioinformatics/btn323. [DOI] [PMC free article] [PubMed] [Google Scholar]
- Krokhin OV, et al. An improved model for prediction of retention times of tryptic peptides in ion pair reversed-phase HPLC. Mol. Cell. Proteomics. 2004;3:908–919. doi: 10.1074/mcp.M400031-MCP200. [DOI] [PubMed] [Google Scholar]
- Martin DB, et al. MRMer: an interactive open-source and cross-platform system for data extraction and visualization of multiple reaction monitoring experiments. Mol. Cell. Proteomics. 2008;7:2270–2278. doi: 10.1074/mcp.M700504-MCP200. [DOI] [PMC free article] [PubMed] [Google Scholar]
- Okasaki C. Purely Functional Data Structures. Cambridge, UK: Cambridge University Press; 1998. pp. 11–14. [Google Scholar]
- Prakash A, et al. Expediting the development of targeted SRM assays: using data from shotgun proteomics to automate method development. J. Proteome Res. 2009;8:2733–2739. doi: 10.1021/pr801028b. [DOI] [PMC free article] [PubMed] [Google Scholar]
Associated Data
This section collects any data citations, data availability statements, or supplementary materials included in this article.


