Abstract
Alcohol abuse results in liver injury, but investigations into the mechanism(s) for this injury have been hampered by the lack of appropriate in vitro culture models in which to conduct in depth and specific studies. In order to overcome these shortcomings, we have developed the use of precision-cut liver slices (PCLS) as an in vitro culture model in which to investigate how ethanol causes alcohol-induced liver injury. In these studies, it was shown that the PCLS retained excellent viability as determined by lactate dehydrogenase and ATP levels over a 96 hour period of incubation. More importantly, the major enzymes of ethanol detoxification; alcohol dehydrogenase, aldehyde dehydrogenase, and cytochrome P4502E1, remained active and PCLS readily metabolized ethanol and produced acetaldehyde. Within 24 hours and continuing up to 96 hours the PCLS developed fatty livers and demonstrated an increase in the redox state. These PCLS secreted albumin, and albumin secretion was decreased by ethanol treatment. All of these impairments were reversed following the addition of 4-methylpyrazole, which is an inhibitor of ethanol metabolism. Therefore, this model system appears to mimic the ethanol-induced changes in the liver that have been previously reported in human and animal studies, and may be a useful model for the study of alcoholic liver disease.
1. Introduction
Alcohol abuse causes abnormalities in liver structure and function, including fatty liver, apoptosis, necrosis, fibrosis, and cirrhosis [1, 2]. Despite numerous studies over the years, the mechanisms of alcohol hepatotoxcity remain unclear. Traditionally, ethanol-feeding animal models have been used to study the physiological responses in the liver. Although studies with this model have provided a wealth of information, detailed mechanistic studies are problematic using this in vivo model. Therefore, several in vitro culture systems have been developed in order to determine the effects of ethanol administration on the liver. These systems include primary hepatocyte cultures [3, 4], HepG2 hepatoma cells expressing stable exogenous alcohol dehydrogenase [5, 6] or cytochrome P4502E1[7], and WIF-B cells [8, 9]. Although these models have provided valuable information, numerous limitations and weaknesses are evident in these systems. For example, differentiated functions are rapidly lost, cell-cell and cell-matrix interactions are compromised, and most importantly other cell types in the liver besides heptatocytes are not present.
In view of the limitations of the currently established in vitro culture systems for mechanistic studies of ethanol hepatotoxicity, precision cut liver slices (PCLS) were chosen in this study as a possible model of alcoholic liver disease. PCLS have been used previously for a variety of metabolic and toxicological studies [10–13], and appear to be applicable for ethanol hepatotoxicity studies. In this model, normal lobular hepatic architecture is maintained, and the cell-cell and cell-matrix interactions mimic the in vivo situation. In addition and most importantly, PCLS contain hepatocytes and the other non-parenchymal cells of the liver, namely Kupffer cells, endothelial cells, and stellate cells. Since these other cell types likely contribute to the deleterious effects of ethanol [2], it would appear that PCLS could be a valuable model to further delineate the mechanism(s) of ethanol-induced liver injury.
The purpose of this study was to validate the use of PCLS as a model to investigate ethanol hepatotoxcity. Ethanol metabolism and steady state levels of acetaldehyde were determined in this model. In addition, the ability to reproduce some of the known effects of ethanol on the liver; such as, formation of a fatty liver, altered hepatic redox state, and impaired albumin secretion, were investigated.
2. Materials and Methods
2.1 Rats
Male Wistar rats were purchased from Charles River Laboratories (Willmington, MA) and maintained on a Purina rat chow diet. All animals were allowed free access to their food and/or water up to 1 hour prior to sacrifice. All procedures were approved by the Animal Subcommittee of the Omaha VA Medical Center, and are in accordance with the National Institutes of Health Guidelines on the Use of Laboratory Animals.
2.2 Rat Precision Cut Liver Slices (PCLS)
Rats weighing 200–300 grams were anesthetized using Isoflurane. The basic method of Olinga et al. [14] was used to prepare the PCLS. Briefly, the abdominal cavity was scrubbed with betadine and entered exposing the liver. The inferior vena cava was clipped, blood allowed to drain for 1 minute, the liver excised and quickly placed into oxygenated V-7 cold preservation buffer purchased from Vitron Inc. (Tucson, AZ). Multiple (8 mm) cylindrical tissue cores were cut using a hand held coring tool, loaded into the Vitron Tissue Slicer ™ from Vitron Inc. (Tucson, AZ), and 250 μm thick slices were prepared [15]. Slices were cut using a 45mm rotary blade, floated into ice cold oxygenated V-7 preservation buffer, and pre-incubated in six well plates in the presence of serum free Williams Medium (WE) (Sigma Chemical Co., St. Louis, MO) containing D-glucose and gentamicin with 95% oxygen/5% CO2 (carbogen) at 37°C for 30 minutes. For some studies, slices were taken at this time point and were designated as Time 0 (t0) slices. The rest of the slices were loaded onto titanium-screen rollers from Vitron, Inc. (Tucson, AZ) and inserted into sterile 20 ml glass vials containing 1.7 ml of WE media. The vials were capped with lids containing a 1 mm hole for the infusion of oxygen. This assembly was placed horizontally into the Dynamic Organ Culture incubator from Vitron Inc. (Tucson, AZ) and incubated at 37°C in the presence of carbogen using a flow rate of 1.5 lpm.
2.3 Incubation of Slices with Ethanol
Following pre-incubation with WE, slices were incubated with media only (Control), media + 25 mM ethanol (Ethanol), media + 25 mM ethanol + 0.50 mM 4-methylpyrazole (Ethanol + 4-MP), or media + 0.50 mM 4-methylpyrazole (Control + 4-MP). The addition of 4-MP was used in these studies as it is a general inhibitor of ethanol metabolism. These slices were placed in the Dynamic Organ Culture incubator and cultured at 37°C for up to 96 hours, and every 24 hours the appropriate media was replenished. In order to determine the concentration of ethanol and acetaldehyde in the media, the supernatant was analyzed using head space gas chromatography [16].
2.4 Viability assays
Slice viability was determined by measuring adenosine triphosphate (ATP) and lactate dehydrogenase (LDH) levels. For the ATP assay, slices were harvested at the appropriate times, placed into 70% ethanol/2mM EDTA, flash frozen, and stored at −70°C until assayed. Samples were thawed on ice, sonicated, and diluted in 0.1 M Tris-HCl/2mM ETDA prior to use in the ATP Bioluminescence Assay Kit CLSII (Roche Applied Science, Penzberg, Germany). ATP levels were detected using a Modulus Microplate Luminometer from Turner Biosystems (Sunnyvale, CA).
For LDH determination, supernatant was collected and frozen at −70°C. The slice was solublized in WE containing 2% Triton X-100 and LDH determined using a Cytotoxicity Detection Kit (LDH) (Roche Applied Science, Penzberg, Germany). The absorbance of the samples was measured at 490 nm using a MRX II plate reader with Revelation Software ™ (Dynex Technologies, Chantilly, VA). All protein concentrations from the slices were determined using a BCA Protein Assay kit from Pierce (Rockford, IL). To calculate the % Cytotoxicity at subsequent 24 hour time points, the LDH in the media was divided by the total LDH in the PCLS and multiplied by 100.
2.5 ADH/ALDH Activity
Slices were harvested at the time points indicated, washed in PBS, (pH 7.4), lysed in 1% Triton X-100, and sonicated. For the ADH assay, protein concentrations were adjusted to 50–100 μg and incubated at 37°C in the presence of 10 mM ethanol, 3 mM NAD+, and 0.5 M Tris-HCL (pH 7.4). Conversion of NAD+ to NADH was measured by the change in optical density at 340 nm using a Cary 50 spectrophotometer (Varian Inc., Palo Alto, CA) [17]. ALDH activity was determined by placing the slice into 1 ml of buffer containing 100 mM NaPO4 (pH 7.4), 3 mM NAD+, and 10 mM pyrazole. The reaction was initiated by adding propionaldehyde to a final concentration of 25 μM (low Km enzyme) or 1 mM (total enzyme activity). Conversion of NAD+ to NADH was determined by the change in optical density at 340 nm using a Cary 50 spectrophotometer [6].
2.6 Cytochrome P450 2E1 (CYP2E1) Assay
Microsomes were prepared from slices using a modified protocol from Omura and Kamth et. al. [18, 19] Briefly, slices were added to a 1.15% KCl solution, sonicated, subjected to differential centrifuged to obtain the microsomal fraction, and protein concentration determined by the method of Lowry et. al. [20]. CYP2E1 activity was determined using the p-Nitrophenol (PNP) (Sigma Chemical Co., St. Louis, MO) oxidation assay described by Wu and Cederbaum [21]. Microsomal protein was added to 0.2 mM PNP, 1mM NADPH (Sigma Chemical Co., St. Louis, MO), and incubated at 37°C for 1 hour. The reaction was stopped using 30% trichloroacetic acid, centrifuged, and 10 N NaOH was added to the remaining supernatant. Activity was obtained by measuring the absorbance at 546 nm using a Beckman DU-70 spectrophotometer.
Immunoblotting techniques were used to determine microsomal CYP2E1 expression [9]. Microsomal protein (5 μg) was loaded onto a 10% SDS polyacrylamide gel, transferred onto PVDF membrane, and blocked in Blotto. The primary antibody, rabbit anti-CYP2E1 (Chemicon, Temecula, CA) was incubated overnight at 4°C followed by 1 hour incubation with an IR-labeled secondary anti-rabbit IgG antibody. Blots were washed, dried and scanned using an Odyssey IR Scanner (Li-Cor, Lincoln, NE). Densitometric analysis was performed using Odyssey imaging software (Li-Cor, Lincoln, NE) and the data are expressed in arbitrary densitometric units/μg of protein.
2.7 Cellular Redox State and Albumin Secretion
Supernatant from liver slices incubated up to 96 hours under various conditions was assayed for the presence of lactate or pyruvate using assay kits from Biovision (Mountain View, CA) to assess the cellular redox state. Briefly, 50 μl/well of each sample was incubated with 50 μl/well of assay kit reagent in conjunction with the lactate or pyruvate enzyme. The reaction was allowed to take place for 30 minutes and the levels of lactate or pyruvate were determined by absorbence at 570 nm. Plates were analyzed using a MRX II plate reader with Revelation Software (Dynex Technologies, Chantilly, VA).
Supernatant was used to analyze PCLS for albumin secretion using a Rat Albumin Quantitative ELISA Kit from Bethyl Laboratories, Inc. (Montgomery, TX). This assay was performed by coating a 96 well plate with a capture antibody (sheep anti-Rat Albumin). Plates were blocked with BSA, and the albumin standard or sample were added. A secondary antibody was added (HRP conjugated Sheep anti-Rat Albumin) and the plate was developed using TMB peroxidase substrate (Pharmingen, San Diego, CA). Absorbence was detected at 450 nm using a MRX II plate reader with Revelation Software (Dynex Technologies, Chantilly, VA).
2.8 Triglyceride analysis
At indicated time points, supernatant was removed and slices were washed in PBS (pH 7.4). Slices were placed in PBS containing 0.5% Triton-X100, sonicated, and the equivalent of 300 μg of protein was assayed for triglycerides using the serum triglyceride kit from Sigma Chemical Co. (St. Louis, MO). Triglycerides in each sample were hydrolyzed by lipase and the resulting free glycerol was calculated against a glycerol standard at 540 nm using the Cary 50 spectrophotometer.
2.9 Oil Red O staining
For Oil Red O staining, slices were flash frozen in OCT (Sigma Chemical Co., St. Louis, MO), sectioned and gently placed onto slides. Oil Red O was incubated with the sections, washed, and the presence or absence of fat content analyzed by light microscopy on a Nikon Microphot-FXA microscope by a pathologist. Photographs were taken using a Colorview II Olympus Camera with Analysis Software, at a final magnification of 325X.
2.10 Statistical Analysis
Results are expressed as means +/− SEM. Statistical significance was achieved if P values were less than 0.05. All statistical analysis was performed using the SigmaStat (Jandel Scientific, 2002) program and one-way or multiple ANOVA where appropriate.
3. Results
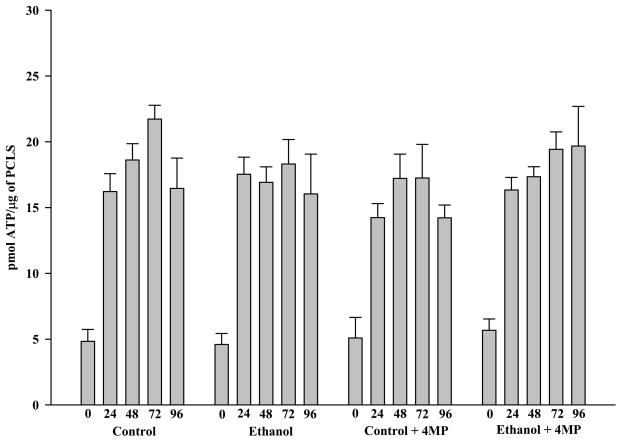
The first step in assessing the utility of precision-cut liver slices (PCLS) as a model of ALD was to determine their viability under different conditions and for various lengths of time. Therefore, PCLS were prepared and their viability over a 96 hour period assessed using adenosine triphosphate (ATP) levels and lactate dehydrogenase (LDH) release. ATP was chosen as it represents the ability of the slices to maintain an energy source and as such is a measure of live cells. In contrast, cell death was quantified by measuring the amount of LDH released into the medium. These assays represent two different ways of measuring viability. At time 0 (t0) all slices showed a decreased level of ATP (approximately 4.5–5.6 pmol ATP/μg of protein). PCLS at this time (30 minutes of pre-incubation) most likely reflects acute changes related to the process of the preparing the liver, physical trauma during the slicing, and a “washout” period during which the PCLS are equilibrating. However, as shown in Figure 1, all liver slices produced ATP and maintained these levels over the 96 hour period.
Figure 1.
ATP Production from Rat Precision-Cut Liver Slices (PCLS). PCLS were cultured at t0, 24, 48, 72 and 96 hours in the absence of ethanol (Control), presence of 25 mM ethanol (Ethanol), absence of 25 mM ethanol but in the presence of 0.50 mM 4-MP (Control + 4-MP), and in the presence of both 25 mM ethanol and 0.50 mM 4-MP (Ethanol + 4-MP). ATP activity was determined as described in the Materials and Methods. Data are expressed as the mean (ρmol ATP/μg of PCLS Protein) ± S.E.M. of five separate experiments. There were no significant differences observed at the various time points among the 4 groups.
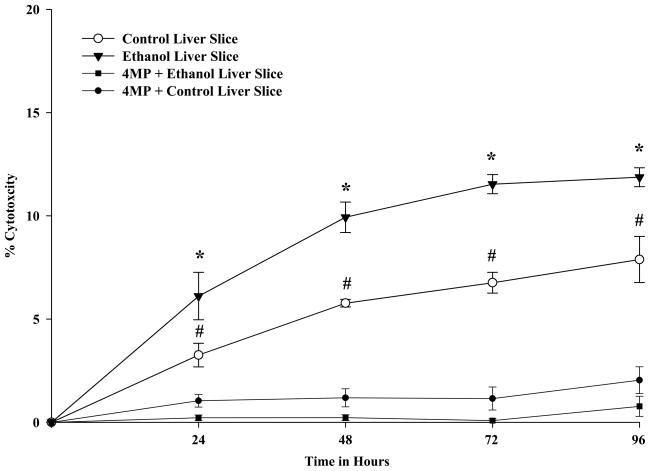
Measurement of LDH activity (Figure 2) showed that cell death (% Cytotoxicity) in control PCLS was maintained between 0–7.8% for up to 96 hours. Incubation with 25 mM ethanol increased the levels of cytotoxicity reaching a maximum of 11.9% at 72 and 96 hours. These levels were significantly different from control levels at all time points assayed. The addition of 4-methyl-pyrazole (4-MP) to the control and ethanol treated samples resulted in a decrease in the % cytotoxicity in both control and ethanol-treated samples.
Figure 2.
LDH Activity in Rat Pecision-Cut Liver Slices. PCLS were cultured at t0, 24, 48, 72 and 96 hours in the absence of ethanol (Control-open circles), presence of 25 mM ethanol (Ethanol-closed triangles), absence of 25 mM ethanol but in the presence of 0.50 mM 4-MP (Control + 4-MP-closed circles), and in the presence of both 25 mM ethanol and 0.50 mM 4-MP (Ethanol + 4-MP-closed squares). LDH activity (% Cytotoxicity) was determined as described in the Materials and Methods. Data are expressed as the mean % Cytotoxicity ± S.E.M. of five separate experiments. Ethanol significantly increased the % Cytotoxicity when compared to other 3 groups, *P < 0.05. Ethanol and Control PCLS groups compared to Ethanol + 4-MP or Control + 4-MP PCLS. Additionally, the Control PCLS showed significantly higher % Cytotoxicity compared to the Ethanol + 4-MP or Control + 4-MP PCLS, #P < 0.05.
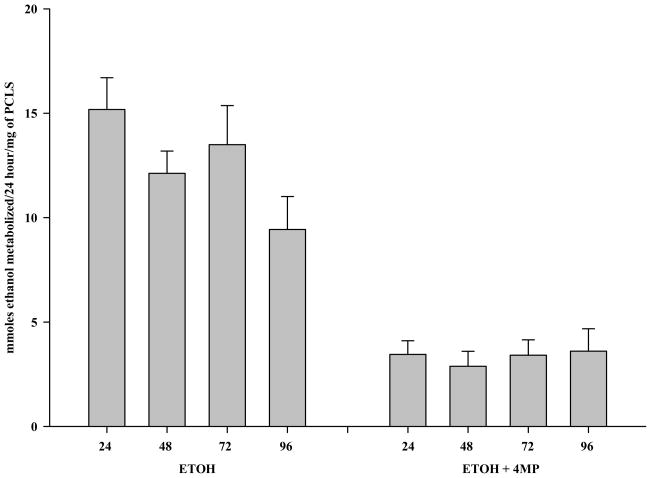
Ethanol metabolism and ADH activity were next examined at the different time points (Figure 3). At time zero, media containing 25 mM ethanol was added. Every 24 hours thereafter, the media was totally removed and replaced with fresh media containing 25 mM ethanol. In this way, it was possible to assess how much ethanol was metabolized over a 24 hour period. During the first 24 hours, the PCLS metabolized (as determined by gas chromatography) 15.18 μmoles/24 hours/mg of PCLS protein and this level was maintained for the next 48 hours (48 and 72 hour time points). At 96 hours the PCLS appear to have a decrease in their ability to metabolize ethanol to 9.43 μmoles/24 hours/mg of PCLS protein which may be related to the decrease in viability. The addition of 4-MP to PCLS treated with ethanol at the onset of the experiment to determine whether the clearance of ethanol was due to metabolism showed that the metabolic rate of ethanol was significantly decreased at all times examined.
Figure 3.
Ethanol Metabolism by Rat Precision-Cut Liver Slices. PCLS were cultured at 24, 48, 72 and 96 hours in the presence of 25 mM ethanol (Ethanol), and in the presence of both 25 mM ethanol and 0.50 mM 4-MP (Ethanol + 4-MP). Since Control PCLS do not metabolize ethanol, the data for Control and Control +4-MP are not shown. Media were changed every 24 hours and assessed for ethanol concentrations (μmole/mg) by headspace gas chromatography. Data are expressed as the mean ± S.E.M. μmoles of ethanol metabolized/24 hours/mg of PCLS protein of five separate experiments. The addition of 4-MP significantly inhibited ethanol metabolism at all times, *P < 0.01.
The metabolism of ethanol in the liver is primarily dependent upon ADH activity. At 48, 72 and 96 hours the ADH activity of PCLS exposed to ethanol was decreased when compared to control and ethanol + 4-MP treated slices, but were only significantly lower at 72 and 96 hours (Table 1). All ADH activities were lower than at time 0, but were only significantly lower for all slices at 72 and 96 hours.
Table 1.
Comparison of ADH and ALDH Activities in Rat Precision-Cut Liver Slices. Lysates from PCLS at t0, 24, 48, 72 and 96 hours were prepared and the activities of ADH and ALDH were compared. To determine if ethanol treatment affected these activities, PCLS were incubated in the absence of ethanol (Control), presence of 25 mM ethanol (Ethanol), and in the presence of both 25 mM ethanol and 0.50 mM 4-MP (Ethanol + 4-MP). All activities are expressed in nmoles of NAD+ oxidized/min/mg protein and are shown as the mean ± S.E.M. All determinations were performed in duplicate for each of the five samples. Significantly decreased compared to the t0 time point, * P < 0.05. Significantly decreased compared to the corresponding Control PCLS, #P < 0.05. Significantly decreased when compared to the PCLS slices incubated with 4-MP alone (Control + 4-MP) or Ethanol + 4MP, $P < 0.05.
| Sample (hour) | ADH Activity | Total ALDH Activity | Low Km ALDH activity |
|---|---|---|---|
| Time 0 | 15.39 ± 1.16 | 7.59 ± 0.33 | 1.66 ± 0.09 |
| Control 24 | 10.69 ± 0.71* | 4.16 ± 0.16* | 0.81 ± 0.06* |
| Ethanol 24 | 11.40 ± 0.58* | 4.12 ± 0.18* | 0.75 ± 0.06* |
| Control + 4mp 24 | 12.24 ± 2.35 | 4.65 ± 0.36* | 0.98 ± 0.15* |
| Ethanol + 4mp 24 | 12.23 ± 2.54 | 4.88 ± 0.27* | 0.96 ± 0.20* |
| Control 48 | 11.54 ± 1.91 | 3.82 ± 0.41* $ | 0.79 ± 0.09* |
| Ethanol 48 | 9.13 ± 2.04 | 2.70 ± 0.41* #$ | 1.01 ± 0.13* |
| Control + 4mp 48 | 12.89 ± 3.63 | 4.44 ± 0.44* | 1.01 ± 0.24* |
| Ethanol + 4mp 48 | 12.04 ± 2.84 | 4.49 ± 0.35* | 1.11 ± 0.21* |
| Control 72 | 11.43 ± 0.57* $ | 2.89 ± 0.16* | 0.75 ± 0.04* |
| Ethanol 72 | 8.01 ± 0.90* #$ | 2.04 ± 0.21* #$ | 0.79 ± 0.17* $ |
| Control + 4mp 72 | 12.71 ± 1.38* | 3.47 ± 0.36* | 1.11 ± 0.27* |
| Ethanol + 4mp 72 | 12.45 ± 1.35* | 4.11 ± 0.44* | 1.14 ± 0.33* |
| Control 96 | 11.01 ± 0.87* $ | 2.73 ± 0.14* | 0.84 ± 0.18* |
| Ethanol 96 | 7.97 ± 1.59* #$ | 2.51 ± 0.14* | 1.04 ± 0.18* |
| Control + 4mp 96 | 16.09 ± 3.29 | 3.39 ± 0.44* | 1.07 ± 0.35* |
| Ethanol + 4mp 96 | 10.06 ± 1.43* | 3.05 ± 0.27* | 1.02 ± 0.12* |
P>0.05 Significant compared to T=0
P>0.05 Significant compared to Control Slice
P>0.05 Significant compared to Control or Ethanol 4MP
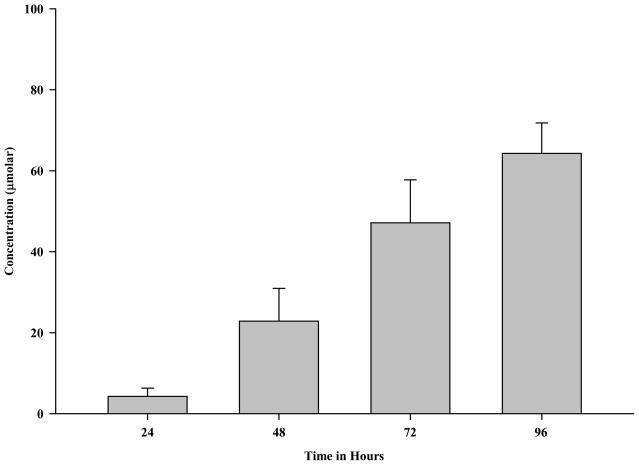
Ethanol metabolism by the liver produces acetaldehyde, an extremely reactive compound implicated in ethanol-induced liver injury [9, 22–24]. Based on the results above, the production of acetaldehyde was investigated. As shown in Figure 4, acetaldehyde levels were detectable within 24 hours reaching about 4.2 μM concentrations and continued to increase at 48 (22.9 μM), 72 (47.1 μM) and 96 (64.3 μM) hours. The production of acetaldehyde was completely inhibited by the addition of 0.50 mM 4-MP, indicating the acetaldehyde produced was from ethanol metabolism.
Figure 4.
Acetaldehyde Levels Following Incubation of Rat Precision-Cut Liver Slices with Ethanol. PCLS were cultured 24, 48, 72 and 96 hours in the presence of 25 mM ethanol (Ethanol). The Control and Control + 4-MP groups do not metabolize ethanol to produce acetaldehyde. Additionally, the addition of both 25 mM ethanol and 0.50 mM 4-MP (Ethanol + 4-MP) resulted in the total inhibition of the production of acetaldehyde from ethanol. So, the data from these three groups are not shown. Media was changed every 24 hours and assessed for acetaldehyde concentrations (μmolar) by headspace gas chromatography. Data are expressed as the mean ± S.E.M. of five separate experiments.
Because the levels of acetaldehyde are partially dependent upon their metabolism by cellular ALDH enzymes, the total and low Km ALDH activities were investigated (Table 1). The total ALDH enzyme activities of PCLS treated under all conditions showed significantly lower activities when compared to t0. Additionally, total ALDH activity was further significantly decreased in PCLS treated with ethanol at 48 and 72 hours. The addition of 4-MP maintained total ALDH equivalent to the levels for 24 to 48 hours. Similar results were found for the low Km ALDH activities showing a decrease by half after 24 hours, and remained consistent for up to 96 hours.
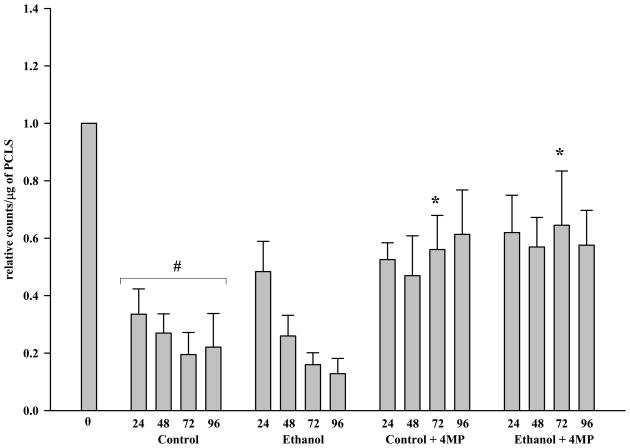
CYP2E1, a cytochrome P450 enzyme implicated in ethanol-induced liver injury was examined for protein expression (Figure 5a) by immunoblot analysis [9]. At 24 hours, the control PCLS contained about 1/3 the CYP2E1 expression (0.335 relative counts/μg of t0 PCLS) that was observed in the t0 sample. This expression decreased slightly at 48 hours and then decreased by approximately 25% every 24 hours thereafter. In contrast, the PCLS exposed to ethanol retained more CYP2E1 expression (0.4835 relative counts/μg of t0 PCLS) at 24 hours, with this level decreasing to those observed for control PCLS slices at 48, 72 and 96 hours. Interestingly, the addition of 4-MP to PCLS in the presence or absence of ethanol appeared to maintain the CYP2E1 expression levels near to those observed for ethanol PCLS at 24 hours.
Figure 5.
Figure 5A. CYP2E1 Expression in Microsomes from Rat Precision-Cut Liver Slices. PCLS were cultured at t0, 24, 48, 72 and 96 hours in the absence of ethanol (Control), absence of ethanol but the addition of 0.50 mM 4-MP (Control + 4-MP), presence of 25 mM ethanol (Ethanol), and in the presence of both 25 mM ethanol and 0.50 mM 4-MP (Ethanol + 4-MP). Microsomes were prepared as outlined in the Materials and Methods, loaded on SDS-PAGE gels (5 μg protein per lane), and analyzed by immunoblotting and densitometry as described in the Materials and Methods. The data are expressed as the mean ± S.E.M. of five separate experiments. Significantly decreased as compared to t0, #P < 0.001. Significantly increased as compared to the corresponding control PCLS, *P < 0.05.
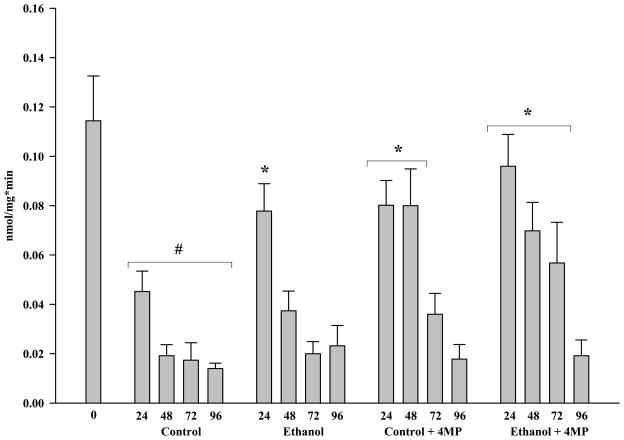
Figure 5B. CYP2E1 Activity in Microsomes from Rat Precision-Cut Liver Slices. PCLS were cultured at t0, 24, 48, 72 and 96 hours in the absence of ethanol (Control), absence of ethanol but the addition of 0.50 mM 4-MP (Control + 4-MP), presence of 25 mM ethanol (Ethanol), and in the presence of both 25 mM ethanol and 0.50 mM 4-MP (Ethanol + 4-MP). Microsomes were assayed for the presence of CYP2E1 using p-Nitrophenol oxidation as described in the Materials and Methods. The data are expressed as the mean ± S.E.M. of five separate experiments. Significantly decreased as compared to t0, #P < 0.001. Significantly increased as compared to the corresponding control PCLS, *P < 0.05.
Protein expression of an enzyme does not necessarily reflect whether the CYP2E1 was active. Therefore, activity (Figure 5b) was assessed using the p-Nitrophenol (PNP) oxidation assay [21]. In general, the profile observed with protein expression (Figure 5a) showed a concomitant decrease in activity (Figure 5b) in both the control and ethanol PCLS. The addition of 4-MP to control and ethanol PCLS maintained the CYP2E1 activities at levels observed for ethanol PCLS at 24 hours for the first 24 to 48 hours. This again reflected the protein expression at these time points (Figure 5a). In contrast, the activities began to decrease at 72 hours until they attained control and ethanol PCLS activity levels by 96 hours.
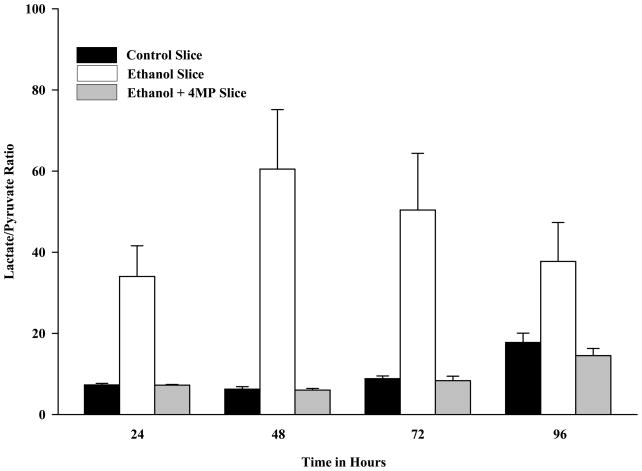
The metabolism of ethanol by ADH and acetaldehyde by ALDH generates NADH which can result in a reduced redox state [25]. To determine the effects of ethanol metabolism on the PCLS redox state, the lactate/pyruvate (NADH/NAD+) ratio in PCLS was determined and found to be significantly increased after ethanol exposure at all times examined (Figure 6) when compared to control PCLS. Incubation of the PCLS in the presence of ethanol and 4-MP completely reversed the ethanol-induced change in redox state. These results are similar to those reported with cell lines transfected with ADH [26, 27], from isolated hepatocytes [17], and from the WIF-B cell line [9].
Figure 6.
Redox Ratio (Lactate/Pyruvate) in Rat Precision-Cut Liver Slices. PCLS were cultured at 24, 48, 72 and 96 hours in the absence of ethanol (Control-solid bars), presence of 25 mM ethanol (Ethanol-open bars), and in the presence of both 25 mM ethanol and 0.50 mM 4-MP (Ethanol + 4-MP-shaded bar). At the various time points the Lactate and Pyruvate concentrations were determined and the redox ratio calculated. The Control + 4-MP group were not different from the Control PCLS (Data not shown). The cellular redox state was determined as described in the Materials and Methods. Data are expressed as the mean lactate/pyruvate (NADH/NAD+) ratio ± S.E.M. of five separate experiments. Significantly increased for Ethanol treated PCLS compared to all other groups, *P < 0.01.
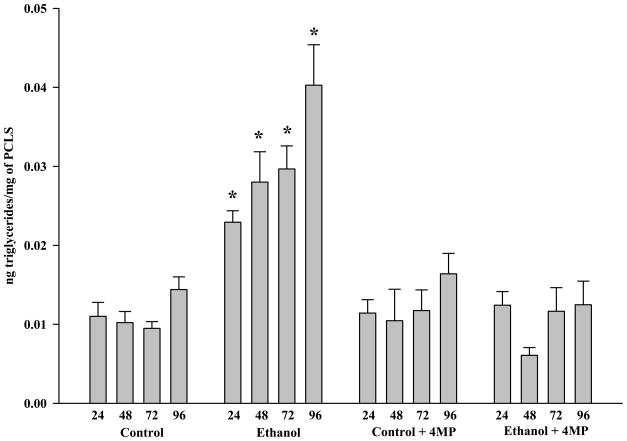
PCLS were incubated in the presence and absence of both ethanol and 4-MP for 24, 48, 72 and 96 hours, and examined for cellular triglyceride levels. By 24 hours, the levels of triglycerides in ethanol-treated PCLS were significantly elevated approximately two-fold over the control level (Figure 7). These levels continued to increase over the 96 hour incubation period, reaching a maximum of a 300% increase. The addition of 4-MP in the presence of ethanol reversed the ethanol-induced increase in triglyceride content, indicating that the accumulation of triglycerides was a result of ethanol metabolism.
Figure 7.
Triglyceride Concentrations in Rat Precision-Cut Liver Slices. PCLS were cultured at 24, 48, 72 and 96 hours in the absence of ethanol (Control), presence of 25 mM ethanol (Ethanol), absence of 25 mM ethanol but in the presence of 0.50 mM 4-MP (Control + 4-MP), and in the presence of both 25 mM ethanol and 0.50 mM 4-MP (Ethanol + 4-MP). Data are expressed as the mean triglyceride levels (μg) per μg of protein in the PCLS ± S.E.M. of five separate experiments. Significantly increased for Ethanol treated PCLS as compared to all other groups, *P < 0.05.
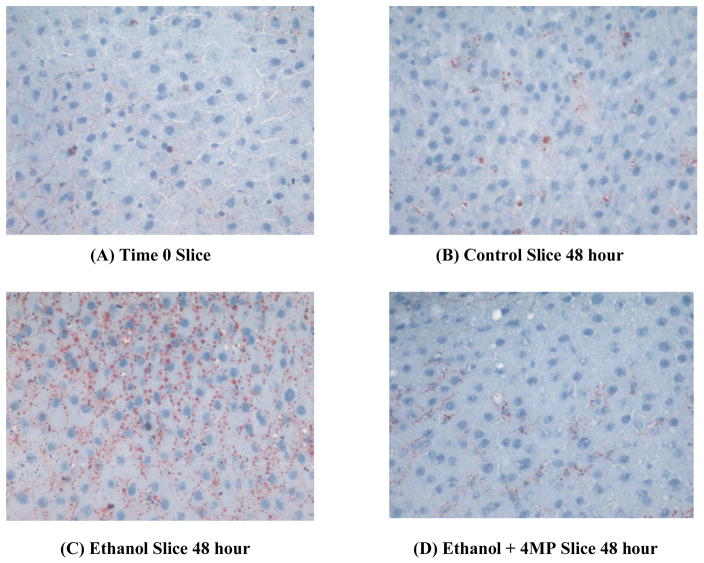
Oil Red O staining of PCLS treated with ethanol confirms the biochemical findings discussed above. Figure 8B shows the control PCLS after 48 hours of culture and there is a small amount of fatty infiltration as compared to the t0 slice (Figure 8A). In contrast, PCLS exposed to ethanol for 48 hours showed a substantial increase in the staining by Oil Red O (Figure 8C) similar to that observed in the triglyceride data, that was abrogated when 4-MP was added to the incubation media containing ethanol (Figure 8D).
Figure 8.
Oil Red O Staining of PCLS. PCLS were cultured for; t0 (A), 48 hours in the absence of ethanol (B), 48 hours in the presence of 25 mM ethanol (C), and the presence of 25 mM ethanol and 0.50 mM 4-MP (D). Light microscopy photographs were taken at random on a Nikon Microphot-FXA microscope under 325X magnification. Photographs were taken using a Colorview II Olympus Camera and Software, and the figures are representative of six separate experiments.
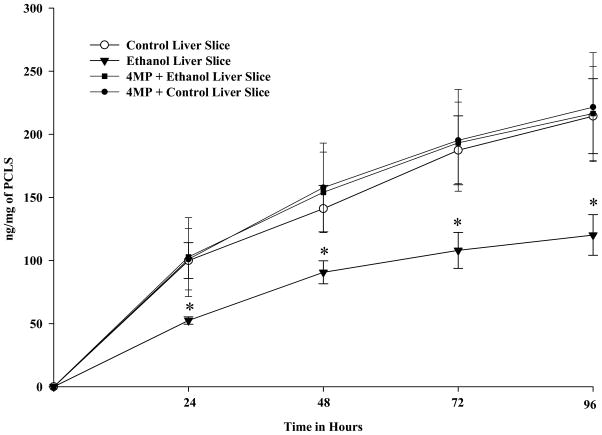
It was important to determine if the PCLS were able to maintain cellular function and whether ethanol has significant effects on this function. One of the functions that are commonly measured is the secretion of albumin. As shown in Figure 9, albumin is secreted by all PCLS regardless of their treatment. However, ethanol treatment of PCLS significantly decreased the secretion by about 50% when compared to controls. Finally, the addition of 4-MP to the media reversed the effects of ethanol treatment indicating that the metabolism of ethanol was involved in the decrease in albumin secretion.
Figure 9.
Albumin Secretion by Rat Precision-Cut Liver Slices. PCLS were cultured at 24, 48, 72 and 96 hours in the absence of ethanol (Control), presence of 25 mM ethanol (Ethanol), absence of 25 mM ethanol but in the presence of 0.50 mM 4-MP (Control + 4-MP), and in the presence of both 25 mM ethanol and 0.50 mM 4-MP (Ethanol + 4-MP). Media were changed every 24 hours and the levels of albumin determined for each time point. Data are expressed as the mean albumin levels (ng) per μg of protein in the PCLS ± S.E.M. of five separate experiments. Significantly decreased for Ethanol treated PCLS as compared to all other groups, *P < 0.05.
4. Discussion
Alcohol abuse results in various forms of liver injury, but research on the mechanisms of alcoholic liver disease (ALD) have been hampered by the lack of an appropriate in vitro culture model in which to conduct in depth and specific mechanistic studies. Although primary hepatocytes in culture, hepatoma cell lines and WIF-B cells have provided valuable information, they do not always provide the ability to study intracellular interactions and the regulatory factors associated with naturally occurring extracellular matrices, and in some instances they rapidly lose specific liver gene expression [3–9]. Others have used liver slices in the past to attempt to investigate the effects of ethanol on the liver; however, as with isolated cells and cell lines, these slices rapidly lost all normal liver function [16, 28–31]. Recently, investigators have developed precision-cut liver slices (PCLS), incubated under high oxygen content, for investigating the effects of various toxins on the liver [10, 14, 32, 33]. As described in this manuscript, we have tested the applicability of using PCLS as a model for studying the mechanism(s) of alcohol-induced liver injury.
Under the experimental conditions of this study, PCLS remained functional and viable over a 96-hour time period. ATP was produced and levels of ATP were maintained at high levels throughout the entire 96 hours of incubation. Leakage of LDH was minimal; however, slight increases were observed at the later time points. Importantly, albumin was produced and secreted over the entire time-course, indicating that the PCLS were functional. Addition of 25 mM ethanol to the PCLS did not appear to affect their ability to maintain ATP levels, and leakage of LDH was only slightly increased by ethanol, indicating that ethanol had only minimal effects on cell viability. It should be noted, that it was necessary to use the incubator and roller inserts as described by [34] in order to maintain PCLS function for longer than 24 hours. Additionally, the V7 medium used for cutting these slices and the addition of new media daily was imperative in maintaining the viability of the PCLS. Importantly, in our hands the use of alternative technological approaches; submerged slices in 6-well plates on a rocker platform [35], Transwell Permeable Supports (Corning Inc. Acton, MA) on a rocker platform [14], Transwell plates with nitrocellulose [36], or home-made incubators to increase oxygen content [32] could only be used for short term cultures.
A critical aspect of any model designed to study alcoholic hepatotoxicity is the evaluation of ethanol metabolism. Results for these studies demonstrated that PCLS metabolized ethanol at virtually the same rate for up to 72 hours after which it decreased slightly for the final 24 hours of incubation. Importantly, the presence of the known inhibitor of ethanol metabolism, 4-MP, dramatically reduced the metabolism of ethanol by PCLS. The rate of ethanol metabolism in PCLS was comparable with those seen in freshly isolated hepatocytes [17]. Examination of acetaldehyde (a metabolite of ethanol and a possible mediator of liver injury) concentrations showed that ethanol metabolism resulted in levels of acetaldehyde ranging from 20 μM at 48 hours to 60 μM at 96 hours of incubation. These concentrations are within the range of values reported for acetaldehyde levels observed during ethanol metabolism in vivo [37, 38]. These results demonstrated that ethanol metabolism by PCLS are consistent with the data showing that PCLS were able to maintain both ADH and ALDH activities during incubation. ADH activities appeared to remain relatively consistent over the time-course of incubation; however, ALDH activities did decrease over the course of these time points, and most likely explains the increase of acetaldehyde in the media over time.
Another enzyme capable of metabolizing ethanol is CYP2E1, and this enzyme has been proposed to play a role in ethanol-induced liver injury [39]. PCLS did express CYP2E1 during incubation; however, the levels and activities of CYP2E1 were reduced to about 20–40% of the level of a freshly prepared liver samples. Despite this rather large decrease in CYP2E1 activity, ethanol metabolism was maintained at a relatively constant rate, indicating that ethanol metabolism occurred primarily via the ADH pathway. In addition, the known in vivo inducing effects of agents, such as ethanol and 4-MP, on CYP2E1 were also observed when PCLS were treated with these agents.
In order to further evaluate the applicability of PCLS as a model for ethanol-induced hepatotoxicity, known detrimental effects of ethanol on hepatic function [1, 2, 40, 41] were tested. Incubation of PCLS with ethanol resulted in a more reduced metabolic state, i.e. increased NADH/NAD+ ratio (lactate/pyruvate). Secondly, ethanol treatment impaired the secretion of albumin by PCLS. Finally, ethanol treatment of PCLS resulted in a fatty liver. This finding was ascertained by both morphological and biochemical analysis of triglycerides. In this regard, triglyceride levels progressively increased during incubation in the presence of ethanol, reaching an almost 4-fold elevation after 96 hours. Inhibition of ethanol metabolism with 4-MP essentially prevented all of these observed defects in tested hepatic functions, indicating a prominent role for ethanol metabolism via ADH in impaired hepatic function by ethanol.
In summary, PCLS have recently been used by other investigators studying the toxicological effects of a number of drugs and toxins [10, 13, 32, 34]. It was the purpose of this study to determine whether PCLS could be used as a model system to study the effects of ethanol on the liver. In order to use this model it was first necessary to demonstrate that the PCLS could be cultured for an extended period of time without altering normal biochemical, functional and histological parameters. This has not been the case with liver slices in the past [16, 30]. However, this model system has been altered from previous liver slice models by; ensuring the slices are uniformly very thin (200–300 μm; approximately 8–10 hepatocytes thick), prepared and maintained under highly oxygenated conditions, and continuous changing of the media. These slices were viable, maintained their histological appearance, enzyme activities (ADH, ALDH, CYP2E1, etc.), and their function (albumin secretion) for up to 96 hours.
The addition of ethanol to these PCLS produced many of the same effects that have been observed in both isolated hepatocytes and in vivo models of chronic ethanol consumption [1, 2, 9, 40, 41], including the oxidation of ethanol, acetaldehyde production, fatty liver, altered redox state, and the decreased secretion of albumin. All of these parameters were reversed in these studies by the addition of an inhibitor of ethanol metabolism (4-MP), which strongly suggests that this model has potential for studying the structural and functional consequences of ethanol-induced liver injury. Additionally, since all of the cell types are present during the incubation period in their appropriate conformation and matrix, this model should be very useful for studying the interactions of these cells types. Thus, it appears that these PCLS retain many of the biological functions that are lost when cells from the liver are isolated and cultured in vitro, and therefore, PCLS appear to be an attractive and useful model for the study of pathogenic mechanisms of alcoholic liver disease.
Acknowledgments
Supported by: National Institutes of Health Grants R01 AA10435, R37 AA07818, and R21 AA15505-01A2. Also supported by the Department of Veterans Affairs National Merit Review Program and the Department of Internal Medicine at the UNMC.
We thank the members of the Experimental Immunology Laboratory at the Omaha VA Medical Center including, Karen C. Easterling, Bartlett C. Hamilton III, and Kristin M. Lencowski. This material is based upon work supported (or supported in part) by the Office of Research and Development Medical Research Service, Department of Veterans Affairs.
Abbreviations used in this paper
- ATP
Adenosine Triphosphate
- LDH
Lactate Dehydrogenase
- 4-MP
4-Methylpyrazole
- AA
Acetaldehyde
- ALD
Alcohol Liver Disease
- ADH
Alcohol Dehydrogenase
- ALDH
Aldehyde Dehydrogenase
- CYP2E1
Cytochrome P450 2E1
- PCLS
Precision Cut Liver Slices
Footnotes
All work was performed in the Experimental Immunology Laboratory at the Omaha Veterans Administration Medical Center, Research Services 151, 4101 Woolworth Avenue, Omaha, NE 68105.
Publisher's Disclaimer: This is a PDF file of an unedited manuscript that has been accepted for publication. As a service to our customers we are providing this early version of the manuscript. The manuscript will undergo copyediting, typesetting, and review of the resulting proof before it is published in its final citable form. Please note that during the production process errors may be discovered which could affect the content, and all legal disclaimers that apply to the journal pertain.
References
- 1.Levitsky J, Mailliard ME. Diagnosis and therapy of alcoholic liver disease. Semin Liver Dis. 2004;24(3):233–47. doi: 10.1055/s-2004-832937. [DOI] [PubMed] [Google Scholar]
- 2.Tsukamoto H, Lu SC. Current concepts in the pathogenesis of alcoholic liver injury. Faseb J. 2001;15(8):1335–49. doi: 10.1096/fj.00-0650rev. [DOI] [PubMed] [Google Scholar]
- 3.Pal-Bhadra M, Bhadra U, Jackson DE, Mamatha L, Park PH, Shukla SD. Distinct methylation patterns in histone H3 at Lys-4 and Lys-9 correlate with up- & down-regulation of genes by ethanol in hepatocytes. Life Sci. 2007;81(12):979–87. doi: 10.1016/j.lfs.2007.07.030. [DOI] [PMC free article] [PubMed] [Google Scholar]
- 4.Lee YJ, Shukla SD. Histone H3 phosphorylation at serine 10 and serine 28 is mediated by p38 MAPK in rat hepatocytes exposed to ethanol and acetaldehyde. Eur J Pharmacol. 2007;573(1–3):29–38. doi: 10.1016/j.ejphar.2007.06.049. [DOI] [PMC free article] [PubMed] [Google Scholar]
- 5.Clemens DL, Calisto LE, Sorrell MF, Tuma DJ. Ethanol metabolism results in a G2/M cell-cycle arrest in recombinant Hep G2 cells. Hepatology. 2003;38(2):385–93. doi: 10.1053/jhep.2003.50332. [DOI] [PubMed] [Google Scholar]
- 6.Clemens DL, Halgard CM, Miles RR, Sorrell MF, Tuma DJ. Establishment of a recombinant hepatic cell line stably expressing alcohol dehydrogenase. Arch Biochem Biophys. 1995;321(2):311–8. doi: 10.1006/abbi.1995.1400. [DOI] [PubMed] [Google Scholar]
- 7.Cederbaum AI, Wu D, Mari M, Bai J. CYP2E1-dependent toxicity and oxidative stress in HepG2 cells. Free Radic Biol Med. 2001;31(12):1539–43. doi: 10.1016/s0891-5849(01)00743-2. [DOI] [PubMed] [Google Scholar]
- 8.Kannarkat GT, Tuma DJ, Tuma PL. Microtubules are more stable and more highly acetylated in ethanol-treated hepatic cells. J Hepatol. 2006;44(5):963–70. doi: 10.1016/j.jhep.2005.07.007. [DOI] [PubMed] [Google Scholar]
- 9.Schaffert CS, Todero SL, McVicker BL, Tuma PL, Sorrell MF, Tuma DJ. WIF-B cells as a model for alcohol-induced hepatocyte injury. Biochem Pharmacol. 2004;67(11):2167–74. doi: 10.1016/j.bcp.2004.01.022. [DOI] [PubMed] [Google Scholar]
- 10.van de Bovenkamp M, Groothuis GM, Draaisma AL, Merema MT, Bezuijen JI, van Gils MJ, Meijer DK, Friedman SL, Olinga P. Precision-cut liver slices as a new model to study toxicity-induced hepatic stellate cell activation in a physiologic milieu. Toxicol Sci. 2005;85 (1):632–8. doi: 10.1093/toxsci/kfi127. [DOI] [PubMed] [Google Scholar]
- 11.Lerche-Langrand C, Toutain HJ. Precision-cut liver slices: characteristics and use for in vitro pharmaco-toxicology. Toxicology. 2000;153(1–3):221–53. doi: 10.1016/s0300-483x(00)00316-4. [DOI] [PubMed] [Google Scholar]
- 12.Guyot C, Combe C, Balabaud C, Bioulac-Sage P, Desmouliere A. Fibrogenic cell fate during fibrotic tissue remodelling observed in rat and human cultured liver slices. J Hepatol. 2007;46(1):142–50. doi: 10.1016/j.jhep.2006.08.013. [DOI] [PubMed] [Google Scholar]
- 13.Olinga P, Hof IH, Merema MT, Smit M, de Jager MH, Swart PJ, Slooff MJ, Meijer DK, Groothuis GM. The applicability of rat and human liver slices to the study of mechanisms of hepatic drug uptake. J Pharmacol Toxicol Methods. 2001;45(1):55–63. doi: 10.1016/s1056-8719(01)00127-7. [DOI] [PubMed] [Google Scholar]
- 14.Olinga P, Groen K, Hof IH, De Kanter R, Koster HJ, Leeman WR, Rutten AA, Van Twillert K, Groothuis GM. Comparison of five incubation systems for rat liver slices using functional and viability parameters. J Pharmacol Toxicol Methods. 1997;38(2):59–69. doi: 10.1016/s1056-8719(97)00060-9. [DOI] [PubMed] [Google Scholar]
- 15.Fisher RL, Hasal SJ, Sanuik JT, Hasal KS, Gandolfi AJ, Brendel K. Cold- and cryopreservation of dog liver and kidney slices. Cryobiology. 1996;33(1):163–71. doi: 10.1006/cryo.1996.0016. [DOI] [PubMed] [Google Scholar]
- 16.Tuma DJ, Zetterman RK, Sorrell MF. Inhibition of glycoprotein secretion by ethanol and acetaldehyde in rat liver slices. Biochem Pharmacol. 1980;29(1):35–8. doi: 10.1016/0006-2952(80)90240-3. [DOI] [PubMed] [Google Scholar]
- 17.Crow KE, Cornell NW, Veech RL. The rate of ethanol metabolism in isolated rat hepatocytes. Alcohol Clin Exp Res. 1977;1(1):43–50. doi: 10.1111/j.1530-0277.1977.tb05765.x. [DOI] [PubMed] [Google Scholar]
- 18.Kamath SA, Narayan KA. Interaction of Ca 2+ with endoplasmic reticulum of rat liver: a standardized procedure for the isolation of rat liver microsomes. Anal Biochem. 1972;48(1):53–61. doi: 10.1016/0003-2697(72)90169-8. [DOI] [PubMed] [Google Scholar]
- 19.Omura T, Sato R. The Carbon Monoxide-Binding Pigment of Liver Microsomes. Ii. Solubilization, Purification, and Properties. J Biol Chem. 1964;239:2379–85. [PubMed] [Google Scholar]
- 20.Lowry OH, Rosebrough NJ, Farr AL, Randall RJ. Protein measurement with the Folin phenol reagent. J Biol Chem. 1951;193(1):265–75. [PubMed] [Google Scholar]
- 21.Wu D, Cederbaum AI. Expression of cytochrome P4502E1 in rat fetal hepatocyte culture. Mol Pharmacol. 1996;49(5):802–7. [PubMed] [Google Scholar]
- 22.Lieber CS. Metabolic effects of acetaldehyde. Biochem Soc Trans. 1988;16(3):241–7. doi: 10.1042/bst0160241. [DOI] [PubMed] [Google Scholar]
- 23.Sorrell MF, Tuma DJ. Hypothesis: alcoholic liver injury and the covalent binding of acetaldehyde. Alcohol Clin Exp Res. 1985;9(4):306–9. doi: 10.1111/j.1530-0277.1985.tb05549.x. [DOI] [PubMed] [Google Scholar]
- 24.Volentine GD, Ogden KA, Kortje DK, Tuma DJ, Sorrell MF. Role of acetaldehyde in the ethanol-induced impairment of hepatic glycoprotein secretion in the rat in vivo. Hepatology. 1987;7(3):490–5. doi: 10.1002/hep.1840070313. [DOI] [PubMed] [Google Scholar]
- 25.Hoek JB, Cahill A, Pastorino JG. Alcohol and mitochondria: a dysfunctional relationship. Gastroenterology. 2002;122(7):2049–63. doi: 10.1053/gast.2002.33613. [DOI] [PMC free article] [PubMed] [Google Scholar]
- 26.Galli A, Price D, Crabb D. High-level expression of rat class I alcohol dehydrogenase is sufficient for ethanol-induced fat accumulation in transduced HeLa cells. Hepatology. 1999;29(4):1164–70. doi: 10.1002/hep.510290420. [DOI] [PubMed] [Google Scholar]
- 27.Clemens DL, Forman A, Jerrells TR, Sorrell MF, Tuma DJ. Relationship between acetaldehyde levels and cell survival in ethanol-metabolizing hepatoma cells. Hepatology. 2002;35(5):1196–204. doi: 10.1053/jhep.2002.32668. [DOI] [PubMed] [Google Scholar]
- 28.Corazzi L, Arienti G, Tirillini B, Porcellati G, Mezzasoma I, Orlando P. The effect of acute ethanol administration on phosphorylcholine uptake and metabolism in rat liver slices. Farmaco [Sci] 1979;34(7):612–20. [PubMed] [Google Scholar]
- 29.Iritani N, Yamashita S, Numa S. Dietary control of triglyceride and phospholipid synthesis in rat liver slices. J Biochem. 1976;80(2):217–22. doi: 10.1093/oxfordjournals.jbchem.a131267. [DOI] [PubMed] [Google Scholar]
- 30.Tuma DJ, Jennett RB, Sorrell MF. Impairment of glycoprotein secretion by phenobarbital in rat liver slices. Biochim Biophys Acta. 1978;544(1):144–52. doi: 10.1016/0304-4165(78)90218-0. [DOI] [PubMed] [Google Scholar]
- 31.Sawyer JS, Daller JA, Brendel K, Yohem K, Putnam CW. The hepatotoxicities of endotoxin and ethanol comparisons in vitro using the precision-cut rat liver slice model. Life Sci. 1994;55(18):1407–17. doi: 10.1016/0024-3205(94)00755-1. [DOI] [PubMed] [Google Scholar]
- 32.De Kanter R, De Jager MH, Draaisma AL, Jurva JU, Olinga P, Meijer DK, Groothuis GM. Drug-metabolizing activity of human and rat liver, lung, kidney and intestine slices. Xenobiotica. 2002;32(5):349–62. doi: 10.1080/00498250110112006. [DOI] [PubMed] [Google Scholar]
- 33.Vickers AE, Saulnier M, Cruz E, Merema MT, Rose K, Bentley P, Olinga P. Organ slice viability extended for pathway characterization: an in vitro model to investigate fibrosis. Toxicol Sci. 2004;82(2):534–44. doi: 10.1093/toxsci/kfh285. [DOI] [PubMed] [Google Scholar]
- 34.Vickers AE, Fisher RL. Precision-cut organ slices to investigate target organ injury. Expert Opin Drug Metab Toxicol. 2005;1(4):687–99. doi: 10.1517/17425255.1.4.687. [DOI] [PubMed] [Google Scholar]
- 35.Dogterom P. Development of a simple incubation system for metabolism studies with precision-cut liver slices. Drug Metab Dispos. 1993;21(4):699–704. [PubMed] [Google Scholar]
- 36.Behrsing HP, Vickers AE, Tyson CA. Extended rat liver slice survival and stability monitored using clinical biomarkers. Biochem Biophys Res Commun. 2003;312(1):209–13. doi: 10.1016/j.bbrc.2003.09.216. [DOI] [PubMed] [Google Scholar]
- 37.Nuutinen HU, Salaspuro MP, Valle M, Lindros KO. Blood acetaldehyde concentration gradient between hepatic and antecubital venous blood in ethanol-intoxicated alcoholics and controls. Eur J Clin Invest. 1984;14(4):306–11. doi: 10.1111/j.1365-2362.1984.tb01186.x. [DOI] [PubMed] [Google Scholar]
- 38.Eriksson CJ. Acetaldehyde metabolism in vivo during ethanol oxidation. Adv Exp Med Biol. 1977;85A:319–41. doi: 10.1007/978-1-4899-5181-6_21. [DOI] [PubMed] [Google Scholar]
- 39.Dey A, Cederbaum AI. Alcohol and oxidative liver injury. Hepatology. 2006;43(2 Suppl 1):S63–74. doi: 10.1002/hep.20957. [DOI] [PubMed] [Google Scholar]
- 40.Tuma DJ, Sorrell MF. Effects of ethanol on protein trafficking in the liver. Semin Liver Dis. 1988;8(1):69–80. doi: 10.1055/s-2008-1040529. [DOI] [PubMed] [Google Scholar]
- 41.Lieber CS. Medical disorders of alcoholism. N Engl J Med. 1995;333(16):1058–65. doi: 10.1056/NEJM199510193331607. [DOI] [PubMed] [Google Scholar]


