Abstract
Two [FeII 2(N-EtHPTB)(μ-O2X)]2+ complexes, where N-EtHPTB is the anion of N,N,N′N′-tetrakis(2-benzimidazolylmethyl)-2-hydroxy-1,3-diaminopropane and O2X is O2PPh2 (1•O2PPh2) or O2AsMe2 (1•O2AsMe2), have been synthesized. Their crystal structures both show inter-iron distances of 3.54 Å that arise from a (μ-alkoxo)diiron(II) core supported by an O2X bridge. These diiron(II) complexes react with O2 at low temperatures in MeCN (−40 °C) and CH2Cl2 (−60 °C) to form long-lived O2 adducts that are best described as (μ-η1:η1-peroxo)diiron(III) species (2•O2X) with νO-O ~ 850 cm−1. Upon warming to −30 °C, 2•O2PPh2 converts irreversibly to a second (μ-η1:η1-peroxo)diiron(III) intermediate (3•O2PPh2) with νO-O ~ 900 cm−1, a value which matches that reported for [Fe2(N-EtHPTB)(O2)(O2CPh)]2+ (3•O2CPh) (Dong et al., J. Am. Chem. Soc. 1993, 115, 1851–1859). Mössbauer spectra of 2•O2PPh2 and 3•O2PPh2 indicate that the iron centers within each species are antiferromagnetically coupled with J ~ 60 cm−1, while extended X-ray absorption fine structure analysis reveals inter-iron distances of 3.25 and 3.47 Å for 2•O2PPh2 and 3•O2PPh2, respectively. A similarly short inter-iron distance (3.27 Å) is found for 2•O2AsMe2. The shorter inter-iron distance associated with 2•O2PPh2 and 2•O2AsMe2 is proposed to derive from a triply bridged diiron(III) species with alkoxo (from N-EtHPTB), 1,2-peroxo, and 1,3-O2X bridges, while the longer distance associated with 3•O2PPh2 results from the shift of the O2PPh2 bridge to a terminal position on one iron. The differences in νO-O are also consistent with the different inter-iron distances. It is suggested that the O⋯O bite distance of the O2X moiety affects the thermal stability of 2•O2X, with the O2X having the largest bite distance (O2AsMe2) favoring the 2•O2X adduct and the O2X having the smallest bite distance (O2CPh) favoring the 3•O2X adduct. Interestingly, neither 3•O2AsMe2 nor the benzoate analog of 2•O2X (2•O2Bz) are observed.
INTRODUCTION
Over the last twenty years, a growing family of oxygen-activating, non-heme diiron enzymes has been revealed and cataloged.1–8 Most notably, this group includes soluble methane monooxygenase, the R2 subunit of class I ribonucleotide reductases, toluene and o-xylene monooxygenases, phenol hydroxylase and stearoyl acyl carrier protein Δ9-desaturase. The catalytic cycles of several of these enzymes include peroxide-bridged diiron(III) intermediates that are stable enough to be detected and characterized.9–16 The precise role of the peroxide moieties commonly observed in biological reactions remains poorly understood, in spite of the existence of a fairly large body of work describing them. To complement these biological studies, a variety of biomimetic diiron complexes has been synthesized and characterized.17–26 Using synthetic compounds, it is also not unusual to observe peroxide-bridged diiron(III) species, especially in carboxylate-bridged complexes, wherein a common motif is a (μ-η1:η1-peroxo)diiron(III) moiety.
It is curious that nature evolved mechanisms that include quasi-stable peroxide intermediates as steps along catalytic pathways. The growing number of trapped and characterized synthetic analogues to these peroxo moieties indicates that this inherent stability is not limited to biological systems.17–21 Carboxylates are most often used as bridges supporting the (μ-peroxo)diiron(III) species, with only two papers reporting (μ-peroxo)diiron(III) complexes with non-carboxylate bridges.27,28 To investigate how substitution of the carboxylate bridge would affect the properties of the (μ-peroxo)diiron(III) unit, we synthesized and crystallized two diiron(II) complexes using the ligand N-EtHPTB (anion of N,N,N′N′-tetrakis(2-benzimidazolylmethyl)-2-hydroxy-1,3-diaminopropane), wherein the benzoate bridge of [Fe2(N-EtHPTB)(O2CPh)]2+ (1•O2CPh), a complex first reported in 1990 by Ménage et al.,29 is replaced with diphenylphosphinate (1•O2PPh2) or dimethylarsinate (1•O2AsMe2). Reaction of these new species with O2 produces (μ-η1:η1-peroxo)diiron(III) moieties that exhibit surprising behaviors. In this paper we report the crystallographic details of the precursor diiron(II) complexes and the spectroscopic characterization of their dioxygen adducts.
EXPERIMENTAL SECTION
Materials and Syntheses
All reagents and solvents were purchased from commercial sources and were used as received, unless noted otherwise. The 18O2 (97%) and the 16O2:16O18O:18O2 mixture (1:2:1) were purchased from Cambridge Isotope Laboratories, Inc., Andover, MA. The ligand N-EtHPTB was synthesized using a published procedure.30 Solvents were dried according to published procedures and distilled under Ar prior to use.31 Preparation and handling of air sensitive materials were carried out under an inert atmosphere by using either standard Schlenk and vacuum line techniques or a glovebox. Elemental analyses were performed by Atlantic Microlab, Inc., Norcross, GA.
1•O2PPh2
N-EtHPTB (181 mg, 0.250 mmol) was dissolved in MeOH (~10 mL) along with Et3N (0.19 mL, 1.4 mmol). Diphenylphosphinic acid (54.5 mg, 0.250 mmol) was added and allowed to dissolve. Fe(OTf)2•2MeCN (238 mg, 0.546 mmol) was added, producing a yellow solution. After 5 minutes, NaBPh4 (180 mg, 0.526 mmol) was added, resulting in immediate precipitation of a white powder. The solid was filtered and dried in vacuo. Recrystallization from MeCN and Et2O produced colorless crystals, some suitable for X-ray diffraction structural analysis. Yield: 341 mg (79%). Anal. for [Fe2(N-EtHPTB)(O2PPh2)](BPh4)2 and calcd for C105H102B2Fe2N11O3P: C, 72.89; H, 5.94; N, 8.90%. Found: C, 72.87; H, 5.97; N, 8.84%.
1•O2AsMe2
N-EtHPTB (146.3 mg, 0.202 mmol) was dissolved in MeOH (~10 mL) along with Et3N (0.141 mL, 1.01 mmol). Dimethylarsinic acid (30.0 mg, 0.217 mmol) was added and allowed to dissolve. Fe(OTf)2•2MeCN32 (182.7 mg, 0.419 mmol) was added, producing a yellow solution. After 5 minutes, NaBPh4 (212.8 mg, 0.622 mmol) was added, resulting in immediate precipitation of a white powder. The solid was filtered and dried in vacuo. Recrystallization from MeCN and Et2O produced pale yellow crystals, some suitable for X-ray diffraction structural analysis. Yield: 270 mg (93%). Anal. for [Fe2(N-EtHPTB)(O2AsMe2)](BPh4)(OTf) and calcd for C70H75AsBF3Fe2N10O6S: C, 58.43; H, 5.25; N, 9.73%. Found: C, 58.62; H, 4.97; N, 9.74%.
1•O2CPh
N-EtHPTB (107.6 mg, 0.149 mmol) was dissolved in MeOH (~10 mL) along with Et3N (0.11 mL, 0.82 mmol). Sodium benzoate (23.1 mg, 0.160 mmol) was added and allowed to dissolve. Fe(OTf)2•2MeCN (144.4 mg, 0.331 mmol) was added, producing a yellow solution. After 5 minutes, NaBPh4 (119 mg, 0.348 mmol) was added, resulting in immediate precipitation of a white powder. The solid was filtered and dried in vacuo. Recrystallization from MeCN and Et2O produced pale yellow-green crystals. Yield: 132 mg (71%). Anal. for [Fe2(N-EtHPTB)(O2CPh)](OTf)2 and calcd for C52H54F6Fe2N10O9S2: C, 49.85; H, 4.34; N, 11.18%. Found: C, 49.70; H, 4.38; N, 10.72%.
Physical Methods
UV-Vis spectra were recorded on a Hewlett-Packard 8453 diode array spectrophotometer. Resonance Raman spectra were collected on an ACTON AM-506M3 monochromator with a Princeton LN/CCD data collection system using a Spectra-Physics Model 2060 krypton laser. Low-temperature spectra of the peroxo intermediates in CH2Cl2 and MeCN were obtained at 77 K using a 135° backscattering geometry. Samples were frozen onto a gold-plated copper cold finger in thermal contact with a Dewar flask containing liquid nitrogen. Raman frequencies were referenced to the features of indene. Slits were set for a band-pass of 4 cm−1 for all spectra. Mössbauer spectra were recorded with two spectrometers, using Janis Research Super-Varitemp dewars that allowed studies in applied magnetic fields up to 8.0 T in the temperature range from 1.5 to 200 K. Mössbauer spectral simulations were performed using the WMOSS software package (WEB Research, Edina, MN). Isomer shifts are quoted relative to Fe metal at 298 K.
X-ray diffraction crystallography
X-ray diffraction data were collected on a Bruker SMART platform CCD diffractometer at 173(2) K.33 Preliminary sets of cell constants were calculated from reflections harvested from three sets of 20 frames. These initial sets of frames were oriented such that orthogonal wedges of reciprocal space were surveyed. The data collection was carried out using MoKα radiation (graphite monochromator). Randomly oriented regions of reciprocal space were surveyed to the extent of one sphere and to a resolution of 0.84 Å. The intensity data were corrected for absorption and decay using SADABS.34 Final cell constants were calculated after integration with SAINT.35 The structures were solved and refined using SHELXL-97.36 The space group P21/c was determined based on systematic absences and intensity statistics. Direct-methods solutions were calculated which provided most non-hydrogen atoms from the E-map. Full-matrix least squares / difference Fourier cycles were performed which located the remaining non-hydrogen atoms. All non-hydrogen atoms were refined with anisotropic displacement parameters. All hydrogen atoms were placed in ideal positions and refined as riding atoms with relative isotropic displacement parameters. Brief crystal data and intensity collection parameters for the crystalline complexes are shown in Table 1. Complete crystallographic details, atomic coordinates, anisotropic thermal parameters, and fixed hydrogen atom coordinates are given in the Supporting Information.
Table 1.
Crystal data and structure refinement for 1•O2PPh2(BPh4)2•MeCN and 1•O2AsMe2(BPh4)(OTf)•MeCN.
| 1•O2PPh2(BPh4)2•MeCN | 1•O2AsMe2(BPh4)(OTf) •MeCN | |
|---|---|---|
| empirical formula | C105H102B2Fe2N11O3P | C72H78BF3 Fe2N11O6S |
| fw | 1730.27 | 1479.94 |
| T (K) | 173(2) | 173(2) |
| Mo K α λ, Å | 0.71073 | 0.71073 |
| space group | P21/c | P21/c |
| a (Å) | 18.937(4) | 16.1151(12) |
| b (Å) | 23.855(5) | 15.6370(12) |
| c (Å) | 21.817(5) | 28.473(2) |
| α (deg) | 90 | 90 |
| β (deg) | 114.903(4) | 103.4900(10) |
| γ (deg) | 90 | 90 |
| V (Å3) | 8940(3) | 6977.0(9) |
| Z | 4 | 4 |
| ρ (calc), Mg/m3 | 1.286 | 1.409 |
| abs coeff (mm−1) | 0.402 | 0.985 |
| R1a | 0.0492 | 0.0338 |
| wR2b | 0.0957 | 0.0798 |
R1 = Σ||Fo|−|Fc|| / Σ|Fo|.
wR2 = [Σ[w(Fo 2−Fc2)2] / Σ [w(Fo2)2]]1/2.
X-ray absorption spectroscopy
XAS data were collected on beamline 9-3 at Stanford Synchrotron Radiation Lightsource (SSRL) of the SLAC National Accelerator Laboratory and on beamline X3B at the National Synchrotron Lightsource of Brookhaven National Laboratory (NSLS). At SSRL, the synchrotron ring SPEAR was operated at 3.0eV and 50–100 mA beam current. Energy resolution of the focused incoming X-rays was achieved using a Si(220) double crystal monochromator, which was then detuned to 50% of maximal flux to attenuate second harmonic X-rays. At NSLS, the synchrotron ring was operated at 2.8 GeV and 100–300 mA beam current and a Si(111) double crystal monochromator was used. Fluorescence data were collected over the energy range of 6.8 – 8.0 keV using a 30-element Ge detector (SSRL) or 13-element Ge detector (NSLS). The beam spot size on samples was 5 mm (horizontal) × 1 mm (vertical). Thirteen scans were collected for 2•O2AsMe2 at NSLS (55 minutes/scan) and fourteen scans were collected for 2•O2PPh2 and 3•O2PPh2 at SSRL (25 minutes/scan). All spectra were referenced against an iron foil.
Pre-edge quantification was carried out with the SSExafs program using a standard procedure.37 Standard procedures were used to reduce, average and process the raw data using the EXAFSPAK package,38 which was also used for EXAFS fitting. Theoretical EXAFS amplitude and phase functions were calculated using the FEFF package (version 8.4). The input models for FEFF calculations are shown in Figures S1 and S2. The parameters r and σ2 were floated, while n was kept fixed for each fit and systematically varied in integer steps between fits. Scale factor was fixed at 0.9 and threshold energy (E0) was varied but maintained at a common value for all shells. The goodness of fit (GOF) was determined using Equation 1:
| Eq. (1) |
where N is the number of data points.39
RESULTS
Several diiron enzymes activate O2 via (μ-η1:η1-peroxo)diiron(III) intermediates.9–14,16 In order to better understand the behavior of these biological moieties, we synthesized two diiron(II) complexes and characterized their O2 adducts. Combining two equivalents of Fe(OTf)2•2MeCN with one equivalent of the ligand N-EtHPTB followed by addition of one equivalent of either diphenylphosphinic acid or dimethylarsinic acid afforded complexes with the general formulation [Fe2(N-EtHPTB)(O2X)](Y)2 (cation = 1•O2X where O2X = O2PPh2 or O2AsMe2 and Y = counter anions). Recrystallization of these compounds from MeCN and diethyl ether produced crystals suitable for X-ray diffraction structural analysis (Table 1). In solution, these complexes reacted with dioxygen at low temperatures, producing intermediates that were characterized using UV-Vis, resonance Raman, Mössbauer and X-ray absorption spectroscopies.
X-ray crystallography
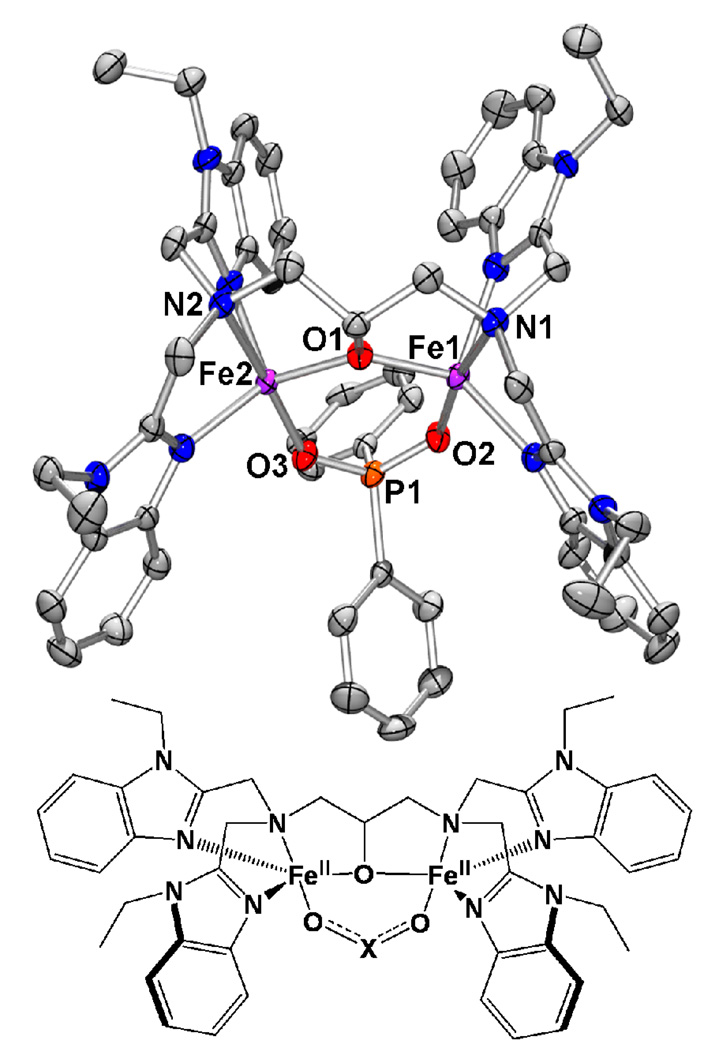
The results from analysis of the 1•O2PPh2 and 1•O2AsMe2 structures are compared in Table 2 with information from the previously published crystal structure of 1•O2CPh.29,40 Figure 1 shows an ORTEP view of 1•O2PPh2 with the hydrogen atoms removed as well as a cartoon of the general structure shared by all three cations. In each complex, both metal atoms are five-coordinate iron(II) and form a six-membered ring along with three atoms of the bridging moiety and the ligand alkoxide oxygen. Other similarities include distorted trigonal-bipyramidal iron centers, the axial positions of which are occupied by amine nitrogen atoms and bridging moiety oxygen atoms. The equatorial sites are occupied by benzimidazole nitrogen atoms and the alkoxide oxygen atom. For the most part, the interatomic distances and angles do not significantly fluctuate between species. However, variations of note include the O-C-O, O-P-O and O-As-O angles formed by the three-atom linkers between the iron atoms, with values of 113.26(7) (1•O2AsMe2), 115.59(13) (1•O2PPh2) and 124.2(7) (1•O2CPh) degrees, and the geometry about the iron atoms, with average τ values41 of 0.81 (1•O2AsMe2), 0.77 (1•O2PPh2) and 0.93 (1•O2CPh).
Table 2.
Selected interatom distances and bond angles for [Fe2(N-EtHPTB)(O2X)]2+.
| 1•O2PPh2 | 1•O2AsMe2 | 1•O2CPh* | |
|---|---|---|---|
| τave | 0.77 | 0.81 | 0.93 |
| Interatom distances (Å) | |||
| Fe1-O1 | 2.004(2) | 2.0145(13) | 1.976(5) |
| Fe2-O1 | 1.992(2) | 2.0037(14) | 1.964(5) |
| Fe1-N1 | 2.294(3) | 2.3366(16) | 2.316(6) |
| Fe2-N2 | 2.352(3) | 2.3892(16) | 2.280(7) |
| Fe1-O2 | 2.008(2) | 1.9825(14) | 2.057(5) |
| Fe2-O3 | 2.021(2) | 1.9863(14) | 2.019(6) |
| Fe1-N3 | 2.086(3) | 2.1372(17) | 2.064(6) |
| Fe1-N5 | 2.115(3) | 2.1023(18) | 2.069(6) |
| Fe2-N7 | 2.075(3) | 2.1088(17) | 2.080(6) |
| Fe2-N9 | 2.098(3) | 2.0759(17) | 2.064(6) |
| P1/C44/As1-O2 | 1.514(2) | 1.6740(15) | 1.264(9) |
| P1/C44/As1-O3 | 1.512(2) | 1.6776(14) | 1.253(9) |
| Fe1 ⋯·Fe2 | 3.5405(10) | 3.5357(5) | 3.4749(31) |
| O2·⋯ O3 | 2.5600(32) | 2.7991(21) | 2.2251(74) |
| Bond angles (degrees) | |||
| Fe1-O1-Fe2 | 124.76(11) | 123.27(6) | 123.8(2) |
| O1-Fe1-O2 | 105.55(9) | 105.77(6) | 98.6(2) |
| O1-Fe2-O3 | 99.44(9) | 107.92(6) | 101.5(2) |
| Fe1-O2-P1/C44/As1 | 132.01(14) | 127.24(8) | 136.4(5) |
| Fe2-O3-P1/C44/As1 | 138.88(15) | 128.15(8) | 133.9(5) |
| O2-P1/C44/As1-O3 | 115.59(13) | 113.26(7) | 124.2(7) |
Data for 1•O2CPh were re-refined using full-matrix least-squares on F2 and atoms were renamed to match labeling scheme of 1•O2PPh2 and 1•O2AsMe2. The new solution was deposited directly with the Cambridge Crystallographic Data Centre (deposition number CCDC 731669). Values in the table represent recalculated distances and angles.
Figure 1.
Crystal structure of the cation 1•O2PPh2 (50% ellipsoids) with hydrogen atoms removed. Generic cartoon of 1•O2X: O2X = O2AsMe2 (1•O2AsMe2), O2PPh2 (1•O2PPh2), O2CPh (1•O2CPh).
Clearly, the differences observed between the three-atom linker angles in each complex result from the different hybridization of the central atom. The central carbon atom in the benzoate bridge is sp2 hybridized, producing an angle three degrees greater than the ideal 120 degrees predicted for trigonal planar geometry. As the benzoate oxygen atoms bind to the iron atoms, they must spread apart to accommodate the inter-iron distance (3.4749(31) Å), producing an O-C-O angle of 124.2(7) degrees. The same effect is observed in the diphenylphosphinate and dimethylarsinate bridged complexes, where the central atom in each three-atom linker is sp3 hybridized. However, instead of producing angles of 109.5 degrees, the ligated oxygen atoms are forced apart to accommodate the inter-iron distances of 3.5357(5) (1•O2AsMe2) and 3.5405(10) (1•O2PPh2) Å, producing respective O-As-O and O-P-O angles of 113.26(7) and 115.59(13) degrees.
Interestingly, the inter-iron distances found in 1•O2AsMe2 and 1•O2PPh2 are greater than that found in 1•O2CPh, in spite of the fact that the former complexes produce sharper angles with their three-atom linkers. Examination of the bond lengths between the oxygen atoms and the central atom in the three-atom linker of each complex reveals a trend with distances in 1•O2AsMe2 being ~0.16 Å longer than those in 1•O2PPh2, which in turn contains distances ~0.25 Å than those found in 1•O2CPh. The longer As-O and P-O bond lengths found in 1•O2AsMe2 and 1•O2PPh2 result in significantly increased O⋯O bite distances of 2.7991(21) (1•O2AsMe2) and 2.5600(32) Å (1•O2PPh2) versus 2.2251(74) Å (1•O2CPh). This shorter distance in 1•O2CPh is reflected in a shorter inter-iron distance, in spite of the fact that the three-atom linker has a wider angle than the linkers in either 1•O2PPh2 or 1•O2AsMe2.
UV-Vis spectroscopy
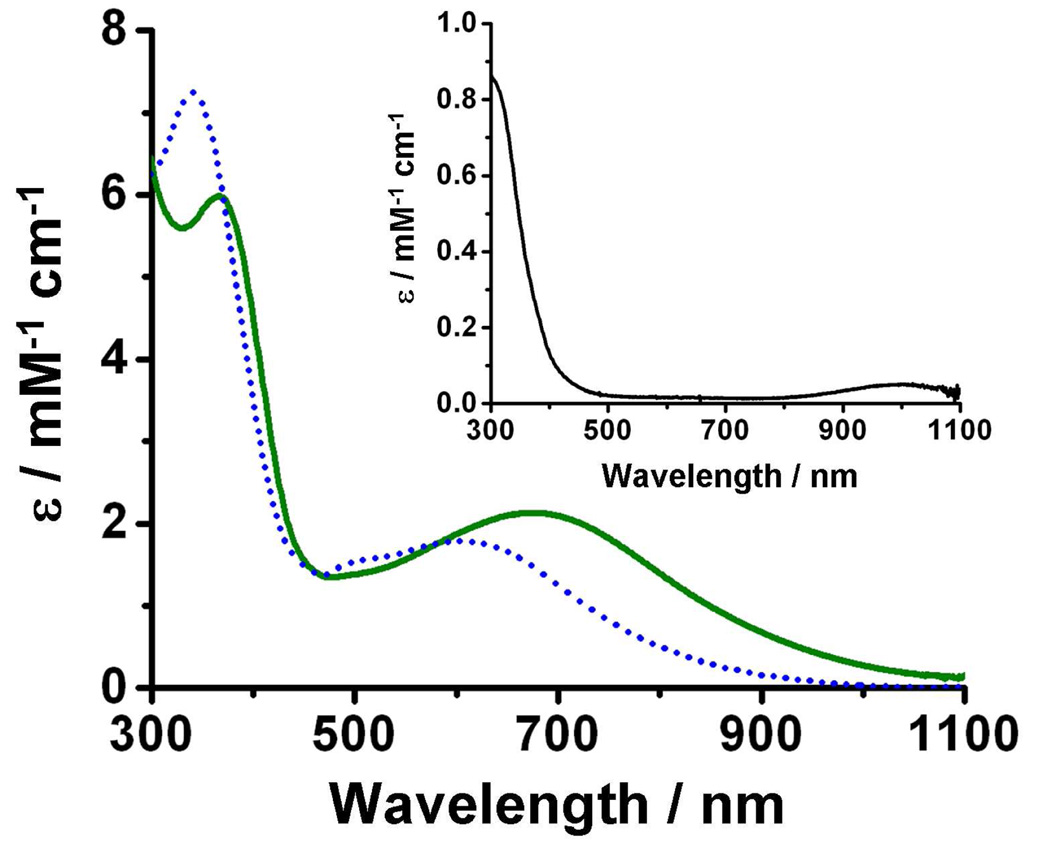
The UV-Vis spectrum of 1•O2PPh2 in CH2Cl2 has no notable features except for a UV tail and an extremely weak absorbance maximum around 1000 nm (Figure 2, inset). Bubbling dioxygen through this solution at −80 °C elicits an intense green-blue color (Figure 2, solid green line) with absorption maxima at 368 and 678 nm (2•O2PPh2). Upon warming to −30 °C, the green-blue solution becomes deep blue over an 8-minute period (Figure 2, dotted blue line). The absorption maximum at 368 nm shifts to 344 nm while gaining intensity, the maximum at 678 nm shifts to 621 nm with concomitant loss of intensity and a new shoulder appears at 509 nm (Figure S3). The complex spectral changes and the lack of true isosbestic points suggest the appearance of more than one species during this time period. Further warming to room temperature produces the final product, a yellow solution (4•O2PPh2) with no remarkable absorption features in the visible spectrum.
Figure 2.
UV-Vis spectra of 1•O2PPh2 (inset), 2•O2PPh2 (solid green line) and mostly 3•O2PPh2 (dotted blue line) in CH2Cl2.
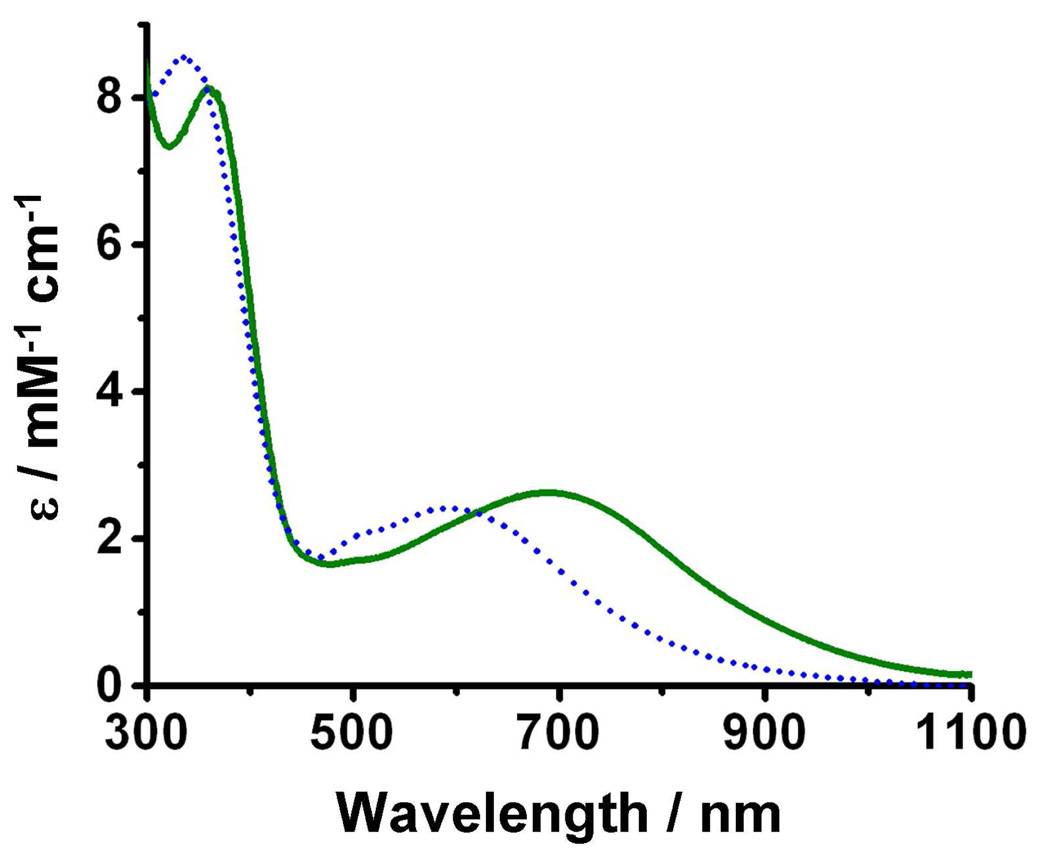
Oxygenation of 1•O2PPh2 in MeCN at −40 °C produces a green-blue solution (λmax = 686 nm) with spectroscopic characteristics (Figure 3, solid green line) similar to those of 2•O2PPh2 in CH2Cl2 at −80 °C. However, in contrast to complications observed when warming the latter, warming the MeCN solution to −30 °C and maintaining that temperature for 15 minutes results in clean conversion to a deep blue solution (3•O2PPh2) with a visible absorption maximum at 590 nm (Figure 3, dotted blue line), corresponding to the 588-nm peak observed upon oxygenation of 1•O2CPh.29 Unlike the reaction in CH2Cl2, conversion from 2•O2PPh2 to 3•O2PPh2 in MeCN produces true isosbestic points at 363 and 618 nm (Figure S2). Warming to room temperature causes 3•O2PPh2 to decay to the final product, a yellow solution (4•O2PPh2) with no remarkable absorption features in the visible spectrum.
Figure 3.
UV-Vis spectra recorded at −40 °C in MeCN for 2•O2PPh2 (solid green) and 3•O2PPh2 (dotted blue).
Oxygenation of 1•O2AsMe2 in MeCN at −40 °C changes the almost colorless solution to a deep green-blue color with UV-Vis absorption maxima at 348 and 632 nm (Figure S5) associated with 2•O2AsMe2. It exhibits UV-Vis absorption features analogous to those of 2•O2PPh2, but the similarity ends there. Instead of converting to a different species when warmed to −30 °C, 2•O2AsMe2 is stable for more than an hour, at which point observation was aborted. Warming this solution to 0 °C leads to slow decay with ~25% loss of intensity at 632 nm over a four-hour period. Gradual blue-shifting of the absorbance maxima in conjunction with the presence of time traces that cannot be fit to first-order decay rates leads us to hypothesize that the system passes through an unobserved intermediate (3•O2AsMe2) comparable to 3•O2PPh2 prior to complete decay to the yellow product (4•O2AsMe2).
Resonance Raman Spectroscopy
Resonance Raman (rR) spectroscopy is a particularly effective technique for examining vibrational transitions in complexes that have strong chromophores. In light of this fact, rR spectra of 2•O2AsMe2, 2•O2PPh2 and 3•O2PPh2 were collected, analyzed and compared with spectra presented in earlier reports21,26,40,42–46 in an attempt to gain insight into their individual molecular structures.
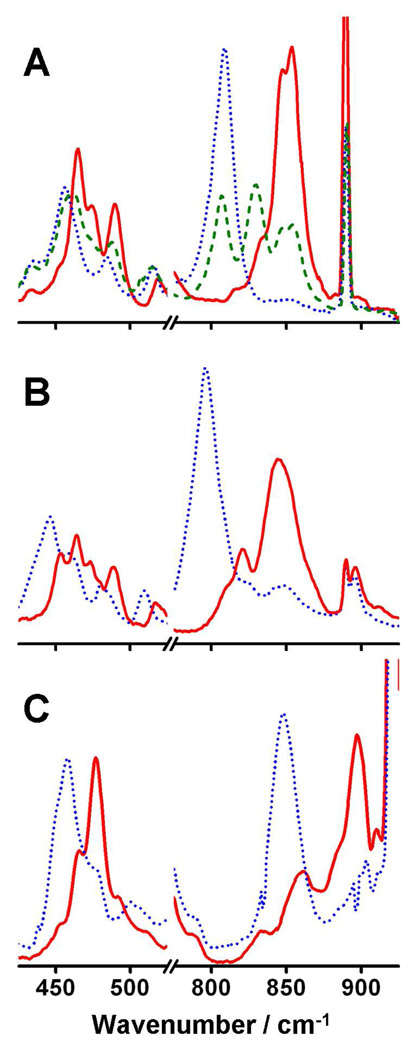
The rR spectrum of 2•O2PPh2 in frozen CH2Cl2 using 16O2 and 647.1 nm excitation shows two intense peaks at 845 and 853 cm−1 in addition to three peaks at 465, 475 and 490 cm−1 (Figure 4A, solid red line). These features suggest the presence of an iron(III)-peroxo chromophore. With the use of 18O2 (Figure 4A, dotted blue line), the peaks at 845 and 853 cm−1 shift to a single peak at 807 cm−1. This shift of 42 cm−1 is in agreement with the change predicted for an O-O oscillator by application of Hooke’s law, thereby assigning the peaks at 845 and 853 cm−1 as a Fermi doublet of νO-O. Additionally, with use of 18O2, the peaks at 465, 475 and 490 cm−1 are replaced with peaks at 455 and 484 cm−1. Again, using Hooke’s law, we can assign the peaks at 465 and 475 cm−1 to a Fermi doublet representing νFe-O, which collapses to a single peak at 455 cm−1 upon 18O substitution. The peak at 490 cm−1 clearly shifts to lower energy in the 18O isotopomer, but the change of only 6 cm−1 and the relative weakness of the signal lead us to suspect that this peak arises from a ligand vibration coupled to the Fe-O stretch.
Figure 4.
Resonance Raman spectra of frozen solutions of 2•O2PPh2 in CH2Cl2 (A), 2•O2AsMe2 in CH2Cl2 (B) and 3•O2PPh2 in MeCN (C). Solid red = 16O2. Dotted blue = 18O2. Dashed green = Mixed O2.
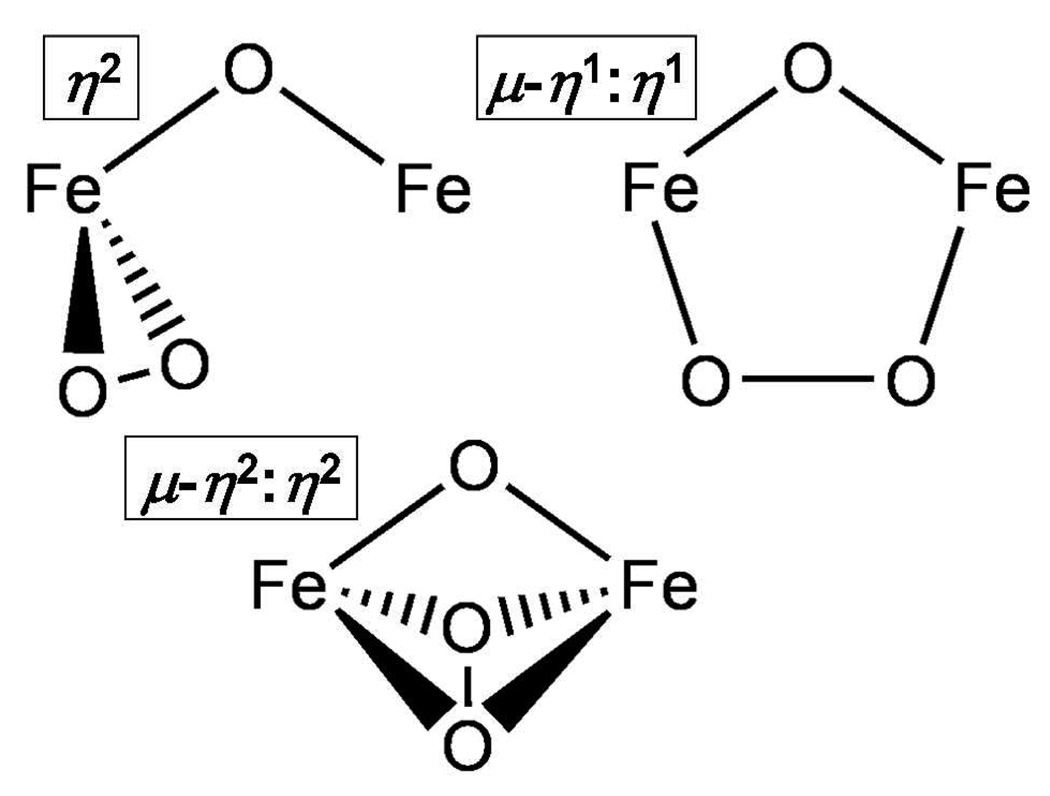
Repeating this experiment using a mixture of 16O2, 18O2 and 16O18O (Figure 4A, dashed green line) allowed us to gain insight into the peroxo binding mode. While the νFe-O region is not well resolved, the νO-O region clearly shows peaks at 806, 829, 845 and 853 cm−1, corresponding to features arising from the 18O-18O, 16O-18O and 16O-16O isotopomers, respectively. The peak at 829 cm−1 is assigned to ν16O–18O by comparison with the spectra obtained from the 16O2 and 18O2 isotopomers. The appearance of only a single peak between 806 and 845 cm−1 with a linewidth comparable to those of the ν16O-16O and ν18O-18O peaks indicates that the dioxygen moiety is symmetrically ligated. Three possible symmetric coordination modes are shown in Figure 5.
Figure 5.
Possible O2 coordination modes in Fe2O2-alkoxo core.
The rR spectrum of 3•O2PPh2 generated by using 16O2 in MeCN shows peaks at 477 and 897 cm−1 (Figure 4C, solid red line), corresponding to νFe-O and νO-O, respectively. Using 18O2 to generate the sample respectively shifts these peaks to 458 and 848 cm−1 (Figure 4C, dotted blue line), confirming the assignments. Similar results are obtained for 3•O2PPh2 generated in CH2Cl2 (Figure S6), but the samples were contaminated with residual 2•O2PPh2 due to incomplete conversion, preventing precise assignment of νFe-O.
Raman spectra of 2•O2AsMe2 (Figure 4B) generated in CH2Cl2 using either 16O2 (solid red line) or 18O2 (dotted blue line) reveal peaks assigned to νO-O at 845 and 796 cm−1, respectively. The peak at 464 cm−1 in the 16O2 spectrum shifts to 443 cm−1 upon 18O2 substitution and is assigned to Fe-O.
From an examination of the rR data summarized in Table 3, we see that νO-O can be used to group the oxygenated intermediates into two categories. Raman shifts near 850 cm−1 are characteristic of the first category, which includes the 2•O2X species. The second category consists of complexes that exhibit νO-O near 900 cm−1 and includes the 3•O2X intermediates. In addition to segregating the intermediates, the νO-O values ranging from ~850–900 cm−1 demonstrate that all of the species in each group are peroxo complexes.
Table 3.
Physical properties of 2•O2X and 3•O2X complexes.
| Complex | Solvent | λmax (nm) | μO-O (cm−1) | μFe-O (cm−1) | J (cm−1) | δ (mm/s) | ΔEQ (mm/s) | ηf | Fe⋯Fe (Å) |
|---|---|---|---|---|---|---|---|---|---|
| [ε] (M−1 cm−1) | [18O2] | [18O2] | |||||||
| 2•O2AsMe2 | MeCN | 348, 632 | 845a | 464a | 3.27 | ||||
| [7300, 2100] | [796] | [443] | |||||||
| 2•O2PPh2 | CH2Cl2 | 368, 678 | 845, 853 | 465, 475 | 57 ± 7 | 0.56(1) | −1.26(2) | 0.4 | |
| [6000, 2100] | [829]b[807] | [455] | |||||||
| 2•O2PPh2 | MeCN | 358, 686 | 845, 853 | 465, 476 | 57 ± 7 | 0.56(1) | −1.26(2) | 0.4 | 3.25 |
| [7400, 2200] | [807] | [455] | |||||||
| 2•O2CPh | CH2Cl2 | not observed | |||||||
| 3•O2AsMe2 | MeCN | not observed | |||||||
| 3•O2PPh2c | CH2Cl2 | 344, 509, 621 | 898 | 60 ± 10 | 0.56(2) | 0.86(5) | ~0 | ||
| [7200, 1600, 1800] | [845] | 0.54(2) | −0.52(3) | ~0 | |||||
| 3•O2PPh2d | MeCN | 338, 509, 590 | 897 | 477 | 60 ± 10 | 0.53(2) | −1.03(4) | ~1 | 3.47 |
| [8300, 2000, 2300] | [848] | [458] | |||||||
| 3•O2CPh e | CH2Cl2 | 588 | 900 | 476 | |||||
| [1500] | [850] | [460] |
Measured in CH2Cl2.
μ0-O from 16O18O.
Resonance Raan spectroscopy indicates incomplete conversion; some 2•O2PPh2 remains, probably red-shifting the peroxo-to-metal charge transfer to 621 nm. In addition, an unknown amount of 3•O2PPh2 has decayed to 4•O2PPh2, reducing the measured extinction coefficients.
Mössbauer values represent 80% of the total iron.
Values from reference 40.
η= (Vxx − Vyy)/Vzz is the asymmetry parameter of the electric field gradient tensor.
Mössbauer spectroscopy
Using Mössbauer spectroscopy, we examined 2•O2PPh2 and 3•O2PPh2 in frozen CH2Cl2 and MeCN solutions. Unfortunately, the chlorine atoms of dichloromethane have a very high extinction coefficient at 14.4 KeV and one can therefore not study samples with a pathlength of more than 1 mm. However, freezing a 1-mm thick CH2Cl2 solution generates an intolerably uneven sample thickness due to meniscus formation. We found a simple solution to the problem by dripping ca. 80 µl of dichloromethane solution onto a stack of five Fisher-brand paper filter discs stacked into the one-cm-diameter Mössbauer cup. After freezing we obtained homogeneous and firmly packed samples.
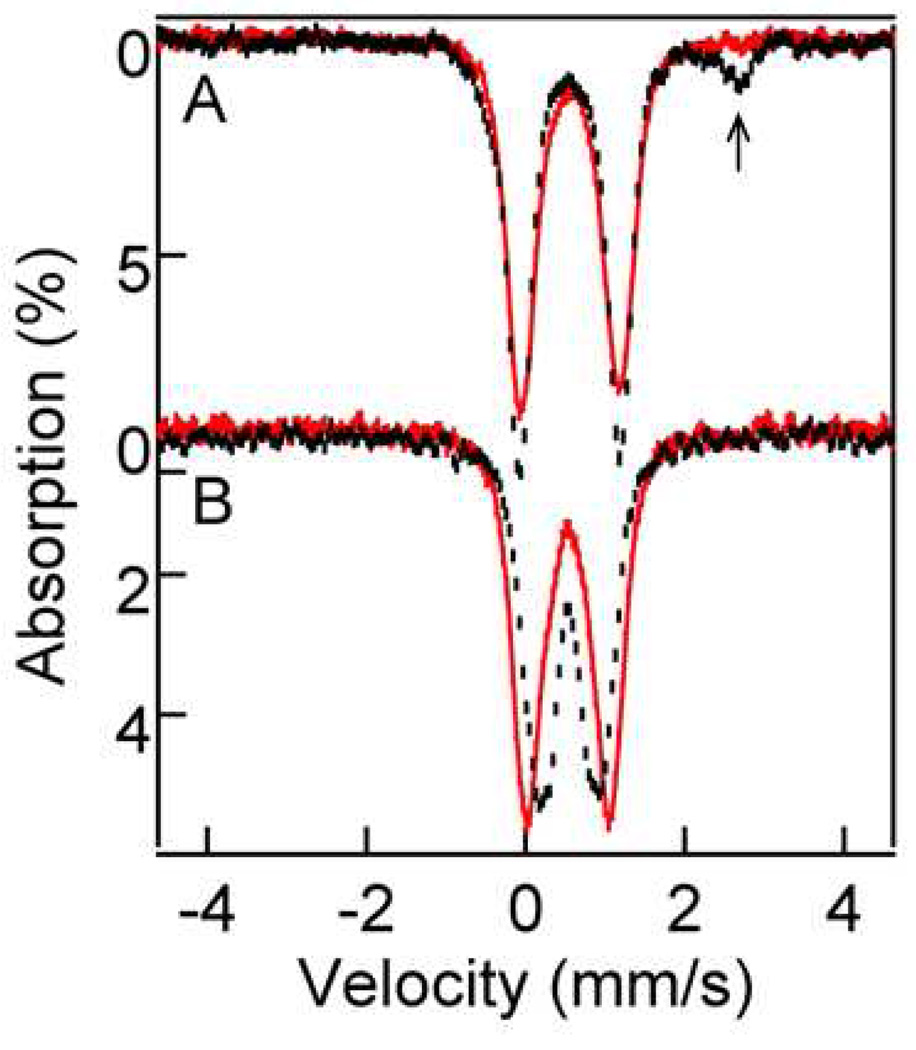
Figure 6 shows 4.2 K Mössbauer spectra of 2•O2PPh2 (A) and 3•O2PPh2 (B) in CH2Cl2 (black hash marks) and MeCN (solid red lines). In both solvents 2•O2PPh2 exhibits one doublet with quadrupole splitting ΔEQ = 1.26 mm/s and isomer shift δ= 0.56 mm/s. The CH2Cl2 sample contains a high-spin iron(II) contaminant (~15%, arrow), most likely belonging to diiron(II) starting material.
Figure 6.
4.2 K zero field spectra of 2•O2PPh2 (panel A) in CH2Cl2 (black hash marks) and MeCN (solid red line), and 3•O2PPh2 (panel B) in CH2Cl2 (black hash marks) and MeCN (solid red line). The high-energy line of a diiron(II) contaminant is marked by an arrow).
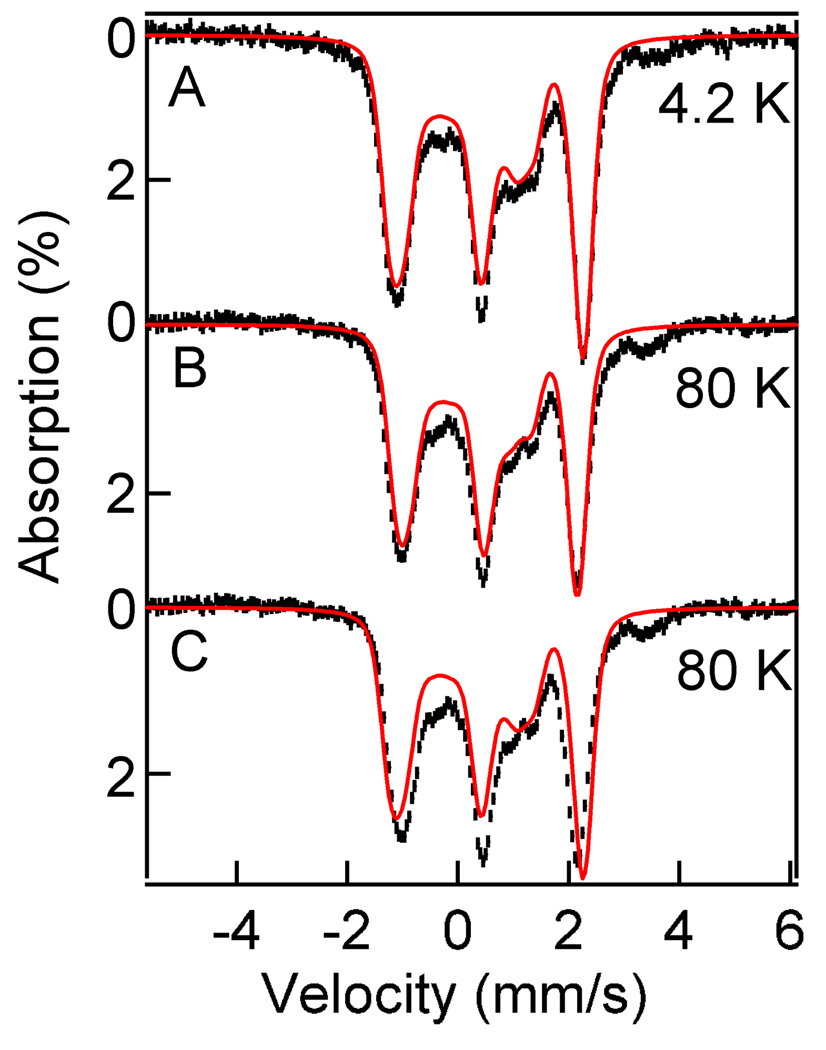
Figure 7 shows 8.0 T spectra of 2•O2PPh2 recorded at 4.2 K (A) and 80 K (B,C). The 4.2 K spectrum reveals that the dinuclear complex, as expected, has a ground state with cluster spin S = 0. The variable temperature spectra, taken at 50 K (not shown) and 80 K were analyzed with a spin Hamiltonian appropriate for an exchange coupled dinuclear complex comprising two high-spin (S1 = S2 = 5/2) iron(III) ions (Equation 2, where all symbols have their conventional meanings). For the iron(III) sites considered here, the zero-field splitting parameters D1,2 are generally on the order of 1 cm−1 and can be neglected.
| Eq. (2) |
Figure 7.
8.0 T Mössbauer spectra of 2•O2PPh2 in CH2Cl2 recorded at 4.2 K (A) and 80 K (B). The solid red lines are theoretical curves using the parameters listed in Table 3. The data in shown (C) are the same as in (B); the solid red line in (C) is a simulation obtained by assuming (wrongly) that only the S= 0 ground state is occupied at 80 K (2Spin simulation for J = 1000 cm−1). The solid red line in (B) was obtained for J = 57 cm−1 (alternatively, one can simulate the spectrum by assuming a state with S = 0 and adjust the applied field to B = 7.35 T).
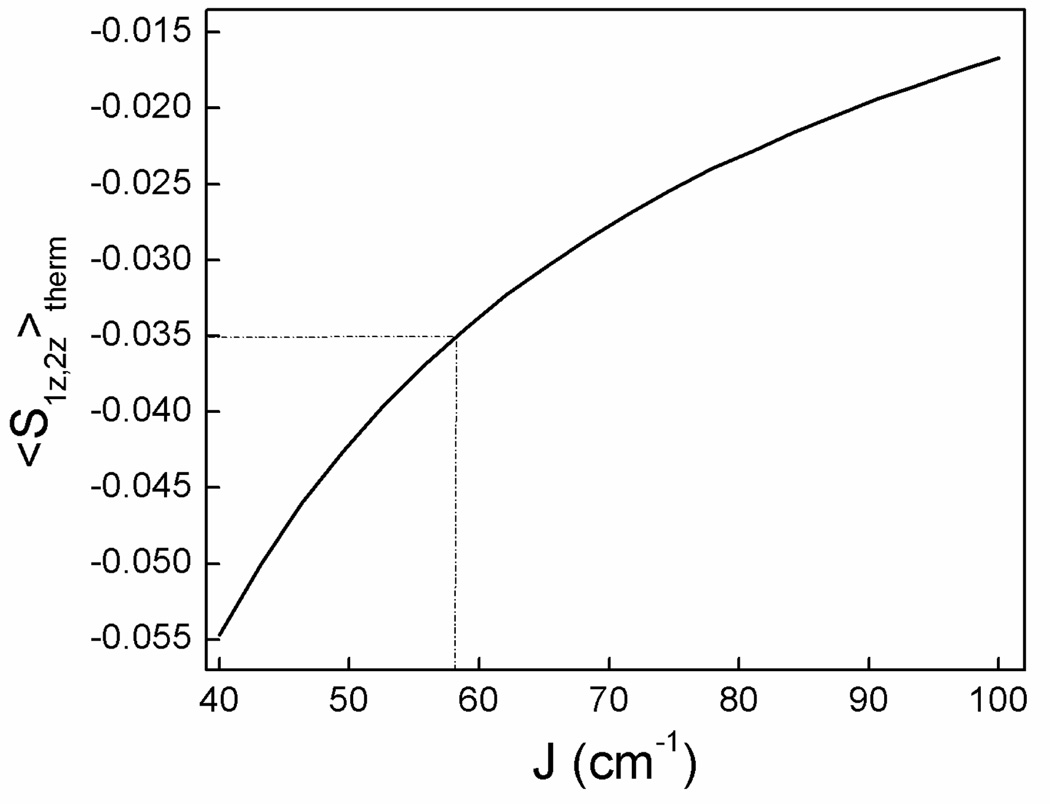
The determination of J by Mössbauer spectroscopy has been described in the literature.47,48 For an external field B = 8.0 T, applied parallel to the observed γ-rays, one compares the effective field at the iron nuclei, Beff(i) = B + Bint(i), at 4.2 K and some higher temperature, say 80 K. At 4.2 K only the S = 0 ground state of the diiron(III) cluster is populated, and thus Beff(i) = B. At 80 K higher excited states of the spin ladder can become populated (essentially the S = 1 manifold, S1 + S2 = S), and in the limit of fast electronic transitions among the thermally populated spin levels, the two iron nuclei experience an internal magnetic field Bint(i) = − <Si>th Ao(i) /gnβn, where <Si>th is the thermally averaged expectation value of the spin for site i. For non-heme octahedral sites with N/O coordination we can take Ao(i) = −21 T. The expression for Bint is quite simple, because zero-field splittings can be ignored and because the magnetic hyperfine interactions of iron(III) sites are generally isotropic. Figure 8 shows a plot of <S1z>th = <S2z>th vs. J for B = 8.0 T evaluated at T = 8.0 T.
Figure 8.
Thermally averaged spin expectation values, <S1z>th = <S2z>th, calculated at 80 K for an applied field B = 8.0 T, for an antiferromagnetically coupled dimer comprising two high-spin (S1 = S2 = 5/2) iron(III) ions for the Hamiltonian ℋ = JS1·S2 + 2β(S1 + S2) · B. The zero-field splittings of the iron(III) sites are small and can be ignored.
The solid red line in the 4.2 K spectrum of Figure 7A is a simulation assuming that only the S = 0 ground state is populated. The solid red line drawn into the 80 K spectrum of (C) is the same curve as shown in (A). It can be seen that the experimental splitting at 80 K is smaller than expected for a strictly diamagnetic compound. At 80 K the diiron center is magnetically isotropic, and thus Bint is antiparallel (Bint < 0) to the applied field. Simulating the 8.0 T spectrum with an “applied” field of 7.35 T yields the solid red line of Figure 7B. Taking Ao = −21 T yields <Si,z>th = −0.035 and, thus from the graph of Figure 8, a J-value slightly smaller than 60 cm−1. Our best simulations using the full Hamiltonian of Eq. 2 (the 2Spin option of WMOSS) yielded J = (57 ± 7) cm−1 for 2•O2PPh2, taking also into account an 8.0 T spectrum recorded at 50 K (not shown). The same J-value was obtained for 2•O2PPh2 in MeCN.
The zero-field spectra of 3•O2PPh2 depend on which solvent is used (Figure 6B). The CH2Cl2 spectrum is best represented by assuming two doublets of equal intensity with δ(1) = 0.56 and δ(2) = 0.58 mm/s and ΔEQ(1) = 0.86 and ΔEQ(2) = −0.52 mm/s. In contrast, the spectrum of the MeCN sample is best represented by one doublet with δ= 0.53 mm/s and ΔEQ = −1.03 mm/s (representing ~80% of Fe); the remainder may belong to a doublet with ΔEQ ~ −0.90 mm/s or, alternatively, belong to a distribution of minority species. Analysis of the 8.0 T spectra of 3•O2PPh2 in MeCN, shown in Figure S7, again suggests a J-value of ~ 60 cm−1, as do the 8.0 T spectra in CH2Cl2 (Figure S8).
The Mössbauer parameters of each characterized complex are summarized in Table 3. We found that within error, the J values are almost equivalent across the permutations of species and solvents. The same is true of the isomer shifts. However, the quadrupole splitting values determined for this series of complexes range from −1.26 to 0.86 mm/s and in the case of 3•O2PPh2 in CH2Cl2, the presence of two distinct doublets revealed that the two iron atoms in this complex exist in different environments, a property unique to this species/solvent combination.
X-ray Absorption Spectroscopy
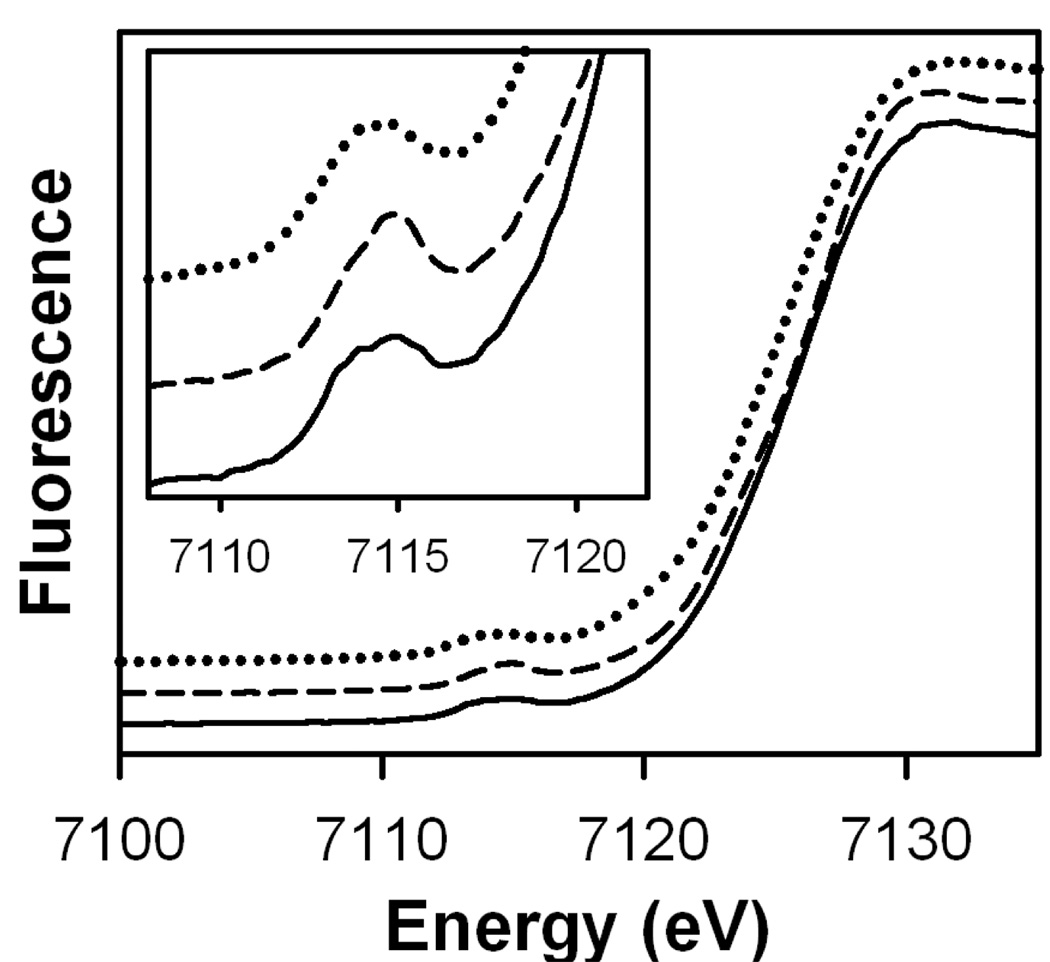
To date, intermediates 2•O2PPh2, 3•O2PPh2 and 2•O2AsMe2 have not yielded crystals of sufficient quality for X-ray diffraction characterization. To gain further insight into the structures of these complexes, we resorted to X-ray absorption spectroscopy (XAS), including X-ray absorption near-edge structure (XANES) and X-ray absorption fine structure (EXAFS) analyses. Figure 9 shows XANES of 2•O2AsMe2, 2•O2PPh2, and 3•O2PPh2 with parameters shown in Table 4. Edge energies (E0) assigned to the inflection points of these spectra are ~ 7126 eV, higher than the values typical of diiron(III) clusters containing an oxo bridge (~ 7123 – 7124 eV), including diiron(III) peroxo complexes reported by Fiedler et al.26 Westre et al. reported that (μ-oxo)diiron(III) complexes have edge energies ~2 eV lower than those found for (μ-hydroxo)diiron(III) complexes.49 Pre-edge peaks observed at ~ 7114 – 7115 eV in our complexes are typical of diiron(III) clusters.26,49 It has been shown that an oxo bridge distorts the geometry of a diiron cluster, resulting in a more intense symmetry forbidden 1s → 3d transition.50 Our measured pre-edge areas of ~ 15 – 16 units are smaller than the ~ 20 units (derived by the same standard method developed by Scarrow)37 found for 6-coordinate (μ-oxo)(μ-peroxo)diiron(III) clusters.26 It follows that the higher edge energies and smaller pre-edge areas observed in the XANES parameters of 2•O2AsMe2, 2•O2PPh2, and 3•O2PPh2 are indicative of 6-coordinate diiron(III) complexes without oxo bridges.
Figure 9.
Fe K-edge X-ray absorption spectroscopy near edge structures (XANES, fluorescence excitation) of 2•O2PPh2 (top), 2•O2AsMe2 (middle), and 3•O2PPh2 (bottom). Inset: Magnified pre-edge absorption peaks.
Table 4.
XANES parameters for complexes 2•O2PPh2, 2•O2AsMe2 and 3•O2PPh2.
| Complex | E0 (eV) | Epre-edge (eV) | Pre-edge area |
Pre-edge width |
|---|---|---|---|---|
| 2•O2PPh2 | 7126.2 | 7114.6 | 15.8(3) | 3.84(6) |
| 2•O2AsMe2 | 7125.9 | 7114.3 | 15.1(4) | 3.66(8) |
| 3•O2PPh2 | 7126.3 | 7114.7 | 16.1(2) | 3.14(4) |
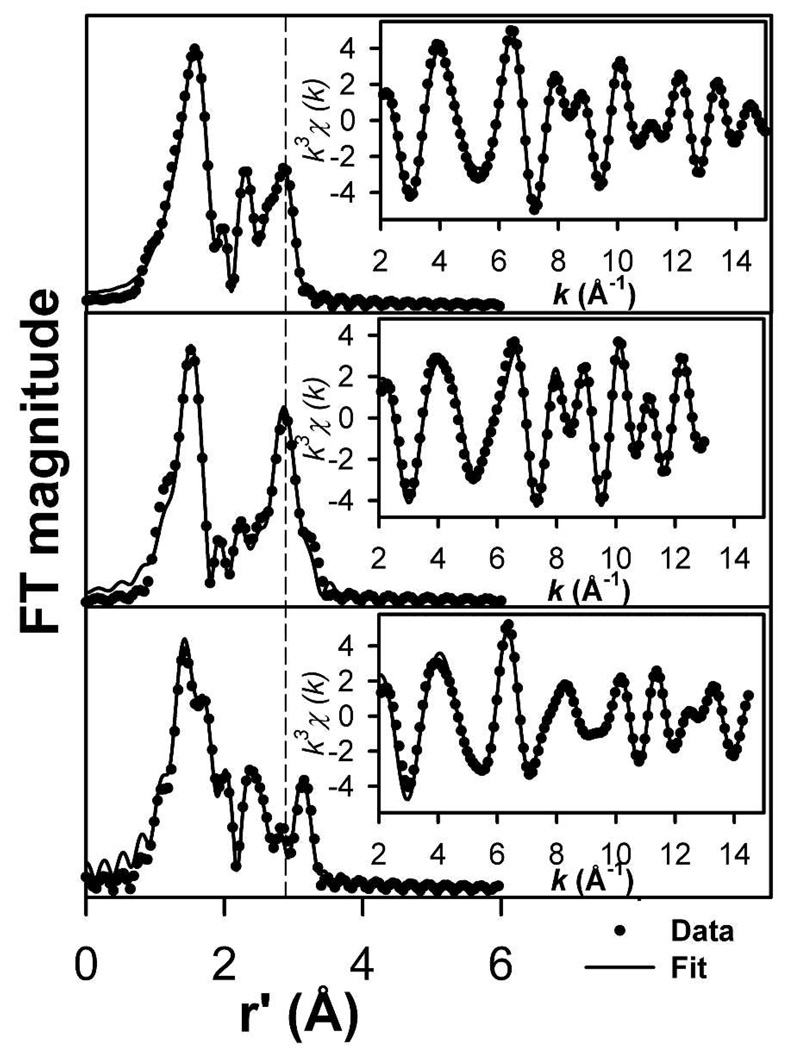
The Fourier-filtered k3-weighted EXAFS data of 2•O2AsMe2, 2•O2PPh2, and 3•O2PPh2 and their corresponding Fourier transforms are presented in Figure 10. Features of 2•O2PPh2 and 2•O2AsMe2 are similar in the range of 2 to 8 Å−1, where scattering from low Z atoms is dominant, but different from those of 3•O2PPh2. This suggests that the first two complexes have similar ligand geometries that differ from that of 3•O2PPh2. In the region beyond 8 Å−1, EXAFS data of 2•O2AsMe2 and 2•O2PPh2 share similar oscillation phases, but 2•O2AsMe2 exhibits a greater amplitude that most probably derives from a larger contribution from the higher Z arsenic scatterer. Consequently, the Fourier transforms of the 2•O2AsMe2 and 2•O2PPh2 data are very similar with inner shell peaks at r′ = 1.6 and r′ =2.0 Å and outer shell peaks at r′ = 2.3 and r′ = 2.8 Å, although the r′ = 2.8 Å peak of the 2•O2AsMe2 spectrum is, as expected, much more intense than the corresponding peak observed for 2•O2PPh2.
Figure 10.
Fourier transforms of the Fourier-filtered Fe K-edge EXAFS data k3χ(k) (inset) of 2•O2PPh2 (top), 2•O2AsMe2 (middle) and 3•O2PPh2 (bottom). Experimental data displayed with solid circles (•) and fits with solid lines (−). Back-transformation range ~ 0.7 to 3 Å (2•O2PPh2) and 0.7 – 3.5 Å (2•O2AsMe2 and 3•O2PPh2). Fourier transformed range, k = 2 to 15 Å−1 (2•O2PPh2), 2 to 13 Å−1 (2•O2AsMe2), and 2 to 14.8 Å−1 (3•O2PPh2). Fit parameters are provided in Tables 5 and S1 in bold italics.
In the region beyond 8 Å−1, data from 3•O2PPh2 have a different phase and a smaller amplitude than those from 2•O2AsMe2 and 2•O2PPh2. This difference suggests a dissimilar geometry about the iron atoms in 3•O2PPh2 as well as a smaller contribution from high Z atoms. The Fourier transform of the 3•O2PPh2 data shares the same general features as the other two complexes, but with a more complicated inner shell peak near r′ = 1.6 Å and an outer shell peak at r′ = 3.1 Å instead of a r′ = 2.8 Å peak.
Table 5 shows some of the progressive fits for the three complexes with the best fits for each species shown in bold italics (see Table S1 for all of the fits including all scatterers). The inner shell features of the three complexes can best be fitted with a total coordination number of six with 4 to 5 ligands near 2.0 to 2.2 Å and one ligand near 2.3 Å, corresponding to the Fe-Namine bond as observed in the crystal structures of 1•O2PPh2, 1•O2AsMe2 and [Fe2(N-EtHPTB)(O2)(OPPh3)2]3+.19 In 3•O2PPh2, a short Fe-O distance of 1.88 Å can be resolved from other Fe-O/N distances and is assigned to the peroxo ligand.19–21,26 Interestingly, introduction of a ligand at 2.5 Å to the fit of 2•O2PPh2 data improves the fit quality significantly (Fit C, 2•O2PPh2). This same addition does not improve fit qualities for 2•O2AsMe2 and 3•O2PPh2. The r′ = 2.3 Å peaks of the three complexes correspond to 3 to 5 Fe⋯C paths near 2.95 Å, which arise from carbon atoms adjacent to the ligating nitrogen atoms of the benzimidazole rings of the N-EtHPTB ligand.
Table 5.
Selected EXAFS fitting results for 2•O2PPh2, 2•O2AsMe2, and 3•O2PPh2.a
| Fe-O/N | Fe-O/N | Fe-O/N | Fe⋯C | Fe⋯X | ||||||||||||||
|---|---|---|---|---|---|---|---|---|---|---|---|---|---|---|---|---|---|---|
| Complex | Fit | N | R (Å) | σ2 | N | R (Å) | σ2 | N | R (Å) | σ2 | N | R (Å) | σ2 | N | R (Å) | σ2 | Fc | F'd |
| 2•O2PPh2 | A | 4 | 1.99 | 6.14 | 1 | 2.29 | 3.31 | 5 | 2.94 | 10.66 | 1P | 3.12 | −0.30 | 31 | 93 | |||
| B | 4 | 2.00 | 6.54 | 1 | 2.31 | 3.64 | 5 | 2.99 | 2.19 | 5C | 2.21 | 2.26 | 57 | 314 | ||||
| C | 4 | 2.00 | 6.69 | 1 | 2.31 | 2.71 | 1 | 2.54 | 0.58 | 5 | 2.99 | 3.55 | 1Fe | 3.28 | 3.18 | 20 | 48 | |
| D | 4 | 2.00 | 6.57 | 1 | 2.30 | 1.50 | 1 | 2.51 | 3.00b | 5 | 2.96 | 7.95 | 1Fe | 3.25 | 4.06 | 12 | 20 | |
| 1P | 3.14 | 3.00b | ||||||||||||||||
| 2•O2AsMe2 | A | 5 | 1.97 | 10.82 | 1 | 2.25 | 2.19 | 3 | 2.93 | 3.86 | 1Fe | 3.25 | 0.98 | 41 | 179 | |||
| B | 5 | 1.97 | 10.95 | 1 | 2.26 | 2.85 | 3 | 2.90 | 7.46 | 1As | 3.19 | 1.94 | 39 | 161 | ||||
| C | 5 | 1.97 | 10.66 | 1 | 2.25 | 1.03 | 3 | 2.95 | 1.63 | 6C | 3.28 | 0.40 | 72 | 628 | ||||
| D | 3 | 1.97 | 3.94 | 2 | 2.17 | 4.28 | 1 | 2.35 | 5.35 | 3 | 2.94 | 2.76 | 1Fe | 3.27 | 1.24 | 16 | 31 | |
| E | 3 | 1.97 | 3.87 | 2 | 2.17 | 3.82 | 1 | 2.36 | 3.80 | 3 | 2.93 | 5.20 | 1As | 3.21 | 2.24 | 15 | 31 | |
| F | 3 | 1.97 | 3.85 | 2 | 2.17 | 3.89 | 1 | 2.35 | 4.24 | 3 | 2.92 | 3.34 | 1Fe | 3.13 | 19.43 | 13 | 32 | |
| 1As | 3.21 | 1.97 | ||||||||||||||||
| G | 3 | 1.97 | 3.84 | 2 | 2.17 | 3.90 | 1 | 2.36 | 4.71 | 3 | 2.94 | 2.22 | 1Fe | 3.27 | 1.02 | 13 | 32 | |
| 1As | 3.45 | 12.71 | ||||||||||||||||
| 3•O2PPh2 | A | 4 | 2.04 | 2.04 | 1 | 2.33 | 0.48 | 1 | 1.88 | 1.23 | 4 | 2.95 | 2.39 | 1Fe | 3.47 | 4.59 | 17 | 25 |
| B | 4 | 2.04 | 2.04 | 1 | 2.33 | 0.52 | 1 | 1.88 | 1.28 | 4 | 2.95 | 2.30 | 1P | 3.61 | 1.50 | 26 | 58 | |
| C | 4 | 2.03 | 2.03 | 1 | 2.33 | 0.67 | 1 | 1.88 | 1.24 | 4 | 2.95 | 2.63 | 5C | 3.50 | 2.99 | 31 | 83 | |
| D | 4 | 2.04 | 2.04 | 1 | 2.33 | 0.80 | 1 | 1.88 | 1.12 | 4 | 2.95 | 2.43 | 1Fe | 3.44 | 3.73 | 14 | 20 | |
| 0.5P | 3.39 | 0.69 | ||||||||||||||||
Resolution ~ 0.12 Å for 2•O2PPh2 and 3•O2PPh2 and ~ 0.14 Å for 2•O2AsMe2; σ2 = Debye-Waller factor in units of 10−3 Å2.
σ2 value held fixed during optimization.
F = goodness of fit calculated as , where N = the number of data points. 39
F' = F2/ν, where ν = nidp − nvar, nidp is the number of independent points in each data set and nvar is the number of variables used in each optimization step. F' is used to indicate the improvement of fit upon the introduction of a shell. 39
The r′ = 2.8 Å feature of 2•O2PPh2 can be well simulated with an Fe⋯Fe distance near 3.25 Å. Attempts to simulate this distance with a single Fe⋯P path or five Fe⋯C paths respectively resulted in a negative σ2 value (Fit A, 2•O2PPh2) or a lower fit quality (Fit B, 2•O2PPh2), indicating that these paths are not responsible for the r′ = 2.8 Å peak. However, introducing an Fe⋯P path at 3.14 Å remarkably improved the fit quality (Fit D, 2•O2PPh2), indicating that a phosphorus atom is present at this distance from the iron atoms in 2•O2PPh2. Similarly, including an Fe⋯P path at 3.23 Å in addition to an Fe⋯Fe path at 3.30 Å remarkably improved the fits to the EXAFS data for [Fe2(O)(O2P(OPh)2)2(HB(pz)3)2].51 The 3.16 Å Fe⋯P distance found for 2•O2PPh2 is slightly shorter than the average 3.25 Å Fe⋯P distance seen in the crystal structure of 1•O2PPh2, an observation consistent with the different iron oxidation states of these two complexes.
The intense r' = 2.8 Å peak in 2•O2AsMe2 can be simulated equally well with either a 3.27 Å Fe⋯Fe path or a 3.21 Å Fe⋯As path with relatively small σ2 values (Fits D and E, 2•O2AsMe2). An attempt to replace the Fe⋯Fe/As paths with six Fe⋯C paths yielded poor results (compare Fit C to Fits A and B, 2•O2AsMe2). Including both the Fe⋯Fe and the Fe⋯As paths does not significantly improve the fit (Fits F and G, 2•O2AsMe2). However, we favor the presence of both the 3.27 Å Fe⋯Fe and 3.21 Å Fe⋯As paths given the following reasons: (i) 2•O2AsMe2 most likely contains one arsenic and two iron atoms; (ii) Fe⋯As distances of ~ 3.2 to 3.3 Å have been found in related (μ-alkoxo)(μ-1,3-dimethylarsinato)diiron(III) complexes by both X-ray crystallography and EXAFS;27,52,53 (iii) The phase shift and amplitude associated with iron and arsenic scatterers as simulated by FEFF are very similar in the k-range used for 2•O2AsMe2; therefore, only one path with a small σ2 value is sufficient to obtain a good simulation of the data (see Figures S9 and S10 in Supporting Information for a detailed description). The 3.21 Å Fe⋯As distance found for 2•O2AsMe2 is slightly shorter than the average 3.28 Å Fe⋯As distance found in crystal structure of 1•O2AsMe2. As is the case with the Fe⋯P distances in 1•O2PPh2 and 2•O2PPh2, this difference is consistent with differences in iron oxidation states. That the 3.21 Å Fe⋯As distance is slightly longer than the 3.16 Å Fe⋯P distance found for 2•O2PPh2 comes as no surprise, given that arsenic has a greater atomic radius than phosphorus (respectively, 1.15 and 1.00 Å).54
The 3.1 Å feature of 3•O2PPh2 is best fitted with an Fe⋯Fe path at 3.47 Å (Fit A, 3•O2PPh2). Replacing this Fe⋯Fe path by either one Fe⋯P path (Fit B, 3•O2PPh2) or five Fe⋯C paths (Fit C, 3•O2PPh2) results in significantly lower fit quality. Thus, the r' = 3.1 Å feature is attributed to an Fe⋯Fe path at 3.47 Å. This distance is longer than the Fe⋯Fe distances found in 2•O2PPh2 and 2•O2AsMe2, consistent with the observed difference in phase shift and the lower amplitude in the k-range of 8 to 13 Å−1 for 3•O2PPh2 compared to the other two complexes. Adding half an Fe⋯P path to Fit A (3•O2PPh2) only increased fit quality by ~ 20% (Fit D, 3•O2PPh2). Therefore, our EXAFS analysis cannot unambiguously establish the presence of a phosphorus atom at this distance from the iron atom.
All the peroxo intermediates we have characterized above decay upon warming to room temperature to yellow products 4•O2X, which were only characterized by UV-Vis spectroscopy. For these complexes, we suggest a generic formulation of [Fe4(N-EtHPTB)2(O2X)2(μ-O)2]4+, by analogy to two tetranuclear iron(III) complexes whose crystal structures were reported in 1988.55 These structures show two [FeIII 2(HPTB)(O2CPh)]4+ units connected by two oxo groups that bridge between one iron(III) of one unit and the corresponding iron in the other unit. This tetranuclear form was also proposed by Feig et al. as the end products in their mechanistic studies of the reactions of O2 with 1•O2CPh and two sister complexes.56 In the absence of crystal structures, we cannot be sure that 4•O2PPh2 and 4•O2AsMe2 exist as tetra-iron species and leave open the possibility that either complex may in fact remain dinuclear. We also note that the reported tetranuclear structures may form as a result of crystallization conditions and may not reflect the nature of 4•O2X in solution.
DISCUSSION
A common step in dioxygen activation by biological diiron(II) systems is the formation of (μ-η1:η1-peroxo)diiron(III) moieties,9–16 which are often stable enough to be trapped and characterized. Synthetic (μ-η1:η1-peroxo)diiron(III) complexes also exhibit enough stability to allow characterization,17,24,26–28 and some in fact have been crystallized.18–21 For the purpose of examining the factors affecting the stability of this moiety, we synthesized diiron(II) complexes using the dinucleating ligand N-EtHPTB and diphenylphosphinate or dimethylarsinate in lieu of more frequently employed carboxylate bridges. Solutions of these complexes reacted with dioxygen, forming (μ-η1:η1-peroxo)diiron(III) moieties, which were examined spectroscopically.
Upon oxygenation, 1•O2AsMe2 forms 2•O2AsMe2, a meta-stable green-blue intermediate, before decaying to the yellow iron(III) end product. 1•O2PPh2 also forms a green-blue intermediate (2•O2PPh2), but this species converts to a second intermediate (3•O2PPh2), a deep blue species, before decaying to the yellow end product. This second intermediate is reminiscent of 3•O2CPh, the (μ-η1:η1-peroxo)diiron(III) intermediate observed upon oxygenation of 1•O2CPh.29 These results bring up three questions: (i) What is the nature of 2•O2X and 3•O2X? (ii) How does 2•O2X convert to 3•O2X? (iii) Why are 2•O2CPh and 3•O2AsMe2 not observed?
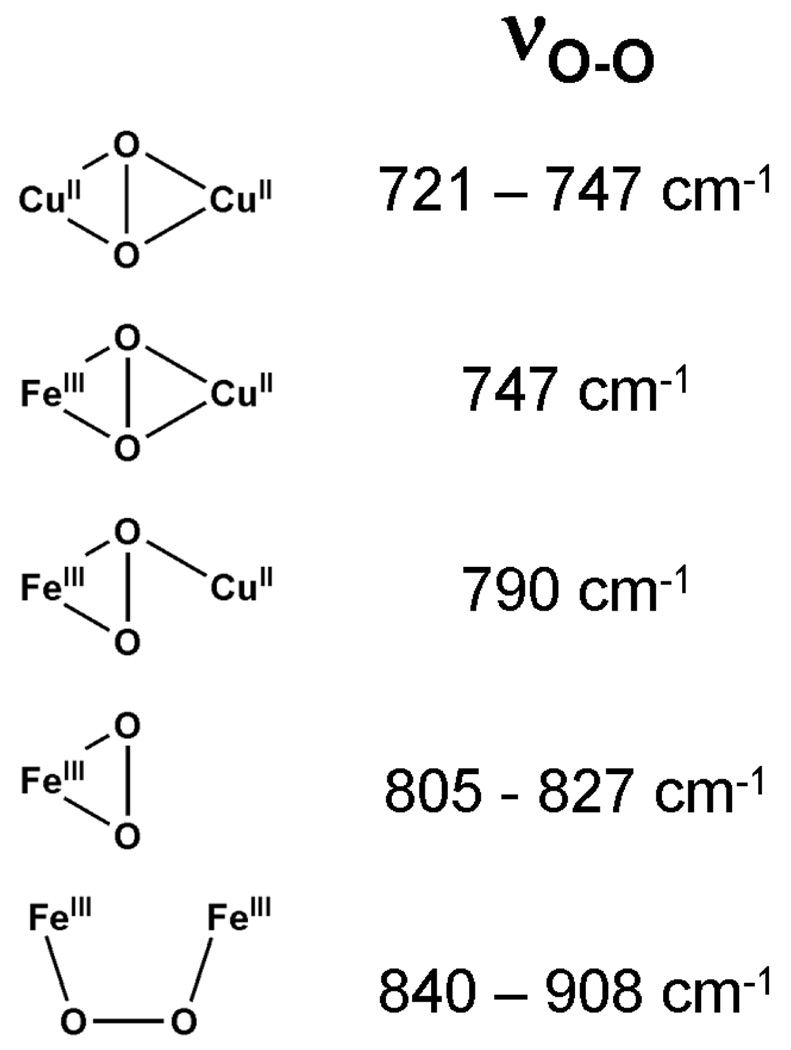
We first address the identities of 2•O2PPh2, 3•O2PPh2 and 2•O2AsMe2, determination of which rests on evidence gathered from a variety of spectroscopic techniques. Because each of these intermediates has a strong chromophore arising from a peroxo LMCT band, resonance Raman (rR) spectroscopy is a good place to start, as it serves as an excellent probe of O-O vibrations. The rR spectra of these species exhibit features at ~850–900 cm−1 that are assigned to νO-O on the basis of isotopic substitution studies. Upon 18O substitution, the frequency downshifts observed for peaks around 850 cm−1 in the rR spectra of both 2•O2PPh2 and 2•O2AsMe2 unequivocally indicate the presence of a ligated peroxide moiety. The rR spectrum produced by using an isotopic mixture of O2 reveals that the peroxide in 2•O2PPh2 is symmetrically ligated. Because its Mössbauer spectrum shows equivalent iron(III) atoms, the peroxide must be ligated to the diiron(III) center in either a μ-η1:η1 or a μ-η2:η2 configuration. No (μ-η2:η2-peroxo)diiron(III) complex has been reported to date, but there are examples of dicopper and heme-copper species containing (μ-η2:η2-peroxo)di-metal cores. Figure 11 shows a trend wherein the O-O stretch increases in frequency as the peroxide moiety moves from μ-η2:η2 to μ-η1:η2 to η2 to μ-η1:η1 (Figure 11).21,26,40,42–46 Comparing those frequencies to values observed for 2•O2PPh2, 2•O2AsMe2 and 3•O2PPh2 leads us to conclude that the peroxide is ligated in a μ-η1:η1 mode in all three complexes, as found in the crystal structure of [Fe2(N-EtHPTB)(O2)(OPPh3)2]3+.19 However, the ~50 cm−1 disparity observed between the νO-O values of 2•O2X and 3•O2X raises the interesting question of why they are different.
Figure 11.
Peroxo O-O stretching ranges reported for various dicopper, copper-iron, monoiron and diiron complexes.
One possible explanation for the difference is a change in the Fe⋯Fe distance. Brunold et al. proposed a model for understanding (μ-η1:η1-peroxo)diiron(III) units wherein the stretching frequency of the peroxide bond increases due to increased mechanical coupling to the Fe-O stretch as the Fe-O-O angle opens from 90 degrees.57 Based on this model, it stands to reason that, as the iron centers move apart, the Fe-O-O angle should increase, thus producing a higher frequency νO-O.58 This relationship between νO-O values and Fe⋯Fe distances is supported by a recent publication showing that an increase in the Fe⋯Fe distance can be directly correlated to the increase in the stretching frequency of the peroxide bond in a series of Fe2(μ-η1:η1-O2)(μ-OR) complexes.26 Applying this correlation to the values of νO-O observed for 2•O2PPh2, 2•O2AsMe2 and 3•O2PPh2 generates respective Fe⋯Fe distances of 3.16, 3.13 and 3.40 Å, values in reasonable agreement with distances of 3.25, 3.27 and 3.47 Å determined from EXAFS analysis.
Based on this information, as well as Mössbauer evidence for equivalent iron atoms in 2•O2PPh2 and the bidentate phosphinate bridge observed in the crystal structure of 1•O2PPh2, we postulate that the diiron(III) center in 2•O2PPh2 is bridged by three groups: the alkoxo oxygen of N-EtHPTB, the 1,2-peroxo moiety and the phosphinate ligand. The structure of 1•O2PPh2 has one open coordination site on each iron atom, both of which are properly positioned to allow dioxygen to coordinate easily in the 1,2-peroxo bridging mode found in 2•O2PPh2 (Scheme 1). The parallels observed in the UV-Vis, rR, Mössbauer and EXAFS spectra of 2•O2PPh2 and 2•O2AsMe2 indicate that the latter complex is also triply bridged, with the role of the arsinate moiety analogous to that of the phosphinate moiety in 2•O2PPh2.
Scheme 1.
Conversion of 2•O2X to 3•O2X.
2•O2PPh2 is observed to convert to 3•O2PPh2 at temperatures above −40 °C. In this conversion, the phosphinate moiety is proposed to shift to a terminal position on one iron, resulting in the larger inter-iron distance revealed by EXAFS analysis and the increased νO-O seen in the rR spectrum of 3•O2PPh2. On the basis of similar rR data and similar electronic transitions in the visible range, we propose that 3•O2PPh2 and 3•O2CPh share the same basic dibridged structure (Scheme 1). A Hammett study of [Fe2(N-EtHPTB)(O2)(O2X)]2+ (O2X = substituted benzoate) showed a correlation between σ-values of the benzoate substituent and the lifetimes of the peroxo intermediates, with electron withdrawing substituents increasing t½.19 This effect indicates that the benzoate remains coordinated to the diiron(III) unit in a MeCN solution of 3•O2CPh at −10 °C. Since this 1996 report, we have noted the similarity of the resonance Raman data from 3•O2CPh with those collected after adding OPPh3,26,40 and deduce that the benzoate moiety in 3•O2CPh must occupy a terminal position. While this conclusion is at odds with the bridging configuration proposed by the authors who originally characterized this peroxo complex,29,40 they had the benefits of neither Brunold and Solomon’s mechanical coupling model57 nor a comparison of the νO-O values of 3•O2CPh and its OPPh3 adduct.26 The unchanged νO-O value recorded after OPPh3 ligation indicates that the Fe⋯Fe distance is comparable in the two complexes. The inter-iron distance of 3.47 Å measured in 3•O2PPh2 closely matches the inter-iron distance of 3.462 Å reported19 in the crystal structure of [Fe2(N-EtHPTB)(O2)(OPPh3)2]3+, suggesting that in 3•O2PPh2, the phosphinate becomes a terminal ligand on one iron, thereby opening up a coordination site on the other (Scheme 1). In acetonitrile this site is most likely occupied by solvent, making both iron centers 6-coordinate and indistinguishable by Mössbauer spectroscopy. However, in CH2Cl2, the available coordination site cannot be filled by the non-coordinating solvent or the BPh4 counterion. This produces a complex in which one iron atom is six-coordinate and the other is five-coordinate, a condition reflected by the presence of two quadrupole doublets in the Mössbauer spectrum (Figure 6 and Table 3).
During conversion from 2•O2PPh2 to 3•O2PPh2 at −30 °C, the peroxo-to-iron(III) charge transfer band blue-shifts 96 nm in MeCN and 57 nm in CH2Cl2 (Table 3). It is not clear why such large blue-shifts occur. An obvious difference between the proposed structures of 2•O2X and 3•O2X (Scheme 1) is the binding site of the peroxide. In 2•O2X, it is cis to the N-EtHPTB amine nitrogen atoms, while in 3•O2X it is trans to those atoms. There is also a difference in the Fe-O-O angles due to different Fe⋯Fe distances in each intermediate. Because the degree of peroxide and iron orbital mixing affects the energy required for a LMCT, any changes in the iron coordination sphere, especially changes involving the peroxide, can produce changes in the visible absorbance spectrum. The smaller shift observed in CH2Cl2 may be partially accounted for by incomplete conversion to 3•O2PPh2, but we must also consider the presence of one five-coordinate iron center as another factor that can affect the Δmax (Scheme 1, 3•O2X).
The mechanism proposed in Scheme 1 would require the N3 ligand set on either end of the 2-hydroxypropane ligand backbone to rearrange from a facial to a meridional configuration during conversion from 2•O2PPh2 to 3•O2PPh2. Our hypothetical structure of 2•O2PPh2 is based on the crystal structure of 1•O2PPh2 (Figure 1), which clearly shows an open coordination site on each iron atom cis to its respective amine nitrogen. Dioxygen binding to these sites would be expected to be facile, and the resulting peroxo complex would have a geometry similar to that of the simplified cartoon representing 2•O2X shown in Scheme 1, with the N3 ligand sets configured facially. The proposed structure of 3•O2PPh2 is based on the crystal structure of [Fe2(N-EtHPTB)(O2)(OPPh3)2]3+, in which both N3 ligand sets of the dinucleating N-EtHPTB ligand adopt meridional configurations and both OPPh3 ligands coordinate trans to the alkoxo bridge.19 In addition to N-ligand rearrangement, conversion of 2•O2X to 3•O2X also requires the bridging oxyanion in the initial species to move to a terminal position in the second species. Shifting O2X to a monodentate coordination mode forms the unobserved species shown in the center of Scheme 1, which can revert to 2•O2X or irreversibly rearrange to form 3•O2X.
In both MeCN and CH2Cl2 at −30 °C, we observe significant conversion of 2•O2PPh2 to 3•O2PPh2, indicating that the latter is thermodynamically favored at this temperature. In contrast, no buildup of 3•O2AsMe2 is observed at any temperature, so 2•O2AsMe2 must be the more favored form. In the case of O2X = benzoate however, the equilibrium shifts in the opposite direction and only 3•O2CPh has been reported, and 2•O2CPh has not been observed despite the fact that the reaction of 1•O2CPh with O2 has been investigated in various solvents and solvent combinations at low temperatures,29,40 including one study by stopped-flow methods in propionitrile at −75 °C.59
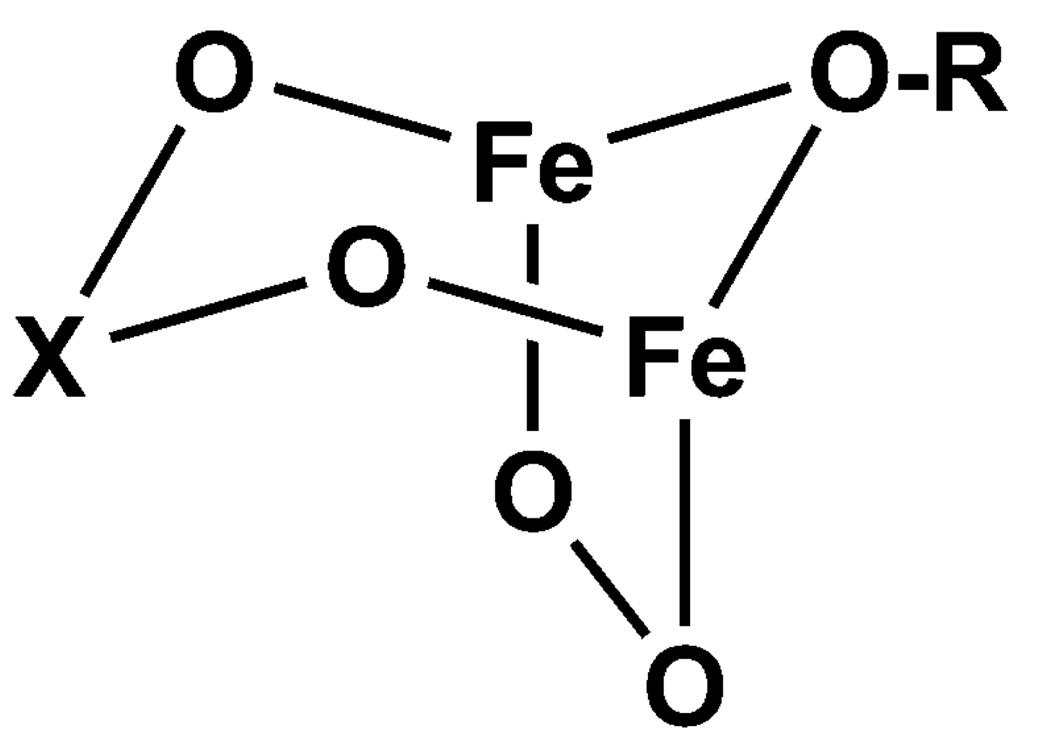
The distinct preferences of the different O2X moieties for 2•O2X versus 3•O2X suggest that the nature of the O2X bridge in 2•O2X affects the equilibrium associated with the conversion of 2•O2X to 3•O2X. Clearly, arsinate favors 2 and benzoate favors 3, while phosphinate is intermediate between the two. A comparison of the pKa values of the corresponding conjugate acids (HO2AsMe2, 6.27;60,61 HO2PPh2, 2.32;62 HO2CPh, 4.1963) does not reveal a trend that matches our observations. However, an examination of the respective bite distances of the bridging oxyanions in each of the diiron(II) precursors shows that the lifetime of 2•O2X increases with a larger O⋯O distance (namely 2.23 Å for O2CPh, 2.56 Å for O2PPh2, and 2.80 Å for O2AsMe2, as deduced from the structures of the three 1•O2X complexes). We speculate that the bigger O⋯O bite distance imposes less strain on the bicyclic moiety (Figure 12) and results in the more stable, triply-bridged core of 2•O2AsMe2. On the other hand, the smaller bite distance of the benzoate bridge makes it difficult to span an Fe⋯Fe distance of ca. 3.2 Å expected for 2•O2CPh and leads to facile conversion of the benzoate bridge to a terminal ligand and formation of 3•O2CPh.
Figure 12.
Generic representation of the bicyclic diiron core proposed for 2•O2X.
This movement of an O2X ligand from a bridging to a terminal position corresponds to a phenomenon of some importance in diiron enzymes, referred to as a carboxylate shift.64 For soluble methane monooxygenase, toluene monooxygenase, and ribonucleotide reductase, one of the conserved glutamate residues (E234, E320, and E328, respectively) of the common diiron active site alternates between terminal and μ-1,1 or μ-1,3 coordination modes in the diiron(III) and diiron(II) forms.65–69 These carboxylate shifts alter the inter-iron distance in each active site and may affect the ability of each diiron site to activate O2. When O2 is activated, the iron-iron distance can change by as much as 1.5 Å from the diiron(II) starting point to the diiron(IV) state associated with methane oxidizing intermediate Q,3 so the number and the nature of bridging ligands are of vital importance for controlling oxygen activation. While this current work does not directly address the question of how to facilitate O-O bond cleavage at a diiron center, it does shed light on the ability of O2X ligands to tune inter-iron distances by changing coordination modes. We have demonstrated that moving an O2X ligand from a μ-1,3 to a terminal coordination mode changes the inter-iron distance of an alkoxide-bridged (μ-η1:η1-peroxo)diiron(III) complex by ~0.2 Å. This means relatively minor ligand rearrangements can produce substantial changes in inter-iron distances, which in turn, affect the stability of the O-O bond.
In summary, we have synthesized two new diiron(II) complexes and investigated their reaction with oxygen, producing (μ-η1:η1-peroxo)diiron(III) species. By varying the central atom of a three-atom chain bridging the iron atoms, we were able to produce and stabilize a peroxo moiety previously unobserved when using N-EtHPTB as a ligand (Scheme 1). Under the right conditions, the diphenylphosphinate-bridged form of this peroxo moiety converts to a second peroxo-containing species, akin to other peroxo complexes previously formed using this ligand. Although (μ-η1:η1-peroxo)diiron(III) complexes of N-EtHPTB and other ligands have been studied for years, this conversion of one peroxo species to another is reported here for the first time; we suspect that it takes place upon oxygenation of all previously reported, three-atom bridged, diiron(II) N-EtHPTB complexes, albeit often so rapidly that it has never been observed. Further experiments are underway to confirm this hypothesis.
Supplementary Material
Acknowledgements
This work was supported by the National Institutes of Health through Grants GM-38767 (L.Q.) and EB-001475 (E.M.). We thank Dr. Victor Young, Jr., Benjamin Kucera and Dr. William Brennessel of the X-Ray Crystallographic Laboratory at the University of Minnesota for their invaluable assistance.
Footnotes
Supporting Information Available:
Crystallographic data for 1•O2PPh2 and 1•O2AsMe2. UV-Vis, resonance Raman and Mössbauer spectra. Complete EXAFS fitting results, including FEFF models. This material is available free of charge via the internet at http://pubs.acs.org.
References
- 1.Wallar BJ, Lipscomb JD. Chem. Rev. 1996;96:2625–2658. doi: 10.1021/cr9500489. [DOI] [PubMed] [Google Scholar]
- 2.Que L., Jr. In: Bioinorganic Catalysis. 2nd ed. Reedijk J, Bouwman E, editors. New York: Marcel Dekker; 1999. pp. 269–321. [Google Scholar]
- 3.Solomon EI, Brunold TC, Davis MI, Kemsley JN, Lee S-K, Lehnert N, Neese F, Skulan AJ, Yang Y-S, Zhou J. Chem. Rev. 2000;100:235–349. doi: 10.1021/cr9900275. [DOI] [PubMed] [Google Scholar]
- 4.Merkx M, Kopp DA, Sazinsky MH, Blazyk JL, Müller J, Lippard SJ. Angew. Chem. Int. Ed. 2001;40:2782–2807. doi: 10.1002/1521-3773(20010803)40:15<2782::AID-ANIE2782>3.0.CO;2-P. [DOI] [PubMed] [Google Scholar]
- 5.Fox BG, Lyle KS, Rogge CE. Acc. Chem. Res. 2004;37:421–429. doi: 10.1021/ar030186h. [DOI] [PubMed] [Google Scholar]
- 6.Bollinger JM, Jr., Diao Y, Matthews ML, Xing G, Krebs C. Dalton Trans. 2009:905–914. doi: 10.1039/b811885j. [DOI] [PMC free article] [PubMed] [Google Scholar]
- 7.Sazinsky MH, Lippard SJ. Acc. Chem. Res. 2006;39:558–566. doi: 10.1021/ar030204v. [DOI] [PubMed] [Google Scholar]
- 8.Murray LJ, Lippard SJ. Acc. Chem. Res. 2007;40:466–474. doi: 10.1021/ar600040e. [DOI] [PubMed] [Google Scholar]
- 9.Liu KE, Valentine AM, Qiu D, Edmondson DE, Appelman EH, Spiro TG, Lippard SJ. J. Am. Chem. Soc. 1995;117:4997–4998. [Google Scholar]
- 10.Bollinger JM, Jr., Krebs C, Vicol A, Chen S, Ley BA, Edmondson DE, Huynh BH. J. Am. Chem. Soc. 1998;120:1094–1095. [Google Scholar]
- 11.Broadwater JA, Ai J, Loehr TM, Sanders-Loehr J, Fox BG. Biochemistry. 1998;37:14664–14671. doi: 10.1021/bi981839i. [DOI] [PubMed] [Google Scholar]
- 12.Broadwater JA, Achim C, Münck E, Fox BG. Biochemistry. 1999:12197–12204. doi: 10.1021/bi9914199. [DOI] [PubMed] [Google Scholar]
- 13.Lee S-K, Lipscomb JD. Biochemistry. 1999;38:4423–4432. doi: 10.1021/bi982712w. [DOI] [PubMed] [Google Scholar]
- 14.Saleh L, Krebs C, Ley BA, Naik S, Huynh BH, Bollinger JM. Biochemistry. 2004;43:5953–5964. doi: 10.1021/bi036099e. [DOI] [PubMed] [Google Scholar]
- 15.Murray LJ, Garcia-Serres R, Naik S, Huynh BH, Lippard SJ. J. Am. Chem. Soc. 2006;128:7458–7459. doi: 10.1021/ja062762l. [DOI] [PMC free article] [PubMed] [Google Scholar]
- 16.Yun D, Garcia-Serres R, Chicalese BM, An YH, Huynh BH, Bollinger JM., Jr. Biochemistry. 2007;46:1925–1932. doi: 10.1021/bi061717n. [DOI] [PubMed] [Google Scholar]
- 17.Tshuva EY, Lippard SJ. Chem. Rev. 2004;104:987–1012. doi: 10.1021/cr020622y. [DOI] [PubMed] [Google Scholar]
- 18.Ookubo T, Sugimoto H, Nagayama T, Masuda H, Sato T, Tanaka K, Maeda Y, Okawa H, Hayashi Y, Uehara A, Suzuki M. J. Am. Chem. Soc. 1996;118:701–702. [Google Scholar]
- 19.Dong Y, Yan S, Young VG, Jr., Que L., Jr. Angew. Chem. Int. Ed. Engl. 1996;35:618–620. [Google Scholar]
- 20.Kim K, Lippard SJ. J. Am. Chem. Soc. 1996;118:4914–4915. [Google Scholar]
- 21.Zhang X, Furutachi H, Fujinami S, Nagatomo S, Maeda Y, Watanabe Y, Kitagawa T, Suzuki M. J. Am. Chem. Soc. 2005;127:826–827. doi: 10.1021/ja045594a. [DOI] [PubMed] [Google Scholar]
- 22.Kryatov SV, Chavez FA, Reynolds AM, Rybak-Akimova EV, Que L, Jr., Tolman WB. Inorg. Chem. 2004;43:2141–2150. doi: 10.1021/ic049976t. [DOI] [PubMed] [Google Scholar]
- 23.Korendovych IV, Kryatov SV, Reiff WM, Rybak-Akimova EV. Inorg. Chem. 2005;44:8656–8658. doi: 10.1021/ic051739i. [DOI] [PubMed] [Google Scholar]
- 24.Kryatov SV, Taktak S, Korendovych IV, Rybak-Akimova EV, Kaizer J, Torelli S, Shan X, Mandal S, MacMurdo V, Mairata i Payeras A, Que L., Jr. Inorg. Chem. 2005;44:85–99. doi: 10.1021/ic0485312. [DOI] [PubMed] [Google Scholar]
- 25.Yoon S, Lippard SJ. Inorg. Chem. 2006;45:5438–5446. doi: 10.1021/ic060307k. [DOI] [PMC free article] [PubMed] [Google Scholar]
- 26.Fiedler AT, Shan X, Mehn MP, Kaizer J, Torelli S, Frisch JR, Kodera M, Que L., Jr. J. Phys. Chem. A. 2008;112:13037–13044. doi: 10.1021/jp8038225. [DOI] [PMC free article] [PubMed] [Google Scholar]
- 27.Than R, Schrodt A, Westerheide L, Eldik Rv, Krebs B. Eur. J. Inorg. Chem. 1999:1537–1543. [Google Scholar]
- 28.Yan S, Cheng P, Wang Q, Liao D, Jiang Z, Wang G. Science in China, Series B: Chemistry. 2000;43:405–411. [Google Scholar]
- 29.Ménage S, Brennan BA, Juarez-Garcia C, Münck E, Que L., Jr. J. Am. Chem. Soc. 1990;112:6423–6425. [Google Scholar]
- 30.McKee V, Zvagulis M, Dagdigian JV, Patch MG, Reed CA. J. Am. Chem. Soc. 1984;106:4765–4772. [Google Scholar]
- 31.Armarego WLF, Perrin DD. Purification of Laboratory Chemicals. Oxford: Butterworth-Heinemann; 1997. [Google Scholar]
- 32.Hagen KS. Inorg. Chem. 2000;39:5867–5869. doi: 10.1021/ic000444w. [DOI] [PubMed] [Google Scholar]
- 33.Bruker . SMART V5.054. Madison, WI: Bruker Analytical X-Ray Systems; 2001. [Google Scholar]
- 34.Blessing RH. Acta Cryst. 1995;A51:33–38. doi: 10.1107/s0108767394005726. [DOI] [PubMed] [Google Scholar]
- 35.Bruker . SAINT+ V6.45. Madison, WI: Bruker Analytical X-Ray Systems; 2003. [Google Scholar]
- 36.Bruker . SHELXTL V6.14. Madison, WI,: Bruker Analytical X-Ray Systems; 2000. [Google Scholar]
- 37.Scarrow RC, Trimitsis MG, Buck CP, Grove GN, Cowling RA, Nelson MJ. Biochemistry. 1994;33:15023–15035. doi: 10.1021/bi00254a011. [DOI] [PubMed] [Google Scholar]
- 38.George GN, Pickering IJ. Stanford Synchrotron Radiation Laboratory. Stanford California: Stanford Linear Accelerator Center; 2000. [Google Scholar]
- 39.Riggs-Gelasco PJ, Stemmler TL, Penner-Hahn JE. Coord. Chem. Rev. 1995;144:245–286. [Google Scholar]
- 40.Dong Y, Ménage S, Brennan BA, Elgren TE, Jang HG, Pearce LL, Que L., Jr. J. Am. Chem. Soc. 1993;115:1851–1859. [Google Scholar]
- 41.Addison AW, Rao TN, Reedijk J, Rijn Jv, Verschoor GC. J. Chem. Soc., Dalton Trans. 1984:1349–1356. [Google Scholar]
- 42.Mirica LM, Vance M, Rudd DJ, Hedman B, Hodgson KO, Solomon EI, Stack TDP. J. Am. Chem. Soc. 2002;124:9332–9333. doi: 10.1021/ja026905p. [DOI] [PubMed] [Google Scholar]
- 43.Kim E, Shearer J, Lu S, Moënne-Loccoz P, Helton ME, Kaderli S, Zuberbühler AD, Karlin KD. J. Am. Chem. Soc. 2004;126:12716–12717. doi: 10.1021/ja045941g. [DOI] [PubMed] [Google Scholar]
- 44.Chishiro T, Shimazaki Y, Tani F, Tachi Y, Naruta Y, Karasawa S, Hayami S, Maeda Y. Angew. Chem., Int. Ed. 2003;42:2788–2791. doi: 10.1002/anie.200351415. [DOI] [PubMed] [Google Scholar]
- 45.Costas M, Mehn MP, Jensen MP, Que L., Jr. Chem. Rev. 2004;104:939–986. doi: 10.1021/cr020628n. [DOI] [PubMed] [Google Scholar]
- 46.Yamashita M, Furutachi H, Tosha T, Fujinami S, Saito W, Maeda Y, Takahashi K, Tanaka K, Kitagawa T, Suzuki M. J. Am. Chem. Soc. 2007;129:2–3. doi: 10.1021/ja063987z. [DOI] [PubMed] [Google Scholar]
- 47.Kauffmann KE, Münck E. In: Spectroscopic Methods in Bioinorganic Chemistry. Solomon EI, Hodgson KO, editors. Washington, D.C: American Chemical Society; 1998. [Google Scholar]
- 48.Krebs C, Bollinger JM, Jr., Theil EC, Huynh BH. J. Biol. Inorg. Chem. 2002;7:863–869. doi: 10.1007/s00775-002-0371-1. [DOI] [PubMed] [Google Scholar]
- 49.Westre TE, Kennepohl P, DeWitt JG, Hedman B, Hodgson KO, Solomon EI. J. Am. Chem. Soc. 1997;119:6297–6314. [Google Scholar]
- 50.Roe AL, Schneider DJ, Mayer RJ, Pyrz JW, Widom J, Que L., Jr. J. Am. Chem. Soc. 1984;106:1676–1681. [Google Scholar]
- 51.Hedman B, Co MS, Armstrong WH, Hodgson KO, Lippard SJ. Inorg. Chem. 1986;25:3708–3711. [Google Scholar]
- 52.Eulering B, Ahlers F, Zippel F, Schmidt M, Nolting H-F, Krebs B. J. Chem. Soc., Chem. Commun. 1995:1305–1307. [Google Scholar]
- 53.Eulering B, Schmidt M, Pinkernell U, Karst U, Krebs B. Angew. Chem. Int. Ed. Engl. 1996;35:1973–1974. [Google Scholar]
- 54.Slater JC. J. Chem. Phys. 1964;41:3199–3204. [Google Scholar]
- 55.Chen Q, Lynch JB, Gomez-Romero P, Ben-Hussein A, Jameson GB, O'Connor CJ, Que L., Jr. Inorg. Chem. 1988;27:2673–2681. [Google Scholar]
- 56.Feig AL, Becker M, Schindler S, van Eldik R, Lippard SJ. Inorg. Chem. 1996;35:2590–2601. doi: 10.1021/ic951242g. [DOI] [PubMed] [Google Scholar]
- 57.Brunold TC, Tamura N, Kitajima M, Moro-oka Y, Solomon EI. J. Am. Chem. Soc. 1998;120:5674–5690. [Google Scholar]
- 58.The Brunold and Solomon model also predicts that, as νO-O increases, μFe-O will decrease. This predicted trend is consistent with our observations, but we found a decrease of only ~7 cm−1 between 2•O2PPh2 and 3 •2PPh2, which is much smaller than the ~110 cm−1 change predicted by the model for an increase in μO-O from ~850 to ~900 cm−1. The disparity may be due to differences in the Fe-O-O-Fe dihedral angle between our intermediates (0° observed in the [Fe2(N-EtHPTB)(O2)(OPPh3)2]3+ crystal structure19) and the complex used in their calculations (52.9°).20 Further theoretical work extending the mechanical coupling model to other diiron-O2 adducts would be desirable.
- 59.Feig AL, Lippard SJ. J. Am. Chem. Soc. 1994;116:8410–8411. [Google Scholar]
- 60.Kilpatrick ML. J. Am. Chem. Soc. 1949;71:2607–2610. [Google Scholar]
- 61.Shin T-W, Kim K, Lee I-J. J. Sol. Chem. 1997;26:379–390. [Google Scholar]
- 62.Edmundson RS. Dictionary of Organophosphorus Compounds. New York: Chapman and Hall; 1988. [Google Scholar]
- 63.Lide DR. CRC Handbook of Chemistry and Physics. 72nd ed. Boston: CRC Press; 1991. [Google Scholar]
- 64.Rardin RL, Tolman WB, Lippard SJ. New J. Chem. 1991;15:417–430. [Google Scholar]
- 65.Rosenzweig AC, Frederick CA, Lippard SJ, Nordlund P. Nature. 1993;366:537–543. doi: 10.1038/366537a0. [DOI] [PubMed] [Google Scholar]
- 66.Whittington DA, Lippard SJ. J. Am. Chem. Soc. 2001;123:827–838. doi: 10.1021/ja003240n. [DOI] [PubMed] [Google Scholar]
- 67.Sazinsky MH, Bard J, Donato AD, Lippard SJ. J. Biol. Chem. 2004;279:30600–30610. doi: 10.1074/jbc.M400710200. [DOI] [PubMed] [Google Scholar]
- 68.Nordlund P, Sjöberg B-M, Eklund H. Nature. 1990;345:593–598. doi: 10.1038/345593a0. [DOI] [PubMed] [Google Scholar]
- 69.Nordlund P, Eklund H. J. Mol. Biol. 1993;232:123–164. doi: 10.1006/jmbi.1993.1374. [DOI] [PubMed] [Google Scholar]
Associated Data
This section collects any data citations, data availability statements, or supplementary materials included in this article.


