

This study underscores the emerging role of NHE6 as a novel regulatory protein in the apical surface development of human hepatoma HepG2 cells. A limited range of endosomal pH facilitated by NHE6.1 is suggested to be important for securing the polarized distribution of membrane lipids and proteins and maintenance of apical bile canaliculi.
Abstract
Polarized epithelial cells develop and maintain distinct apical and basolateral surface domains despite a continuous flux of membranes between these domains. The Na+/H+exchanger NHE6 localizes to endosomes but its function is unknown. Here, we demonstrate that polarized hepatoma HepG2 cells express an NHE6.1 variant that localizes to recycling endosomes and colocalizes with transcytosing bulk membrane lipids. NHE6.1 knockdown or overexpression decreases or increases recycling endosome pH, respectively, and inhibits the maintenance of apical, bile canalicular plasma membranes and, concomitantly, apical lumens. NHE6.1 knockdown or overexpression has little effect on the de novo biogenesis of apical surface domains. NHE6.1 knockdown does not inhibit basolateral-to-apical transcytosis of bulk membrane lipids, but it does promote their progressive loss from the apical surface, leaving cells unable to efficiently retain bulk membrane and bile canalicular proteins at the apical surface. The data suggest that a limited range of endosome pH mediated by NHE6.1 is important for securing the polarized distribution of membrane lipids at the apical surface and maintenance of apical bile canaliculi in HepG2 cells and hence cell polarity. This study underscores the emerging role of the endosomal recycling system in apical surface development and identifies NHE6 as a novel regulatory protein in this process.
INTRODUCTION
Epithelial cells develop distinct apical and basolateral cell surface domains. Hepatocytes, the main epithelial cells of the liver, develop apical plasma membrane domains at the lateral surface between adjacent cells followed by the appearance of intercellular cavities or lumens. These domains, via an as yet unknown process, subsequently develop into a branching canalicular network into which biliary components and detoxified waste products are secreted. The sorting and targeting of specific proteins to the apical plasma membrane domains provide and secure the specialized functions required at the bile canaliculi. Similarly as observed in other epithelial cells (van Meer and Simons, 1986; Nichols et al., 1988), also membrane lipids can be sorted and targeted to the apical bile canalicular plasma membrane, where they may help protect the bile canalicular surface domain against the detergent-like actions of bile components (van IJzendoorn and Hoekstra, 1998; Oude Elferink and Paulusma, 2007).
After their formation, apical cell surface domains are maintained despite the continuous bidirectional flow of membranes between the apical and basolateral surface domains. Much of this flow of membranes occurs via vesicular transport and involves the endosomal system. Polarized hepatocytes, perhaps more than epithelial cells in other tissues, rely heavily on the transcellular transport (transcytosis) of proteins and sphingolipids for the development of their apical (i.e., bile canalicular) cell surface domains (Barr and Hubbard, 1993; Zaal et al., 1994; Zegers and Hoekstra, 1998). Consequently, considerable sorting and polarized targeting of plasma membrane components must take place in the endosomal system of the hepatocyte.
The molecular machineries that control the polarized trafficking of plasma membrane proteins in the endosomal system are not well understood. For basolateral proteins, sorting involves μ1B, which is a subunit of the Golgi- and recycling endosome-associated adaptor and clathrin-binding protein AP1 (Fölsch et al., 1999; Cancino et al., 2007; Gravotta et al., 2007). Interestingly, however, hepatocytes do not express μ1B. Endosomal membrane microdomains may participate in protein and lipid sorting (Mukherjee et al., 1999). In the recycling endosomes of fibroblastic cells, GPI-anchored proteins, which in epithelial cells are often expressed at the apical surface (Paladino et al., 2006), are segregated from the typical basolateral transferrin receptor in a cholesterol-dependent manner (Mayor et al., 1998). Furthermore, in the common recycling endosomes (also called subapical compartment or SAC) in polarized hepatocytes, fluorescent sphingolipid analogs are sorted, and the cell signaling-regulated apical targeting of lipid analogues from the endosomal system has been correlated to the biogenesis of apical cell surface domains (van IJzendoorn et al., 1997; van IJzendoorn and Hoekstra, 1999, 2000). Apart from signaling pathways involving protein kinase A and C (Zegers and Hoekstra, 1998), and calmodulin (Tyteca et al., 2005), no endosome-associated proteins are known to regulate the polarized distribution of membrane lipids and cell polarity.
In this study, we have investigated the function of the sodium-proton exchanger NHE6. In fibroblasts, NHE6 localizes to recycling endosomes (Brett et al., 2002; Nakamura et al., 2005) where it is suggested to regulate their lumenal pH (Nakamura et al., 2005; Ohgaki et al., 2008). Although the endosomal pH is important for regulating receptor–cargo interactions and for the intracellular trafficking of membrane proteins, the role of NHE6 in regulating membrane trafficking, and processes that are dependent on this, is not known. Here, we have characterized the subcellular distribution of NHE6 in polarized hepatocytes, and we demonstrate that NHE6 is required for regulating endosomal pH, for securing the polarized distribution of membrane lipids at the apical surface, and for apical plasma membrane development.
MATERIALS AND METHODS
Cell Culture
HepG2 cells and COS-7 cells were maintained in pyruvate-free DMEM (DMEM) containing 4.5 mg/L d-Glucose and in DMEM, respectively. Medium was supplemented with heat-inactivated 10% fetal calf serum, penicillin and streptomycin. For maintenance of stably transfected HepG2 cell lines, G418 (Invitrogen, Carlsbad, CA) was included in the medium. Cells were cultured at 37°C in 5% CO2. In all experiments, cells were seeded on poly-l-lysine–coated coverslips.
Materials and Antibodies
Lipofectamine 2000 (Invitrogen, Carlsbad, CA) was used for transfection of plasmid DNA and siRNA according to the manufacturer's instruction. C6-NBD-glucosylceramide (GlcCer) was synthesized as described previously (Kishimoto, 1975; Babia et al., 1994). Tetramethylrhodamine B isothiocyanate (TRITC)-labeled phalloidin was purchased from Sigma-Aldrich (St. Louis, MO). The following primary antibodies were used in this study: mouse anti-early sorting endosome (EEA)1 (Abcam, Cambridge, United Kingdom), mouse anti-lysosome-associated membrane protein (LAMP)1 (H4A3; Developmental Studies Hybridoma Bank, University of Iowa, Iowa City, IA), mouse anti-multidrug resistance-associated protein (MRP)2 (M2-III6; Alexis Biochemicals, Zandhoven, The Netherlands), mouse anti-β-tubulin (TUB 2.1; Sigma-Aldrich), rabbit anti-Ezrin (Santa Cruz Biotechnology, Santa Cruz, CA), rabbit anti-Giantin (Covance Research Products, Princeton, NJ), and rabbit anti-Rab11a (Zymed Laboratories, South San Francisco, CA). Affinity-purified rabbit polyclonal anti-NHE6 antibody was prepared as described previously (Ohgaki et al., 2008). Secondary antibodies used for immunostaining were conjugated with either one of Alexa Fluor488, Alexa Fluor546 (Invitrogen), or Cy5 (Jackson ImmunoResearch Laboratories, West Grove, PA). For immunoblotting, goat secondary antibodies against rabbit and mouse immunoglobulin G labeled with IRDye680 and IRDye800 were used (LI-COR Biosciences, Westburg B.V., Leusden, The Netherlands).
Plasmids
Expression plasmids of human NHE6 proteins, pCMV-hNHE6.0, pCMV-hNHE6.1, and pCMV-hNHE6.1-enhanced green fluorescent protein (EGFP) were constructed as described previously (Ohgaki et al., 2008). pCMV-hNHE6.1[E287Q/D292N] was constructed by the site-directed mutagenesis with overlapping primers (5′-GAC AGT ACA ATG GCA ACA GCG TTA TTT AGG ACG CTC TGT CCA AAA AGA AGT GCG TAA A-3′ and 5′-TTT ACG CAC TTC TTT TTG GAC AGA GCG TCC TAA ATA ACG CTG TTG CCA TTG TAC TGT C-3′). pCMV-hNHE6.1-mCherry and pCMV-hNHE6.1[E287Q/D292N]-mCherry were constructed for the expression of NHE6.1 tagged with a red fluorescent protein, mCherry. BamHI-XbaI DNA fragment encoding mCherry was amplified by polymerase chain reaction (PCR) from pcDNA3.1+ mCherry-human-β-tubulin (gift from Dr. Ben Giepmans, University Medical Center Groningen, Groningen, The Netherlands), and introduced in frame into pCMV-hNHE6.1. Rab11a-EGFP was a gift from R. E. Pagano (Mayo Clinic College of Medicine, Rochester, MN).
Generation of Stable Cell Lines
HepG2 cells were transfected with pCMV-hNHE6.1-mCherry or pCMV-hNHE6.1[E287Q/D292N]-mCherry. After 24 h, cells were split in selection medium containing G418 (0.8 mg/ml). Isolated candidate clones were tested for the expression of NHE6.1-mCherry by immunoblotting and immunofluorescence microscopy.
Knockdown of NHE6 by RNA Interference
Three sets of duplex small interfering RNAs (siRNAs) targeted against human NHE6 and a control scrambled siRNA were purchased from Invitrogen. The sense strand sequences of two siRNA are 5′-CCA AGG AGA UUU AUG GGA AAC AGU U-3′ (siNo.1) and 5′-GGA ACA GCA AUU UCU UGU UUC GUU A-3′ (siNo.2). Two of three NHE6 siRNAs that showed optimal knockdown efficiency were used throughout this study. For transfection of siRNA, HepG2 cells were seeded at 1.5 × 10⁵ cells/dish in 35-mm plastic dish. Twenty-four hours after passage, NHE6 siRNA or scrambled siRNA were transfected. In all experiments, untreated cells were also prepared as control. Cells were subsequently incubated for 48 h and used for assays.
Western Blotting
Cells were washed three times with ice-cold phosphate-buffered saline (PBS) and lysed in lysis buffer (PBS containing 1% NP-40 and protease inhibitors: 1 μg/ml aprotinin, 100 μM benzamidine, 0.5 μg/ml leupeptin, and 1 μg/ml pepstatin A). After incubation on ice for 30 min, cells were homogenized in a syringe with 27-gauge needle (20 strokes) and centrifuged for 10 min at 16,000 × g at 4°C. The supernatant fraction was collected and submitted to SDS-polyacrylamide gel electrophoresis (PAGE). Boiling or heat treatment of samples was omitted to avoid aggregation of NHE6. Proteins were transferred onto nitrocellulose membranes. For detection of immunoreactive signals, ODYSSEY infrared imaging system (LI-COR Biosciences, Westburg B.V.) was used according to the manufacturer's instruction. Obtained signals were analyzed and quantified with ImageJ software (National Institutes of Health, Bethesda, MD). When indicated, samples were treated with peptide N-glycosidase F (PNGase F; New England Biolabs, Ipswich, MA) basically according to the manufacturer's protocol, although boiling of the samples was omitted.
Measurement of the Lumenal pH of Transferrin-positive Endosomes in HepG2 Cells
Cells cultured in two-well chambered LabTek slides were serum starved in 0.1% bovine serum albumin (BSA)/Hanks' balanced salt solution (HBSS) at 37°C for 20 min. Cells were then incubated with 0.1% BSA/HBSS containing pH-sensitive fluorescein-labeled transferrin (66 μg/ml) in combination with pH-stable Alexa Fluor546- or Alexa Fluor633-labeled transferrin (33 μg/ml) at 37°C for 45 min. The fluorescein-labeled transferrin acts as a pH sensor, whereas the Alexa Fluor543 or 633 probe acts as an internal standard for uptake. Cells were subsequently washed with HBSS and analyzed with an inverted SP2 confocal laser scanning microscope (Leica, Wetzlar, Germany). For the calibration curve, cells were fixed with 4% paraformaldehyde after incubation with labeled transferrins, washed with HBSS, and incubated in calibration buffer, consisting of 125 mM KCl, 25 mM NaCl, and 25 mM HEPES (for pH 7.4) or 2-(N-morpholino)ethanesulfonic acid (for pH 6.8, 6.3, and 5.5), and 10 μM of the K+/H+ ionophore nigericin, for 15 min before analysis with the SP2 confocal laser scanning microscope (Leica). Digital images were collected and the intensity of fluorescence after background substraction was quantified with ImageJ software. Endosomal pH was calculated from the ratio of fluorescence intensity of fluorescein and Alexa Fluor543 or Alexa Fluor633 (Ohgaki et al., 2008).
Immunofluorescence Microscopy
For the localization studies with immunostaining, cells were fixed with 4% paraformaldehyde and permeabilized with 0.1% (vol/vol) Triton X-100. Then, cells were incubated with the primary antibodies for 1 h at 37°C, followed by incubation with fluorescently labeled secondary antibodies for 1 h at 37°C. To evaluate the polarity of HepG2 cells, samples were observed by AX-70 epifluorescence microscope (Olympus, Tokyo, Japan) equipped with a PlanApo 60×/1.40 oil objective with appropriate filter settings. Hoechst 33528 was added into secondary antibody solutions at the concentration of 5 ng/ml. Cells were incubated with either oncostatin M (OSM; 10 ng/ml) or dibutyryl cAMP (db-cAMP; 1 mM) for 4 h before fixation, when indicated. To obtain a quantitative index of polarity (BC/100 cells), randomly selected 10 fields (each containing >50 cells) were analyzed in each coverslip, and the number of bile canaliculi (BC) per 100 cells was calculated. Data are expressed as mean ± SD of three to five independent experiments.
Visualization of Subapical Compartment
The subapical compartment (SAC) was visualized with C6-NBD–labeled lipid analogues as described previously (van IJzendoorn and Hoekstra, 1998, 2000). In brief, cells were incubated with 4 μM C6-NBD-GlcCer or -SM in HBSS at 37°C for 30 min to allow internalization and transcytosis of lipids from the basolateral surface into the BC. The remaining basolateral pool of lipid analogue was removed on ice by a back-exchange procedure in 5% BSA/HBSS, pH 7.4, twice for 20 min. To induce translocation of lipid probes from BC and accumulation into SAC, cells were subsequently incubated in 5% BSA/HBSS, pH 7.4, at 18°C for 1 h. When indicated, fluorescence remaining at the BC was quenched by incubating the cells with 30 mM sodium dithionite at 4°C. After 10 min, the sodium dithionite was extensively washed out with ice-cold HBSS. The live cells were observed under by AX-70 epifluorescence microscope equipped with a PlanApo 60×/1.40 oil objective. Images were acquired with ColorView digital camera and analysis software (Soft Imaging System, Münster, Germany). To check the localization of EEA1-positive compartments, the procedure of SAC visualization was followed without lipid analogues. Subsequently, cells were fixed, stained and observed under AOBS SP2 laser confocal microscope system equipped with a HCX PL Apo 63×/1.40–0.60 oil objective.
Assay of GlcCer Transcytosis
The basolateral surface of cell was labeled by incubation with 4 μM C6-NBD-GlcCer in HBSS on ice for 15 min followed by washing with ice-cold HBSS, and chased at 37°C in prewarmed HBSS for indicated period to allow transcytosis of lipid probe. After wash with ice-cold HBSS, the remaining basolateral pool of lipid analogue was removed on ice by a back-exchange procedure. Then cells were washed with ice-cold HBSS, and observed under live condition as described above. Images were acquired with fixed exposure time and saved as 8-bit TIFF files. Quantification of the NBD fluorescence at BC was performed with ImageJ software. The location of BC identified by phase-contrast image was manually selected, and the mean fluorescence intensity at BC was calculated after subtraction of background. In a single experiment, in each coverslip, randomly selected 10 BCs were analyzed and the fluorescence intensity was averaged. Data are represented as mean ± SD of four independent experiments. Similarly sized BCs were selected for analysis, and difference in the averaged size of BC between siRNA-treated cells and untreated control cells was confirmed to be <5% in each experiment.
Analysis of the Fate of Apically Delivered C6-NBD-GlcCer
Cells were loaded with 4 μM C6-NBD-GlcCer in HBSS at 37°C for 30 min to allow internalization and transcytosis of probe into the BC. After washing with ice-cold HBSS, probes remaining at basolateral surface were removed on ice by a back-exchange procedure. Cells were subsequently incubated in 5% BSA/HBSS, pH 7.4, at 37°C for indicated period, followed by washing with ice-cold HBSS. Image acquisition and quantification of NBD-fluorescence at BC were performed as described above. In a single experiment, in each sample, randomly selected 10 BCs were analyzed, and the fluorescence intensity was averaged. Data are represented as mean ± SD of four independent experiments. Similarly sized BCs were selected for analysis, and difference in the averaged size of BC between siRNAs-treated cells and untreated control cells was confirmed to be <5% in each experiment.
Analysis of the Fate of Apically Delivered Dipeptidyl Peptidase (DPP) IV
Cells were washed with HBSS buffer and incubated in HBSS supplemented with antibodies against an extracellular epitope of DPPIV (gift from Dr. Hauri, Biozentrum der Universität Basel, Basel, Switzerland) at 4°C for 30 min. After extensive washes, the bound antibodies were chased to the apical domain at 37°C for 60 min (cf. Théard et al., 2007). To determine the subsequent fate of apically delivered DPPIV, the cells were either immediately fixed on ice with 4% paraformaldehyde (t = 0) or incubated at 37°C for 30, 60, 90, or 120 min and then fixed on ice. Fixed cells were permeabilized as described above and immunolabeled with Alexa Fluor488-labeled goat-anti-mouse secondary antibodies and stained with Alexa Fluor543- or 633-labeled phalloidin and Hoechst 33538. Data are expressed as percentage of phalloidin-labeled BC that are positive for DPPIV.
Statistical Analysis
Unpaired, two-tailed Student's t tests were used for statistical analysis. A p value of <0.05 was considered to be statistically significant.
RESULTS
HepG2 Cells Express Highly N-Glycosylated NHE6.1
We first examined the expression of NHE6 in HepG2 cells. As shown in Figure 1, NHE6 appears as three major bands of >200 kDa (a), ∼86 kDa (b), and ∼60 kDa (c) on a Western blot. In agreement with their respective increase in electrophoretic mobility when lysates had been treated with peptide N-glycosidase F (PNGase), which removes N-linked glycans from proteins, these bands correspond to highly glycosylated oligomers (a in comparison with d), glycosylated mature proteins, and less glycosylated immature proteins (b and c in comparison with e), respectively. Two splice variants of NHE6 have been reported, NHE6.0 and NHE6.1. Comparison of the Western blot profile of NHE6 in HepG2 cells with that of the two splice variants ectopically expressed in COS-7 cells indicates that HepG2 cells express the NHE6.1 variant. It was noted that, compared with NHE6.1 from COS-7 cells, NHE6.1 from HepG2 cells migrates somewhat slower in the polyacrylamide gel. This difference was not observed when lysates had been treated with PNGase F, indicating that NHE6.1 in HepG2 cells is highly N-glycosylated.
Figure 1.

Endogenous expression and novel N-glycosylated state of NHE6.1 in HepG2 cells. Endogenous NHE6 expressed in HepG2 was detected by immunoblotting with anti-NHE6 antibody. For comparison of the apparent molecular size on the SDS-PAGE gel, one of two NHE6 variants, NHE6.0 or NHE6.1, was transiently expressed in COS-7 cells. Untransfected cells were used as a negative control (Mock). Lysate of HepG2 cells was loaded 10 μg of protein per lane, whereas COS-7 lysates were diluted to 50-fold (0.2 μg protein/lane). Before the separation by SDS-PAGE, samples were incubated at 37°C for 1 h in the absence (left) or the presence of PNGase F (right). Immunoreactive NHE6 bands are indicated with small letters with bars.
NHE6.1 Dynamically Localizes to Sorting and Recycling Endosomes in Polarized HepG2 Cells
To determine the subcellular distribution of NHE6.1 in polarized HepG2 cells, parental HepG2 cells or HepG2 cells transiently expressing NHE6.1-EGFP or NHE6.1-mCherry fusion proteins were cultured on glass coverslips for 3 d to allow maximal polarity development, and fixed with paraformaldehyde. Fixed cells were labeled with antibodies against NHE6.1 and/or antibodies against known organellar marker proteins. These included the EEA1 (early sorting endosomes), the LAMP1 (late endosomes and lysosomes), the small GTPase Rab11a (apical recycling endosomes), and giantin (Golgi apparatus). The apical surface was marked with MRP2 immunolabeling or TRITC-labeled phalloidin, which stains the dense subapical actin filaments. To examine whether NHE6.1 colocalized with Rab11a, either NHE6.1 or Rab11a was expressed as EGFP fusion (because of antibody compatibility issues). The transient expression did not alter the localization of either protein. As shown in Figure 2, A and B, NHE6.1-positive structures nearly completely colocalize with EEA1-positive early endosomes, dispersed throughout the cytoplasm. In addition, NHE6.1 colocalized with Rab11a-positive apical recycling endosomes surrounding MRP2-containing apical surface domains. No colocalization was observed with LAMP1-positive late endosomes and lysosomes or giantin-positive Golgi membranes (Figure 2, C and D).
Figure 2.

Subcellular localization of NHE6.1 in HepG2 cells. Localization of NHE6.1 in HepG2 cells was characterized by immunofluorescence confocal microscopy after fixation with 4% PFA. (A) Cells were transiently transfected with Rab11a-GFP (green), and stained for endogenous NHE6 (red) with either MRP2 or EEA1 (blue). (B) NHE6-EGFP (green) was transiently expressed in HepG2 cells. Cells were stained for endogenous Rab11a (red) with either MRP2 or EEA1 (blue). (C) Cells were stained for endogenous NHE6 (green), F-actin (red), and LAMP-1 (blue). (D) Cells transiently expressing NHE6-EGFP (green) were stained for F-actin (red) and Giantin (blue). Antibodies used for the detection of endogenous proteins are described in the Materials and Methods. For the staining of F-actin, TRITC-labeled phalloidin was used. The shape of cells was identified by differential interference contrast images and indicated with broken lines. Bars, 10 μm.
In addition to EEA1- and Rab11a-positive endosomes, polarized cells contain a common recycling endosome or SAC where cargo, internalized from basolateral and apical domains, converge (reviewed in Hoekstra et al., 2004). The SAC in polarized HepG2 cells can be visualized by the low temperature-mediated entrapment of fluorescent lipid analogues, because their exit from the SAC but not other endosomes is inhibited at this temperature (van IJzendoorn et al., 1998; see Materials and Methods). The basolateral surfaces of HepG2 cells were first incubated with C6-NBD-sphingomyelin (SM) or GlcCer at 37°C for 30 min, which allows basolateral to apical transcytosis of the lipid analogues. After the removal of lipid probes remaining at the basolateral surface by a back exchange procedure with BSA (see Materials and Methods), the lipid analogues are subsequently chased from the apical surface at 18°C for 60 min, which causes their accumulation in the subapical compartment [van IJzendoorn et al., 1998; see Figure 3, sodium dithionite (−)]. Finally, fluorescence from lipid analogues remaining at the apical surface is quenched with sodiumdithionite at 4°C for 10 min (van IJzendoorn et al., 1998). After these steps, the majority of intracellular fluorescent lipid can be visualized in the SAC [Figure 3, sodium dithionite (+)]. Because permeabilization of the cells for immunolabeling would perturb the subcellular distribution of the fluorescent lipid analogues, we performed this experiment in cells stably transfected with mCherry-tagged NHE6.1. Ectopically expressed NHE6.1-mCherry and endogenous NHE6.1 displayed a similar intracellular distribution (data not shown). As shown in Figure 3, NHE6.1-mCherry prominently colocalized with the fluorescent lipid analogues in the SAC. Together, we conclude that NHE6.1 localizes to all compartments (i.e., early sorting endosomes, common recycling endosomes/SAC and apical recycling endosomes) that make up the endosomal recycling system.
Figure 3.

Localization of NHE6.1 in SAC. HepG2 cells stably expressing NHE6.1-mCherry (red) were labeled with 4 μM C6-NBD-GlcCer or C6-NBD-SM (green) at 37°C for 30 min. Subsequently, fluorescent lipid analogue remaining in the basolateral membrane was removed by back exchange method with 5% BSA on ice. Cells were further incubated at 18°C for 60 min to induce accumulation of the lipid analogue at SAC. To selectively quench the fluorescence at BC, cells were incubated with 30 mM sodiumdithionite at 4°C for 7 min [sodium dithionite (+)]. As a control, cells were treated with HBSS at the same condition [sodium dithionite (−)]. Cells were directly subjected to observation by microscope under live condition. Merged fluorescent images and phase contrast images are also shown (Merged and PC, respectively).
In cells that had been incubated at 18°C for 1h, NHE6.1-mCherry accumulated in the subapical region and less of the protein was detected in the periphery of the cells (Figure 3, left row/red fluorescence; compared with NHE6 and NHE6-green fluorescent protein (GFP) staining pattern in control cells in Figure 2). To determine whether an incubation of the cells at 18°C somehow caused a general redistribution and subapical accumulation of endosomes, we immunolabeled 18°C-treated cells with antibodies against EEA1 to visualize early sorting endosomes, which typically localize throughout the cell. EEA1 mostly remained scattered throughout the cells and NHE6.1-mCherry or endogenous NHE6.1 no longer extensively colocalized with EEA1 (Figure 4; compare with Figure 2). These data indicate that NHE6.1 at steady state (37°C) localizes to all early endocytic compartments, but at 18°C, which is rate limiting for passage through the SAC, accumulates in the SAC. The localization of NHE6.1 within distinct endosomal compartments therefore seems highly dynamic and could be subject to trafficking through the endosomal system.
Figure 4.

Segregation of NHE6.1 from EEA1-positve early endosomes during SAC visualization. The procedure of SAC visualization described in Figure 3 was followed with NHE6.1-mCherry stable cells (top) and normal HepG2 cells (bottom), except that fluorescent lipid analogue was omitted from the solution. Cells were then fixed and investigated by immunostaining. In stable cells, the localization of NHE6.1-mCherry was identified by its fluorescence (red), and compared with the localization of Ezrin (green) and EEA1 (blue). Normal HepG2 cells were stained for F-anctin (red), NHE6 (green) and EEA1 (blue). The shape of cells was confirmed by differential interference contrast images and indicated with broken lines. Bar, 10 μm.
NHE6.1 Controls the Number of Apical Lumens Predominantly during the Maintenance Phase
Given the localization of NHE6.1 in the endosomal recycling system, particularly in the SAC, we wondered whether NHE6.1 could play a role in trafficking regulation and hence apical plasma membrane biogenesis or maintenance. The biogenesis of apical plasma membrane domains in HepG2 cells coincides with the formation of apical lumens. Live imaging of HepG2 cell cultures reveals a dynamic formation and disassembly of apical lumens in time (our unpublished data). The number of apical lumens increases progressively during the first 24 after plating (biogenesis phase), after which the percentage increase levels off and reaches a steady-state level ∼72 h (maintenance phase) before the number of apical lumens starts to decrease (van IJzendoorn and Hoekstra, 2000). To discriminate between these biogenesis and maintenance phases, we designed three experiments. In experiment A, cells were transfected with either of two siRNAs against human NHE6.1 or scrambled siRNA 24 h after plating and analyzed 48 h later (maintenance phase; Figure 5A). In experiment B, siRNA-treated cells as in experiment A were subsequently detached from the substratum with trypsin and the calcium chelator EDTA (a procedure that destroys all existing apical lumens), replated and analyzed 24 h later (biogenesis phase; Figure 5A). Alternatively, in experiment C (Figure 5A), siRNA-treated cells as in experiment A were subsequently stimulated with OSM (10 ng/ml) or db-cAMP (1 mM) at 37°C for 4 h, taking advantage of a previously published observation that apical lumen biogenesis in 72-h-old HepG2 cell cultures can be further stimulated within a short (4-h) time span by exposing the cells to these compounds (Zegers and Hoekstra, 1997; van IJzendoorn and Hoekstra, 2000; van der Wouden et al., 2002; van IJzendoorn et al., 2004; Wojtal et al., 2007). Western blot analyses demonstrated that 48 h after transfection, expression of NHE6.1 was inhibited by >70% with either of the two siRNAs directed against NHE6.1, whereas the scrambled siRNA was without effect (Figure 5, B and C). Also 24 h after subsequent replating, NHE6.1 expression was still reduced with ∼70% compared with control cells (Figure 5D).
Figure 5.

Effect of altered NHE6.1 expression on the development of apical lumens during the maintenance- and biogenesis phase. (A) Schematic procedure of sample preparation and analysis. In experiment A, cells were transfected with either of two siRNAs against human NHE6.1 or scrambled siRNA 24 h after plating and analyzed 48 h later (maintenance phase). In experiment B, siRNA-treated cells as described in experiment A were subsequently detached from the substratum with trypsin and the calcium chelator EDTA (a procedure that destroys all existing apical lumens), replated, and analyzed 24 h later (biogenesis phase). In experiment C, siRNA-treated cells as described in experiment A were subsequently stimulated with OSM (10 ng/ml) or db-cAMP (1 mM) at 37°C for 4 h (biogenesis phase). (B) Samples were prepared as described in experiment A, and the expression of NHE6.1 (top) and β-tubulin (bottom) was analyzed by Western blotting. (C) The intensity of immunoreactive bands in B was quantified as described under Materials and Methods. The relative amount of expression was calculated as percentage relative to control. The data shown are the average of five independent experiments ± SD. *p < 0.05 in unpaired Student's t test. (D) Cells were prepared as described in experiment B, and expression of NHE6.1 (top) and β-tubulin (bottom) was analyzed by immunoblotting. (E) Knockdown of NHE6.1 was conducted as described in experiment A. Forty-eight hours after transfection, cells were fixed and stained for apical BC membrane markers: MRP2, F-actin, MDR1-GFP, and GFP-GPI. Staining for F-actin was performed with normal HepG2 cells, whereas the fluorescence of GFP of stable transformants was used for MDR1-GFP and GFP-GPI. Polarity of cells, expressed as BC/100 cells, was determined and shown as percentage relative to untreated control cells. The data shown are the average of four independent experiments ± SD, *p < 0.05 in unpaired Student's t test. (F) Knockdown of NHE6.1 was performed as described in experiment B. Forty-eight hours after transfection of siRNA, cells were split again and incubated for further 24 h. Then, cells were fixed, stained for MRP2, and subjected to the investigation of polarity (BC/100 cells). The data shown are the average of four independent experiments ± SD, *p < 0.05 in unpaired Student's t test. (G) Knockdown of NHE6.1 was performed as described in experiment C. Forty-eight hours after transfection, cells were treated with medium supplemented with OSM (10 ng/ml) (light gray bars) or db-cAMP (1 mM) (open bars) for 4 h and then fixed and stained for MRP2. The Polarity was investigated and shown as percentage relative to control cells treated with normal medium (dark gray bars). The data are expressed as the mean value of four independent experiments ± SD, *p < 0.05 in unpaired Student's t test. (H) Three stable clones of NHE6.1-mCherry and a stable clone of mutant NHE6.1-mCherry were established and isolated as described in Materials and Methods. From 1 d to 3 d after split, cells were fixed at every 24 h, and the polarity was evaluated by apical staining with MRP2 (BC/100 cells). The data are expressed as the mean value of four independent experiments ± SD, *p < 0.05 in unpaired Student's t test.
To accurately determine the effect of NHE6.1 knockdown on the number of apical lumens, cells were fixed and immunolabeled with antibodies against the resident bile canalicular membrane proteins MRP2 (ABCC2), MDR1-GFP, or GFP-GPI, and with the DNA binding dye Hoechst 33528. Alternatively, apical lumens were visualized with the actin filament-binding TRITC-phalloidin, which is indicative of the presence of apical lumen structures regardless of their protein composition. Cells then were examined with the fluorescence microscope and the ratio of apical lumens per 100 cells was calculated (see Materials and Methods). In experiment A (maintenance phase), NHE6.1 knockdown reduced the number of apical lumens with ∼50% (p < 0.05, Student's t test) compared with cultures treated with scrambled siRNA (Figure 5E). In experiment B (biogenesis phase), the number of apical lumens that appeared between 0 and 24 h after NHE6.1 knockdown was reduced with ∼25% compared with cultures treated with scramble siRNA (Figure 5F). In experiment C (biogenesis phase), NHE6.1 knockdown did not prevent OSM or db-cAMP from stimulating the further development of apical lumens (Figure 5G). The inhibition of NHE6.1 expression did not perturb the appearance or spatial organization of sorting and recycling endosomes in polarized HepG2 cells (Supplemental Figure 1).
In addition to the knockdown experiments, a 10-fold stable overexpression of NHE6-mCherry (Supplemental Figure 2), slightly reduced the number of apical lumens with <25% during the first 24 h of culturing (biogenesis phase), but at 48 and 72 h after plating, when maintenance comes into play, a pronounced reduction in the number of apical lumens of ∼60% was observed (Figure 5H). A 10-fold stable overexpression of a nonfunctional NHE6.1[E287Q/D292N]-mCherry mutant (see below) did not alter the number of apical lumens (Figure 5H), suggesting that the observed effect of wild-type NHE6.1 overexpression is not the result of overexpression-related toxicity. Collectively, these data demonstrate that changes in the expression level of NHE6.1 in HepG2 cell cultures reduce the number of bile canalicular lumens, and point to a role of NHE6.1 in the maintenance, rather than the de novo biogenesis of bile canalicular lumens.
Altered NHE6.1 Expression Leads to a Less Efficient Retention of Bulk Membrane Lipids at the Apical Plasma Membrane Domain
How does NHE6.1, a protein located in the endosomal system, contribute to apical lumen development? Hepatocytes rely heavily on the endosomal system for the polarized trafficking of bile canalicular membrane components. Thus, many newly synthesized bile canalicular components reach the apical surface after their initial delivery to the basolateral, sinusoidal surface and subsequent basolateral to apical transcytosis. In addition, apical plasma membrane components are subject to endocytosis, followed by their subsequent degradation or recycling to the apical surface. We first examined whether NHE6.1 colocalized with the fluorescent lipid analogue GlcCer. This lipid analogue is a marker of bulk membrane flow and transcytosed from the basolateral surface to the apical surface, where it is efficiently retained via apical recycling (van IJzendoorn et al., 1997; van Ijzendoorn and Hoekstra, 1998). The basolateral surfaces of HepG2 cells expressing NHE6.1-mCherry were continuously incubated with the fluorescent lipid at 37°C for 30 min, which allows the lipid probe to fill the entire transcytotic pathway (van IJzendoorn et al., 1997). Cells were then examined with the fluorescence microscope. As shown in Figure 6A, NHE6.1-mCherry extensively colocalized with structures that were fluorescently labeled with transcytosing C6-NBD-GlcCer, consistent with the colocalization of NHE6.1 with endosome markers (Figure 2). These data confirm that NHE6.1 associates with the transcytotic route followed by bulk membrane flow.
Figure 6.

Colocalization of NHE6.1 with transcytosing lipids and effect of NHE6.1 knockdown on the kinetics of transcytosis. (A) HepG2 cells stably expressing NHE6.1-mCherry (red) were incubated with 4 μM C6-NBD-GlcCer (green) on ice for 15 min and incubated at 37°C for 15 min. The remaining basolateral pool of lipid analogue was removed on ice by a back-exchange procedure and cells were observed under live condition. Merged fluorescent images and phase contrast images are also shown (Merged and PC, respectively). Bottom, high magnification of the indicated area in top panels with a white square. (B) Knockdown of NHE6.1 was conducted as described in Figure 5. After incubation with 4 μM C6-NBD-GlcCer on ice for 15 min, cells were chased at 37°C for indicated periods (5, 15, and 30 min). Quantification of the NBD fluorescence at BC was performed as described in Materials and Methods (untreated control cells, dark gray bars; scrambled siRNA-treated cells, bright gray bars; NHE6.1 siRNA-treated cells, open bars and slashed bars). In a single experiment, in each sample, randomly selected 10 BCs were analyzed and the fluorescence intensity was averaged. Data are shown as mean ± SD of four independent experiments. *p < 0.05 in unpaired Student's t test. (C) Representative images of cells chased for 30 min were shown (untreated control cells, top; NHE6.1 siRNA-treated cells, bottom.
To investigate whether NHE6.1 regulates apical plasma membrane-directed bulk membrane flow, the expression of NHE6.1 in HepG2 cells was inhibited by treating 24-h-old cells with siRNAs (see Materials and Methods). A pulse-chase experiment was then performed with C6-NBD-GlcCer (see Materials and Methods). For this, transcytosis of the lipid analogue, preinserted into the basolateral surface of control and siRNA-treated cells, was assessed after 5, 15, and 30 min by measuring the fluorescence intensity of C6-NBD-GlcCer in the apical surface. As shown in Figure 6B, the inhibition of NHE6.1 expression did not inhibit basolateral-to-apical transcytosis of C6-NBD-GlcCer during the first 15 min. However, the accumulation of C6-NBD-GlcCer in the apical plasma membrane was significantly reduced (p < 0.05, Student's t test) after a subsequent 15-min chase, compared with control cells. We observed no visible intracellular accumulation of lipid analogs after incubation at 37°C (Figure 6C).
Given the absence of an effect during the first 15 min of transcytosis, and because a restriction of this experiment is that it does not take the subsequent fate of apically arrived lipid analogues into account, we hypothesized that NHE6.1 knockdown might not inhibit basolateral-to-apical transcytosis of the lipid analogues but rather their subsequent apical retention. To address this, the lipid analogue was allowed to transcytose to the apical plasma membrane domain after which its subsequent fate was monitored by a subsequent chase at 37°C for 15, 30, or 60 min in back exchange medium (see Materials and Methods; cf. van IJzendoorn et al., 1997). At each time point, the mean fluorescence intensity in the apical surface was measured (see Materials and Methods). In control cells, 17, 42, and 58% of the original apical NBD fluorescence was lost after a 15-, 30-, and 60-min chase, respectively (Figure 7A, circles). In contrast, in siRNA-treated cells, 47, 67, and 78% of the original apical NBD fluorescence was lost after a 15-, 30-, and 60-min chase, respectively (Figure 7, squares). Thus, an increase in the loss of apical membrane-associated NBD-lipid of ∼275% was observed during the first 15 min of chase (Figure 7A). A similar loss of apical membrane-associated NBD-lipid was observed in cells that stably overexpress wild-type NHE6.1-mCherry but not in cells that stably overexpress the mutant NHE6.1[E287Q/D292N]-mCherry (Figure 7B). No intracellular accumulation of the labeled lipids was observed in NHE6.1 knockdown or overexpressing cells. It is concluded that after its delivery at the apical surface in NHE6.1 knockdown or overexpressing cells, C6-NBD-GlcCer is less well retained at the apical surface and, instead, is likely to be transcytosed to the basolateral surface, where the probe would be retrieved by the BSA in the incubation medium.
Figure 7.

Effect of NHE6 knockdown on the fate of apically delivered C6-NBD-GlcCer and DPPIV. (A and B) After knockdown of NHE6 as described in Figure 5 (A) or overexpression of NHE6.1-mCherry or NHE6.1[E287Q/D292N]-mCherry (B), HepG2 cells were loaded with 4 μM C6-NBD-GlcCer at 37°C for 30 min. After back-exchange procedure on ice, cells were subsequently incubated in 5% BSA/HBSS, pH 7.4, at 37°C for indicated period. Quantification of the NBD fluorescence at BC was performed as described in Materials and Methods. In a single experiment, in each sample, randomly selected 10 BCs were analyzed and the fluorescence intensity was averaged. Data are shown as mean ± SD of four independent experiments. *p < 0.05 in unpaired Student's t test. (C) After knockdown of NHE6 as described in Figure 5 (A) or overexpression of NHE6.1-mCherry or NHE6.1[E287Q/D292N]-mCherry (B), anti-DPPIV antibodies were allowed to bind DPPIV at the basolateral surface and transcytose to the apical domain. The fate of apically delivered DPPIV was subsequently determined by a subsequent chase at 37°C for 30, 60, 90, or 120 min, as described in Materials and Methods. Data are shown as mean percentage of DPPIV-positive BC (±SD) of three independent experiments. (D) Fluorescent images showing the persistent localization of DPPIV in phalloidin-positive BC (filled arrows) and the loss of DPPIV signal from some phalloidin-labeled BC (empty arrows) in siRNA treated and NHE6.1-mCherry-overexpressing cells, after a 120-min chase period. Bar, 10 μm.
Altered NHE6.1 Expression Leads to a Less Efficient Retention of a Bile Canalicular Protein at the Apical Plasma Membrane Domain
We next investigated the fate of a resident bile canalicular protein DPP IV in the apical plasma membrane domain of parental, NHE6.1 knockdown, and NHE6.1-mCherry overexpressing HepG2 cells. Like other single membrane spanning canalicular proteins in hepatocytes, newly synthesized DPPIV is first delivered to the basolateral surface from where it is transcytosed to the apical plasma membrane domain. This typical indirect mode of trafficking allows a pulse-chase analysis of basolateral to apical transcytosis of the protein and its subsequent fate in the apical plasma membrane domain, using antibodies directed against an external epitope of DPPIV (Slimane et al., 2003). Thus, HepG2 cells are incubated with anti-DPPIV antibodies at 4°C for 30 min, washed to remove nonbound antibodies, and incubated at 37°C for 60 min to allow transcytosis to the apical plasma membrane (cf. Slimane et al., 2003; Théard et al., 2007). DPPIV in the apical plasma membrane was then chased for 0, 30, 60, 90, or 120 min to examine its fate. At each time point, cells were fixed and immunolabeled with a fluorescently conjugated secondary antibody against the anti-DPPIV antibody and costained with Alexa-Fluor543–conjugated phalloidin to visualize F-actin as a structural component of the apical plasma membrane domains. As shown in Figure 7C, after 0 min of chase, 92% of Alexa Fluor543-phalloidin–positive BC was positive for DPPIV, and this remained stable for at least 120 min. In NHE6.1 knockdown cells the percentage of Alexa Fluor543-phalloidin–positive BC containing DPPIV did not significantly change after 30 or 60 min, whereas after 90 and 120 min this percentage significantly decreased to 63 and 55%, respectively (Figure 7C). Similarly, in HepG2 cells overexpressing NHE6.1-mCherry, the percentage of Alexa-Fluor633-phalloidin-positive BC containing DPPIV did not significantly change after 30 or 60 min, whereas after 90 and 120 min this percentage significantly decreased to 71 and 62%, respectively (Figure 7C). In both cases, intracellular or basolateral appearance of DPPIV could not be detected. This decrease in the percentage of Alexa-Fluor633-phalloidin–positive BC containing DPPIV was not observed in HepG2 cells overexpressing the mutant NHE6.1[E287Q/D292N]-mCherry (Figure 7C). Representative images showing the persistent localization of DPPIV at phalloidin-positive BC (filled arrows) and a loss of DPPIV signal from phalloidin-positive BC in siRNA-treated and NHE6.1-mCherry overexpressing cells (empty arrows) are depicted in Figure 7D. Collectively, these data suggest that an altered NHE6.1 expression leads to a less efficient retention of the bile canalicular protein DPPIV at the apical plasma membrane domain.
Altered NHE6.1 Expression Influence Endosome pH
We next determined whether NHE6.1 knockdown or overexpression of wild-type or mutant (E287Q/D292N) NHE6.1-mCherry influenced the pH of subapical transferrin-positive endosomes (see Materials and Methods). We decided to mutate residues E287 and D292 in NHE6.1 because the corresponding residues in NHE1 (Murtazina et al., 2001) and NHE8 (Nakamura et al., 2005) resulted in a loss of ion transport activity. Quantitative confocal microscopic analyses of living, polarized HepG2 cells revealed that the pH of subapical transferrin-positive endosomes was 6.6 (Figure 8), which is in agreement with earlier reports on the pH of recycling endosomes in other cell types (Wang et al., 2000; Nakamura et al., 2005). NHE6.1 knockdown reduced the pH to 5.9, whereas overexpression of NHE6.1-mCherry increased the pH of subapical transferrin-positive endosomes to 7.3 (Figure 8). Overexpression of the mutant NHE6.1[E287Q/D292N]-mCherry did not affect endosome pH, supporting that this is a nonfunctional NHE6.1 mutant. Collectively, these data demonstrate that NHE6.1 contributes to the pH regulation of subapical recycling endosomes.
Figure 8.
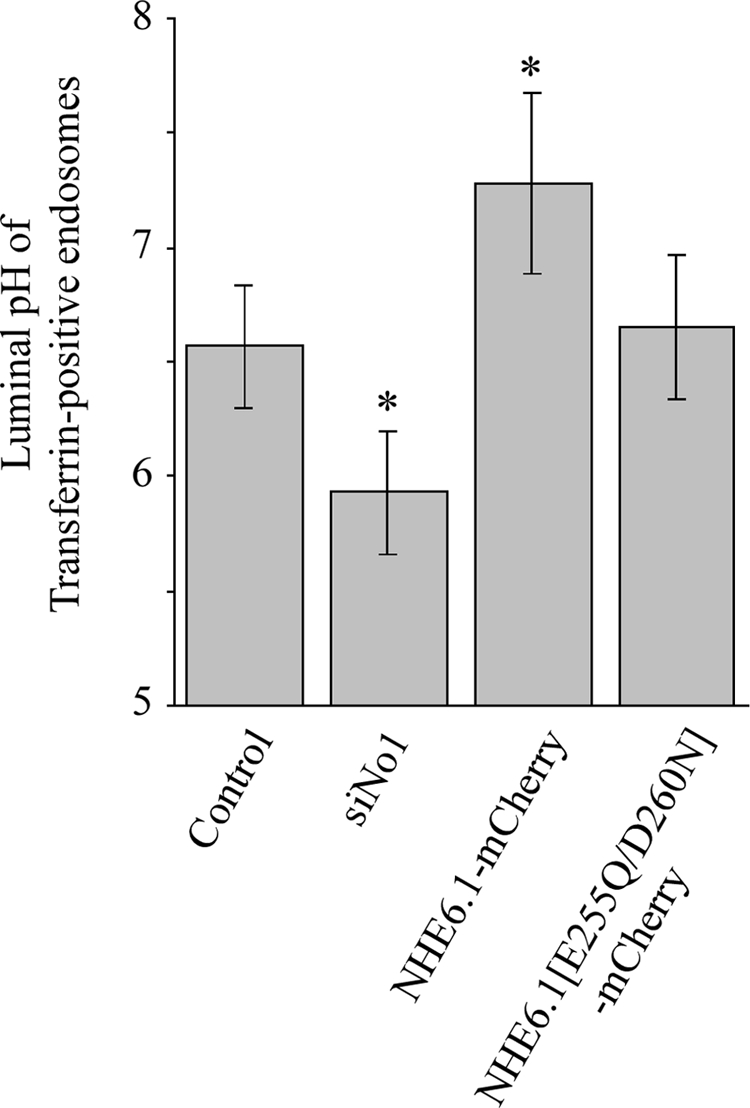
Effect of altered NHE6.1 expression on endosomal pH. Serum-starved cells that had been treated with siRNA against NHE6.1 or overexpressed wild-type or mutant NHE6.1-mCherry were incubated with a combination of pH-sensitive fluorescein-labeled transferrin and pH-stable Alexa Fluor546- or Alexa Fluor633-labeled transferrin to measure endosomal pH as described in Materials and Methods. Data are presented as mean ± SD.
DISCUSSION
In this study, we have investigated the role of NHE6, a sodium-proton exchange protein, in polarized hepatic HepG2 cells. We demonstrate that HepG2 cells express an NHE6.1 variant that resides in EEA1- and Rab11a-containing early and apical recycling endosomes, respectively, and in the subapical compartment (equivalent of the common recycling endosome in other epithelial cells). NHE6.1 in HepG2 cells is highly N-glycosylated and represents the first demonstration of a different state of N-glycosylation of not only NHE6 but also of all NHE isoforms between cell lines, although the functional significance remains to be determined. The endosomal localization of NHE6.1 in polarized cells is consistent with that in fibroblastic cells (Brett et al., 2002; Nakamura et al., 2005). We never observed NHE6.1 in late endosomes, or the Golgi complex. In agreement with its subcellular distribution, NHE6.1 colocalizes with all intracellular compartments of the transcytotic pathway followed by bulk membrane flow (visualized with fluorescent lipid analogues). Intriguingly, when cells are incubated at 18°C, which permits vesicular trafficking but prevents exit from the subapical compartment (Apodaca et al., 1994; Barroso and Sztul, 1994; van IJzendoorn and Hoekstra, 1998), NHE6.1 accumulates in the subapical compartment leaving peripheral EEA1-containing endosomes devoid of NHE6.1. Together, the data indicate that NHE6.1 associates with the transcytotic route for bulk membrane flow, and that NHE6.1 itself is subject to trafficking through the endosomal recycling system.
Knockdown or overexpression of NHE6.1 and NHE6.1-mCherry, respectively, in HepG2 cells caused a reduction in the number of apical bile canalicular lumens and therefore a reduction in the number of apical plasma membrane domains. However, the de novo biogenesis of apical surface domains, as occurs after treatment of the cells with oncostatin M or dibutyryl cAMP or after cell plating, was not or only slightly inhibited. In addition, after NHE6.1 knockdown, the transcytotic delivery of sphingolipid analogs to the apical surface as such was not inhibited, but the loss of apically delivered sphingolipid analogs and the resident bile canalicular protein DPPIV from the apical surface was clearly promoted compared with control cells. In addition to NHE6.1 knockdown, the overexpression of wild type NHE6.1-mCherry, but not that of a nonfunctional mutant of NHE6.1, promoted the loss of apically delivered sphingolipids and dipeptidyl peptidase IV. These data suggest that a carefully controlled expression of NHE6.1 is required for polarized HepG2 cells to maintain their apical cell surface domains, possibly by controlling the polarized cell surface distribution of membrane lipids.
The molecular mechanism via which NHE6 controls membrane trafficking remains elusive. Knockdown or overexpression of NHE6.1 did not cause visible changes in the appearance (e.g., size or number) of early and recycling endosomes. Neither did it perturb the profoundly polarized spatial organization of Rab11a-positive apical recycling endosomes. Consistently, no abnormalities were observed in the appearance of endosomes in fibroblast of patients with X-linked mental retardation caused by mutations in NHE6 (Gilfillan et al., 2008). Knockdown of NHE6.1 reduced the lumenal pH of transferrin-positive endosomes. Conversely, overexpression of NHE6.1-mCherry, but not mutant NHE6.1[E287Q/D292N]-mCherry, elevated the lumenal pH of transferrin-positive endosomes, similar to overexpressed NHE8 or NHE9 in organelles of other cell lines (Nakamura et al., 2005). These data present the first evidence that NHE6.1 expression, and its residues E287 and D292, contributes to the regulation of endosomal pH. It is plausible that polarized membrane trafficking and apical plasma membrane maintenance requires the pH of endosomes to be kept within a limited range. Although the exact role of endosome pH in the regulation of membrane trafficking and in particular polarized trafficking is unclear, steep pH gradients in the apical recycling pathway have been demonstrated (Wang et al., 2000). Moreover, the specific expression of an acid-activated ion channel in apical endosomes was shown to affect apical plasma membrane-directed trafficking (Henkel et al., 1998). The lumenal pH of endosomes has been reported to regulate the recruitment of β-COP and ε-COP, known to control vesicular trafficking and endosomal recycling, to the cytoplasmic surface of endosomes (Aniento et al., 1996). However, we did not detect any β- or ε-COP that colocalized with EEA1- or Rab11a-positive endosomes in HepG2 cells by confocal fluorescence microscopy. The yeast Na+/H+ exchanger Nhx1p, which mostly resembles mammalian NHE6, regulates luminal and cytoplasmic pH to control vesicle trafficking out of the endosome and Nhx1p knockout results in the entrapment of proteins in endosomes as well as a missorting of vacuolar protein to the extracellular space, which is accompanied by an aberrant endosomal morphology (Bowers et al., 2000; Brett et al., 2005). In our experiments, by contrast, the down-regulated expression or overexpression of NHE6.1 did not cause a visible intracellular accumulation of the proteins or lipids tested. Although our study demonstrates that NHE6.1, conceivably by fine tuning the endosomal pH as shown here directly for the first time, is involved in securing the polarized distribution of membrane lipids in epithelial cells, future studies are thus needed to address the underlying mechanisms.
Our study adds to the emerging view that regulatory proteins residing in the endosomal system control epithelial cell surface polarity. Importantly, however, to date only a few endosomal proteins that control surface polarity have been identified. The μ1B subunit of the Golgi- and recycling endosome-associated AP1 adaptor protein controls sorting of proteins to the basolateral surface of cultured epithelial cells. In vivo, myosin Vb, a protein that normally localizes in recycling endosomes and regulates protein trafficking, was recently linked to microvillus inclusion disease, a rare but fatal enteropathy characterized by the absence of a structurally and compositionally defined apical cell surface domain in the patients' intestinal epithelial cells (Müller et al., 2008; Erickson et al., 2008; our unpublished data). In hepatocytes, loss of Rab11a or myosin Vb function perturbs the development of apical bile canalicular plasma membrane domains (Wakabayashi et al., 2005). The intestine-specific knockout of the small GTPase Rab8 in mice resulted in a specific loss of the apical surface in intestinal epithelial cells, resembling microvillus inclusion disease (Sato et al., 2007). These in vivo studies clearly demonstrate the role of the recycling endosomal system in apical cell surface polarity. Our study identifies endosomal NHE6 as a novel regulatory protein in the development of the apical cell surface domain of cultured hepatic cells, and underscores the importance of the endosomal system in epithelial polarity. Interestingly, mutations in NHE6 cause X-linked mental retardation resembling Angelman syndrome (Gilfillan et al., 2008), and it will be of interest to investigate whether these NHE6 mutations cause defects in neuronal polarity.
Supplementary Material
ACKNOWLEDGMENTS
We thank Naomi Fukura for help with the construction of the mutant NHE6.1 plasmid. R. O. and M. M. were supported by a grant from the Osaka University Graduate School of Science International Training Program for Young Talents (OU-GSS-ITP). We acknowledge the Dutch Organization for Scientific Research (Nederlandse Organisatie voor Wetenschappelijk Onderzoek) for providing a Visitors Travel Grant (to H. K.).
Footnotes
This article was published online ahead of print in MBoC in Press (http://www.molbiolcell.org/cgi/doi/10.1091/mbc.E09-09-0767) on February 10, 2010.
REFERENCES
- Apodaca G., Katz L. A., Mostov K. E. Receptor-mediated transcytosis of IgA in MDCK cells is via apical recycling endosomes. J. Cell Biol. 1994;125:67–86. doi: 10.1083/jcb.125.1.67. [DOI] [PMC free article] [PubMed] [Google Scholar]
- Aniento F., Gu F., Parton R. G., Gruenberg J. An endosomal beta COP is involved in the pH-dependent formation of transport vesicles destined for late endosomes. J. Cell Biol. 1996;133:29–41. doi: 10.1083/jcb.133.1.29. [DOI] [PMC free article] [PubMed] [Google Scholar]
- Babia T., Kok J. W., van der Haar M., Kalicharan R., Hoekstra D. Transport of biosynthetic sphingolipids from Golgi to plasma membrane in HT29 cells: involvement of different carrier vesicle populations. Eur. J. Cell Biol. 1994;63:172–181. [PubMed] [Google Scholar]
- Barr V. A., Hubbard A. L. Newly synthesized hepatocyte plasma membrane proteins are transported in transcytotic vesicles in the bile duct-ligated rat. Gastroenterology. 1993;105:554–571. doi: 10.1016/0016-5085(93)90734-t. [DOI] [PubMed] [Google Scholar]
- Barroso M., Sztul E. S. Basolateral to apical transcytosis in polarized cells is indirect and involves BFA and trimeric G protein sensitive passage through the apical endosome. J. Cell Biol. 1994;124:83–100. doi: 10.1083/jcb.124.1.83. [DOI] [PMC free article] [PubMed] [Google Scholar]
- Bowers K., Levi B. P., Patel F. I., Stevens T. H. The sodium/proton exchanger Nhx1p is required for endosomal protein trafficking in the yeast Saccharomyces cerevisiae. Mol. Biol. Cell. 2000;11:4277–4294. doi: 10.1091/mbc.11.12.4277. [DOI] [PMC free article] [PubMed] [Google Scholar]
- Brett C. L., Wei Y., Donowitz M., Rao R. Human Na(+)/H(+) exchanger isoform 6 is found in recycling endosomes of cells, not in mitochondria. Am. J. Physiol. Cell Physiol. 2002;282:C1031–C1041. doi: 10.1152/ajpcell.00420.2001. [DOI] [PubMed] [Google Scholar]
- Brett C. L., Tukaye D. N., Mukherjee S., Rao R. The yeast endosomal Na+K+/H+ exchanger Nhx1 regulates cellular pH to control vesicle trafficking. Mol. Biol. Cell. 2005;16:1396–1405. doi: 10.1091/mbc.E04-11-0999. [DOI] [PMC free article] [PubMed] [Google Scholar]
- Cancino J., Torrealba C., Soza A., Yuseff M. I., Gravotta D., Henklein P., Rodriguez-Boulan E., González A. Antibody to AP1B adaptor blocks biosynthetic and recycling routes of basolateral proteins at recycling endosomes. Mol. Biol. Cell. 2007;18:4872–4884. doi: 10.1091/mbc.E07-06-0563. [DOI] [PMC free article] [PubMed] [Google Scholar]
- Erickson R. P., Larson-Thomé K., Valenzuela R. K., Whitaker S. E., Shub M. D. Navajo microvillous inclusion disease is due to a mutation in MYO5B. Am. J. Med. Genet. A. 2008;146A:3117–3119. doi: 10.1002/ajmg.a.32605. [DOI] [PubMed] [Google Scholar]
- Fölsch H., Ohno H., Bonifacino J. S., Mellman I. A novel clathrin adaptor complex mediates basolateral targeting in polarized epithelial cells. Cell. 1999;99:189–198. doi: 10.1016/s0092-8674(00)81650-5. [DOI] [PubMed] [Google Scholar]
- Gilfillan G. D., et al. SLC9A6 mutations cause X-linked mental retardation, microcephaly, epilepsy, and ataxia, a phenotype mimicking Angelman syndrome. Am. J. Hum. Genet. 2008;82:1003–1010. doi: 10.1016/j.ajhg.2008.01.013. [DOI] [PMC free article] [PubMed] [Google Scholar]
- Gravotta D., Deora A., Perret E., Oyanadel C., Soza A., Schreiner R., Gonzalez A., Rodriguez-Boulan E. AP1B sorts basolateral proteins in recycling and biosynthetic routes of MDCK cells. Proc. Natl. Acad. Sci. USA. 2007;104:1564–1569. doi: 10.1073/pnas.0610700104. [DOI] [PMC free article] [PubMed] [Google Scholar]
- Henkel J. R., Apodaca G., Altschuler Y., Hardy S., Weisz O. A. Selective perturbation of apical membrane traffic by expression of influenza M2, an acid-activated ion channel, in polarized Madin-Darby canine kidney cells. Mol. Biol. Cell. 1998;9:2477–2490. doi: 10.1091/mbc.9.9.2477. [DOI] [PMC free article] [PubMed] [Google Scholar]
- Hoekstra D., Tyteca D., Van IJzendoorn S. C. The subapical compartment: a traffic center in membrane polarity development. J. Cell Sci. 2004;117:2183–2192. doi: 10.1242/jcs.01217. [DOI] [PubMed] [Google Scholar]
- Kishimoto Y. A facile synthesis of ceramides. Chem. Phys. Lipids. 1975;15:33–36. doi: 10.1016/0009-3084(75)90029-8. [DOI] [PubMed] [Google Scholar]
- Mayor S., Sabharanjak S., Maxfield F. R. Cholesterol-dependent retention of GPI-anchored proteins in endosomes. EMBO J. 1998;17:4626–4638. doi: 10.1093/emboj/17.16.4626. [DOI] [PMC free article] [PubMed] [Google Scholar]
- Mukherjee S., Soe T. T., Maxfield F. R. Endocytic sorting of lipid analogues differing solely in the chemistry of their hydrophobic tails. J. Cell Biol. 1999;144:1271–1284. doi: 10.1083/jcb.144.6.1271. [DOI] [PMC free article] [PubMed] [Google Scholar]
- Müller T., et al. MYO5B mutations cause microvillus inclusion disease and disrupt epithelial cell polarity. Nat Genet. 2008;40:1163–1165. doi: 10.1038/ng.225. [DOI] [PubMed] [Google Scholar]
- Murtazina R., Booth B. J., Bullis B. L., Singh D. N., Fliegel L. Functional analysis of polar amino-acid residues in membrane associated regions of the NHE1 isoform of the mammalian Na+/H+ exchanger. Eur. J. Biochem. 2001;268:4674–4685. doi: 10.1046/j.1432-1327.2001.02391.x. [DOI] [PubMed] [Google Scholar]
- Nakamura N., Tanaka S., Teko Y., Mitsui K., Kanazawa H. Four Na+/H+ exchanger isoforms are distributed to Golgi and post-Golgi compartments and are involved in organelle pH regulation. J. Biol. Chem. 2005;280:1561–1572. doi: 10.1074/jbc.M410041200. [DOI] [PubMed] [Google Scholar]
- Nichols G. E., Shiraishi T., Young WW., Jr Polarity of neutral glycolipids, gangliosides, and sulfated lipids in MDCK epithelial cells. J. Lipid Res. 1988;29:1205–1213. [PubMed] [Google Scholar]
- Ohgaki R., Fukura N., Matsushita M., Mitsui K., Kanazawa H. Cell surface levels of organellar Na+/H+ exchanger isoform 6 are regulated by interaction with RACK1. J. Biol. Chem. 2008;283:4417–4429. doi: 10.1074/jbc.M705146200. [DOI] [PubMed] [Google Scholar]
- Oude Elferink R. P., Paulusma C. C. Function and pathophysiological importance of ABCB4 (MDR3 P-glycoprotein) Pflugers Arch. 2007;453:601–610. doi: 10.1007/s00424-006-0062-9. [DOI] [PubMed] [Google Scholar]
- Paladino S., Pocard T., Catino M. A., Zurzolo C. GPI-anchored proteins are directly targeted to the apical surface in fully polarized MDCK cells. J. Cell Biol. 2006;172:1023–1034. doi: 10.1083/jcb.200507116. [DOI] [PMC free article] [PubMed] [Google Scholar]
- Sato T., et al. The Rab8 GTPase regulates apical protein localization in intestinal cells. Nature. 2007;448:366–369. doi: 10.1038/nature05929. [DOI] [PubMed] [Google Scholar]
- Slimane T. A., Trugnan G., Van IJzendoorn S. C., Hoekstra D. Raft-mediated trafficking of apical resident proteins occurs in both direct and transcytotic pathways in polarized hepatic cells: role of distinct lipid microdomains. Mol. Biol. Cell. 2003;14:611–624. doi: 10.1091/mbc.E02-08-0528. [DOI] [PMC free article] [PubMed] [Google Scholar]
- Théard D., Steiner M., Kalicharan D., Hoekstra D., van Ijzendoorn S. C. Cell polarity development and protein trafficking in hepatocytes lacking E-cadherin/beta-catenin-based adherens junctions. Mol. Biol. Cell. 2007;18:2313–2321. doi: 10.1091/mbc.E06-11-1040. [DOI] [PMC free article] [PubMed] [Google Scholar]
- Tyteca D., van Ijzendoorn S. C., Hoekstra D. Calmodulin modulates hepatic membrane polarity by protein kinase C-sensitive steps in the basolateral endocytic pathway. Exp. Cell Res. 2005;310:293–302. doi: 10.1016/j.yexcr.2005.07.027. [DOI] [PubMed] [Google Scholar]
- van der Wouden J. M., van IJzendoorn S. C., Hoekstra D. Oncostatin M regulates membrane traffic and stimulates bile canalicular membrane biogenesis in HepG2 cells. EMBO J. 2002;21:6409–6418. doi: 10.1093/emboj/cdf629. [DOI] [PMC free article] [PubMed] [Google Scholar]
- van IJzendoorn S. C., Zegers M. M., Kok J. W., Hoekstra D. Segregation of glucosylceramide and sphingomyelin occurs in the apical to basolateral transcytotic route in HepG2 cells. J. Cell Biol. 1997;137:347–357. doi: 10.1083/jcb.137.2.347. [DOI] [PMC free article] [PubMed] [Google Scholar]
- van IJzendoorn S. C., Hoekstra D. (Glyco)sphingolipids are sorted in sub-apical compartments in HepG2 cells: a role for non-Golgi-related intracellular sites in the polarized distribution of (glyco)sphingolipids. J. Cell Biol. 1998;142:683–696. doi: 10.1083/jcb.142.3.683. [DOI] [PMC free article] [PubMed] [Google Scholar]
- van IJzendoorn S. C., Hoekstra D. The subapical compartment: a novel sorting centre? Trends Cell Biol. 1999;9:144–149. doi: 10.1016/s0962-8924(99)01512-3. [DOI] [PubMed] [Google Scholar]
- van IJzendoorn S. C., Hoekstra D. Polarized sphingolipid transport from the subapical compartment changes during cell polarity development. Mol. Biol. Cell. 2000;11:1093–1101. doi: 10.1091/mbc.11.3.1093. Mar. [DOI] [PMC free article] [PubMed] [Google Scholar]
- van IJzendoorn S. C., Théard D., Van Der Wouden J. M., Visser W., Wojtal K. A., Hoekstra D. Oncostatin M-stimulated apical plasma membrane biogenesis requires p27(Kip1)-regulated cell cycle dynamics. Mol. Biol. Cell. 2004;15:4105–4114. doi: 10.1091/mbc.E04-03-0201. [DOI] [PMC free article] [PubMed] [Google Scholar]
- van Meer G., Simons K. The function of tight junctions in maintaining differences in lipid composition between the apical and the basolateral cell surface domains of MDCK cells. EMBO J. 1986;5:1455–1464. doi: 10.1002/j.1460-2075.1986.tb04382.x. [DOI] [PMC free article] [PubMed] [Google Scholar]
- Wakabayashi Y., Dutt P., Lippincott-Schwartz J., Arias I. M. Rab11a and myosin Vb are required for bile canalicular formation in WIF-B9 cells. Proc. Natl. Acad. Sci. USA. 2005;102:15087–15092. doi: 10.1073/pnas.0503702102. [DOI] [PMC free article] [PubMed] [Google Scholar]
- Wang E., Brown P. S., Aroeti B., Chapin S. J., Mostov K. E., Dunn K. W. Apical and basolateral endocytic pathways of MDCK cells meet in acidic common endosomes distinct from a nearly-neutral apical recycling endosome. Traffic. 2000;1:480–493. doi: 10.1034/j.1600-0854.2000.010606.x. [DOI] [PubMed] [Google Scholar]
- Wojtal K. A., Hoekstra D., van Ijzendoorn S. C. Anchoring of protein kinase A-regulatory subunit IIalpha to subapically positioned centrosomes mediates apical bile canalicular lumen development in response to oncostatin M but not cAMP. Mol. Biol. Cell. 2007;18:2745–2754. doi: 10.1091/mbc.E06-08-0732. [DOI] [PMC free article] [PubMed] [Google Scholar]
- Zaal K. J., Kok J. W., Sormunen R., Eskelinen S., Hoekstra D. Intracellular sites involved in the biogenesis of bile canaliculi in hepatic cells. Eur. J. Cell Biol. 1994;63:10–19. [PubMed] [Google Scholar]
- Zegers M. M., Hoekstra D. Sphingolipid transport to the apical plasma membrane domain in human hepatoma cells is controlled by PKC and PKA activity: a correlation with cell polarity in HepG2 cells. J. Cell Biol. 1997;138:307–321. doi: 10.1083/jcb.138.2.307. [DOI] [PMC free article] [PubMed] [Google Scholar]
- Zegers M. M., Hoekstra D. Mechanisms and functional features of polarized membrane traffic in epithelial and hepatic cells. Biochem. J. 1998;336:257–269. doi: 10.1042/bj3360257. [DOI] [PMC free article] [PubMed] [Google Scholar]
Associated Data
This section collects any data citations, data availability statements, or supplementary materials included in this article.