

Abstract
BACKGROUND
Squamous cell carcinomas arising from various subsites within the head and neck (HNSCC), while histologically identical, have substantial differences in survival and recurrence rates. Controversy exists as to whether this reflects physical differences between subsites or fundamental molecular heterogeneity. In this study, we used two proteomic approaches to evaluate HNSCCs for differences in protein expression between oral cavity, oropharynx, larynx and hypopharynx subsites.
METHODS
A tissue microarray (TMA) was constructed consisting of 71 patients with HNSCC. This TMA was queried for expression of 4 cell- cycle and regulatory proteins chosen a priori for their known roles in cancer, using Automated Quantitative Analysis of protein expression (AQUA). Frozen tissue samples from 14 patients with histologically confirmed HNSCC were enriched for tumor and normal tissue by laser capture microdissection. Total protein was extracted, analyzed by 2D-difference gel electrophoresis (2D-DIGE) with saturation dye labeling, and evaluated for differential protein expression between subsites.
RESULTS
AQUA analysis revealed no difference between subsite for cyclin D1, p53, Rb, or p14 expression. The 2D-DIGE study was based on 28 gels (14 cancer, 14 adjacent normal) and 732 spots were identified as matching across >90% of gels. Statistical analysis detected no significant differences in protein expression between subsites.
CONCLUSIONS
Observed differences in outcomes between HNSCCs from different subsites may not reflect differences in tumor biology between subsites. Rather, it is possible that observed clinical heterogeneity among HNSCCs may be based on other factors, such as viral versus chemical carcinogenesis.
INTRODUCTION
Squamous cell carcinoma of the head and neck (HNSCC) represents 5% of newly diagnosed cancers in adult patients, with an annual incidence of more than 500,000 new cases worldwide 1. The overall five year survival rate for all cases is 64% 1, but it is a heterogeneous disease. Many factors, including disease stage, subsite, age, the presence of high risk type human papillomavirus, and other comorbidities, are important prognostic variables. Site of origin within the head and neck is among the most important of these. Five-year survival rates by site range from 91% (lip) to 69% (larynx) to 31% (hypopharynx) 1, 2. Controversy exists as to whether this reflects physical differences based on anatomic location and lymphatic drainage or fundamental molecular heterogeneity between subsites.
Anatomic differences have been proposed to underlie the clinical disparity observed between tumors arising from different head and neck subsites. Certain subsites such as the hypopharynx have increased vascularity and lymphatic drainage compared to other sites such as the glottic larynx 3, 4. This may predispose tumors arising from certain locations to early nodal and distant metastatic spread. In addition, tumors within some subsites are clinically evident at a much earlier stage than other subsites. Lip and most oral cavity cancers are amenable to direct inspection by any medical provider, and sometimes even the patient themselves. Thus it is possible that cancers in these locations are more likely to be diagnosed at an early stage, in contrast to cancers which arise at more distal sites. Examination of these locations often requires specialized examination skills (indirect mirror laryngoscopy, trans-nasal flexible fiberoptic exam, etc) for visualization. This make examination of these areas less accessible unless the patient is seen by a physician with these skills and instruments.
Similarly, cancers of the glottic larynx cause hoarseness as an early symptom, often prompting early evaluation. Early stage (TNM I/II) HNSCC carries a far better prognosis than does advanced stage (III/IV) disease: 5-year survival rates are approximately 75% for stage I/II disease but are less than 30% for stage III/IV disease 5-7.
Alternately, it has been suggested that fundamental differences in molecular mechanisms underlying cancer progression account for differences in outcome between head and neck subsites. Differential expression of EGFR, cyclin D1 and MMP2 have been reported by several investigators between different tumor subsites 8-12. However, other studies have found no molecular differences in p53, cyclin D1, p21, VEGF or Rb between HNSCCs from differing subsites 13, 14. It is unclear to what extent differences in patient populations or methodologies may explain the conflicting results.
Quantitative proteomic profiling affords one approach to determine if molecular differences exist between subsites. We sought to determine if molecular differences in protein expression exist between HNSCC arising from different subsites. We used two methods to assess differences in protein expression: Automated Quantitative Analysis of protein expression (AQUA) and 2D-difference gel electrophoresis (2D-DIGE). For the AQUA study, we used antibodies for p14, cyclin D1, pRb, and p53, as previous analyses with these proteins have been inconclusive 10-14. AQUA allows quantitative determination of protein expression while preserving subcellular localization information. In the 2D-DIGE study, we used laser capture microdissection (LCM) to isolate pure lesional tissue, followed by saturation dye labeling and 2D-difference gel electrophoresis (2D-DIGE) to obtain protein profiles from as little as 1 μg of total protein, a procedure validated previously where sample abundance was limiting 15-20. Proteins of interest are defined using purely statistical criteria, without requiring or using any prior knowledge about their biological function. The two approaches are complementary, and in this study we used both to address whether tumors from different subsites within the head and neck differ in their molecular characteristics.
METHODS
Patient selection
The tissue microarray (TMA) cohort was assembled from patients with primary squamous cell cancer treated at Yale-New Haven hospital between 1992 and 1999 enrolled in a prospective, randomized clinical trial 21. Patients were treated with primary external beam radiotherapy (EBRT) ± a radiation sensitizer (porfiromycin or mitomycin c). Exclusion criteria from the TMA cohort were presentation with metastatic disease, paranasal sinus cancers, non-squamous cell histology, lack of available archival tissue, and failure to receive a full course of radiation therapy. Patients included in the 2D-DIGE cohort were drawn from a prospectively collected cohort of patients with histologically confirmed HNSCC treated at the Medical College of Georgia from 2004 to 2007 who enrolled in a voluntary tissue / tumor banking registry. All patients with available matching tumor and adjacent histologically normal frozen tissue at study inception were included. Complete demographic and treatment information was maintained for all patients included in the registry. All biopsy specimens for both cohorts were obtained pre- chemotherapy and/or radiotherapy.
AQUA methods
The tissue microarray (TMA) was constructed as described and included 71 cases 22. Pilot sections from archival paraffin-embedded formalin-fixed tissue blocks were hematoxylin/eosin stained and reviewed by a pathologist to select areas of invasive tumor. Cores were taken using 0.6 mm2 blunt-tip needles and placed on the recipient microarray block using a Tissue Microarrayer (Beecher Instrument, Silver Spring, MD). Tumors were represented with twofold redundancy, which has been shown to provide a sufficiently representative sample 23-25. 5-μm sections were placed on glass slides using an adhesive tape transfer system (Instrumedics, Inc., Hackensack, NJ) with UV cross-linking. Tissue microarray slides were deparaffinized with xylene followed by ethanol, rehydrated, and processed for antigen retrieval by pressure cooking in 0.1M citrate buffer, pH 6.0. Slides were incubated in 0.3% hydrogen peroxide in methanol for 30 min to block endogenous peroxidase, followed by 0.3% bovine serum albumin (BSA) for 30 min at room temperature to block nonspecific antibody binding. Slides were incubated separately with the following mouse monoclonal primary antibodies at 4 °C overnight: anti-p14, US Biological L4050705; anti-cyclin D1, Abcam ab6152; anti-Rb, Neomarkers 1F8; anti-p53, DAKO clone DO7. Slides were incubated with goat anti-mouse secondary antibody conjugated to a horseradish peroxidase-decorated dextran polymer backbone (Envision; DAKO Corp.) for one hour at room temperature. Tumor cells were identified by use of anti-cytokeratin antibody cocktail (rabbit anti-pancytokeratin antibody z0622; DAKO Corp.) with subsequent goat anti-rabbit antibody conjugated to Alexa546 fluorophore (A11035, Molecular Probes). Nuclei were counterstained with 4’, 6-diamidino-2-phenylindole (DAPI). Target antigens were visualized with a fluorescent chromogen (Cy5-tyramide; Perkin Elmer Corporation). Slides were mounted with a polyvinyl alcohol-containing aqueous mounting media with antifade reagent (n-propyl gallate, Acros Organics).
AQUA was performed as described 26. Monochromatic, 1024 × 1024 pixel, 0.5 μm resolution images were obtained of each histospot using filter cubes specific to the emission/excitation spectra of DAPI (358/461nm), Alexa 546 (556/573nm), and Cy5 (650/670nm) (Optical Analysis, New Hampshire). Tumor and stroma were distinguished by creating a cytokeratin mask based on the Alexa 546 signal, and a tumor nuclei-specific compartment was defined using DAPI signal within the previously defined tumor mask. Overlapping pixels (to a 99% confidence interval) were excluded from the nuclear compartment.
AQUA score was expressed on a normalized scale of pixel intensity divided by target area (tumor nuclei compartment). Duplicates were averaged, and scores across subsites were compared by non-parametric Kruskal-Wallis test 27. Comparisons with clinical and pathological variables gender, ethnicity, TNM stage, histologic grade, head and neck subsite was made using nonparametric Wilcoxon rank sums test (for dichotomous variables) and Kruskal-Wallis test (for 3+ categorical variables) 27, 28. Nuclear protein expression for p14, cyclin D1, Rb and p53 (by AQUA) was compared by non-parametric Spearman correlation coefficient 29. All calculations and analyses were performed with SPSS 11.5 (SPSS inc., Chicago IL).
Laser Capture Microdissection and 2D-Difference gel electrophoresis
Frozen sections (5 μm) were stained briefly with Nuclear Fast Red and LCM was performed using an Arcturus PixCell IIe microscope as described 18. Caps with polymer film and adherent cells were placed onto a microcentrifuge tube containing lysis buffer (7 M urea, 2 M thiourea, 4% CHAPS, 0.4 mM AEBSF (protease inhibitor), 40 mM Tris-HCl pH 8, 5 mM Mg(OAc)2). Tubes were inverted to wet the polymer film and incubated for 30 min at room temperature. The resulting extracts were sonicated five times for 30 sec each and centrifuged at 14,000 g for 15 min, and the supernatant was transferred to a fresh tube. Protein concentration was assayed using the 2D-Quant Kit (GE Healthcare). Tris-(2-carboxyethyl)-phosphine (TCEP) was added (0.4 nmol), and the mixture was incubated 1 h at 37° C. Cy5 sulfhydryl-reactive dye was added (0.8 nmol, GE Healthcare, Buckinghamshire, UK) and incubation was continued for 30 min at 37° C. The reaction was terminated by addition of an equal volume of 2X sample buffer (7 M urea, 2 M thiourea, 4% CHAPS, 130 mM dithiothreitol, 2% ampholytes). After 15 min at 4° C, the sample was diluted to a final volume of 450 μl with rehydration buffer (7 M urea, 2 M thiourea, 4% CHAPS, 13 mM dithiothreitol, 1% ampholytes). A mixed internal standard was prepared by combining an aliquot of protein lysate from each sample. This mixture was saturation-labeled with Cy3 using the same ratio of dye and TCEP to protein as for the Cy5-labeled samples. Samples were stored frozen at -80 °C until use.
A mixture of Cy5-labeled sample and Cy3-labeled internal standard was loaded into a 24 cm strip holder containing a pH 3-10 nonlinear IPG strip and overlaid with Immobiline DryStrip Cover Fluid (GE Healthcare). Rehydration was carried out for 15 h at 20° C with an applied electric field of 30 V. For first-dimension electrophoresis, electric potentials of 500 V for 1 h, 1000 V for 2 h, and 8000 V for 7 h were applied. The strip was removed and equilibrated twice in 6 M urea, 100 mM Tris-HCl pH 8, 2% SDS, 32.5 mM dithiothreitol, and 30% glycerol for 15 min at room temperature. The strip was applied to the top of a 12.5% SDS gel (25 cm × 20 cm × 0.1 cm), and electrophoresis was performed using 10 mA per gel overnight. The gel was removed and scanned separately for Cy5 and Cy3 fluorescence using a GE Healthcare Typhoon 9400 Series Variable Imager.
Spots were defined using the GE Healthcare DeCyder software package and matched across all gels. Intensity data were log transformed and normalized such that the mean log spot intensities in the Cy5 and Cy3 images of each gel were equal. We calculated an internal ratio (IR) of the normalized volume of each spot in the experimental sample versus the volume of the same spot in the internal standard:
where, S(i,j) is the normalized volume of sample spot i on gel j, and IS(i,j) is the normalized volume of the corresponding internal standard. This internal ratio is a measure of relative protein abundance in the sample and can be used as the basis for between-sample comparisons. Candidate biomarkers were identified and ranked using the ln(IR)(i,j) values as input for a Significance Analysis of Microarrays (SAM, version 3.0, available at http://www-stat.stanford.edu/~tibs/SAM/). For each spot, the SAM analysis provides a relative difference score, d(i), that is calculated based on the average difference between groups divided by the sum of the spot-specific scatter (variance) and a measure of scatter (variance) common to all proteins 30. The false discovery rate (FDR) for each spot is calculated based on permutations of the data 31. Cancer and normal tissue samples from the same location were taken from the same patient resulting in paired data within each cancer location. As such, all comparisons involving cancer versus normal tissue used paired analyses, while comparison of cancer locations used unpaired analyses. Data were further analyzed with the DeCyder Extended Data Analysis (EDA) software to perform a principal component analysis and hierarchical clustering using average linkage.
RESULTS
Patient Demographics
In the AQUA cohort, there were 71 patients that met criteria and were included in the TMA. There were 59 males and 12 females with age at diagnosis ranging from 36 to 76 years. In the LCM/2D-DIGE cohort there were 14 patients. There were 7 males and 7 females with age at diagnosis ranging from 45 to 74 years. In both cohorts, patients were classified by gender, primary subsite, tumor-node-metastasis (TNM) stage, histologic grade, tumor type (recurrent versus primary) and management (Table 1).
Table 1.
Demographic, clinical and pathologic data.
| 2D-DIGE Cohort | TMA Cohort | ||
|---|---|---|---|
| Gender | Male | 7 | 59 |
| Female | 7 | 12 | |
| Primary Subsite | Oral Cavity | 7 | 23 |
| Oropharynx | 3 | 13 | |
| Larynx | 4 | 16 | |
| Hypopharynx | n/a | 10 | |
| Unknown Primary | n/a | 9 | |
| TNM stage | I/II | 3 | 7 |
| II/IV | 11 | 61 | |
| Gradeˆ | Well differentiated | 0 | 5 |
| Moderately diff. | 8 | 34 | |
| Poorly diff. | 6 | 7 | |
| Tumor Type | Primary | 14 | 68 |
| Recurrent | 0 | 3 | |
| Management | Primary radiotherapy | 5 | 71 |
| Post-op radiotherapy | 7 | 0 | |
| Chemotherapy | 5 | 51 | |
| No chemotherapy | 9 | 20 | |
= 25 patients histologic grade not recorded.
AQUA Quantitative Protein Expression Analysis
AQUA was performed as described in Materials and Methods using antibodies to p14, cyclin D1, Rb and p53. For each antibody, scores were reported as the mean of two duplicate histospots, colocalized to the nuclear subcellular compartment. There was considerable inter-individual variation (median coefficient of variation) but no obvious difference between subsites. To explore more thoroughly whether there were any significant differences, protein expression scores were compared between subsites by nonparametric Kruskal-Wallis test. There was no significant difference between subsites for any of the examined proteins (p>0.50, Figure 1 and Table 2). Similar results were obtained after removing the unknown primary patients from the analysis (data not shown).
Figure 1. Protein expression between subsites.
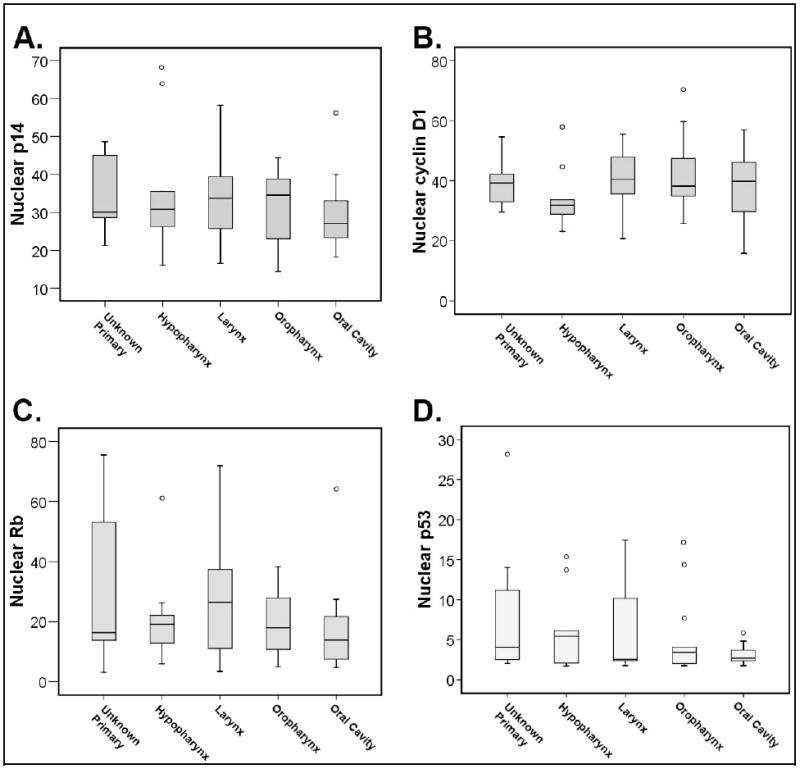
Nuclear expression of cell cycle control proteins was compared by anatomic subsite within the head and neck. There were no significant differences in panels A-D when stratified by subsite.
Table 2.
Cell cycle control protein expression by AQUA analysis.
| Median AQUA score (Interquartile Range) | ||||
|---|---|---|---|---|
| Subsite | p14 | cyclin D1 | Rb | p53 |
| All sites | 30.0 (14.6) | 38.4 (13.7) | 18.0 (21.1) | 2.8 (3.6) |
| Unknown Primary | 30.1 (18.0) | 39.2 (13.1) | 16.4 (43.7) | 4.1 (10.1) |
| Oral Cavity | 27.0 (10.6) | 39.8 (17.2) | 13.9 (14.5) | 2.7 (1.4) |
| Oropharynx | 34.6 (18.5) | 38.2 (17.0) | 18.0 (20.4) | 3.4 (3.9) |
| Larynx | 33.7 (14.9) | 40.4 (13.9) | 26.5 (29.3) | 2.6 (7.9) |
| Hypopharynx | 30.8 (25.7) | 31.8 (10.6) | 19.1 (13.8) | 5.4 (7.9) |
Secondary analysis was performed to correlate AQUA scores for each protein with pathologic and demographic variables, and between AQUA scores. There was a significant positive correlation between nuclear p14 (p=0.03) and Rb (p=0.04) expression and advanced (stage 3 or 4) disease. Poorly differentiated tumors had elevated p53 levels compared to well or moderately differentiated tumors (p=0.02). There was a significant correlation between p14 and cyclin D1 (p<0.001), Rb (p=0.012) and p53 (p=0.003) expression, and between cyclin D1 and Rb (p=0.004) expression by AQUA. There were no other significant correlations between proteins. Figure 2 presents graphical scatterplot representations of nuclear protein expression correlations.
Figure 2. Protein expression correlation by AQUA.
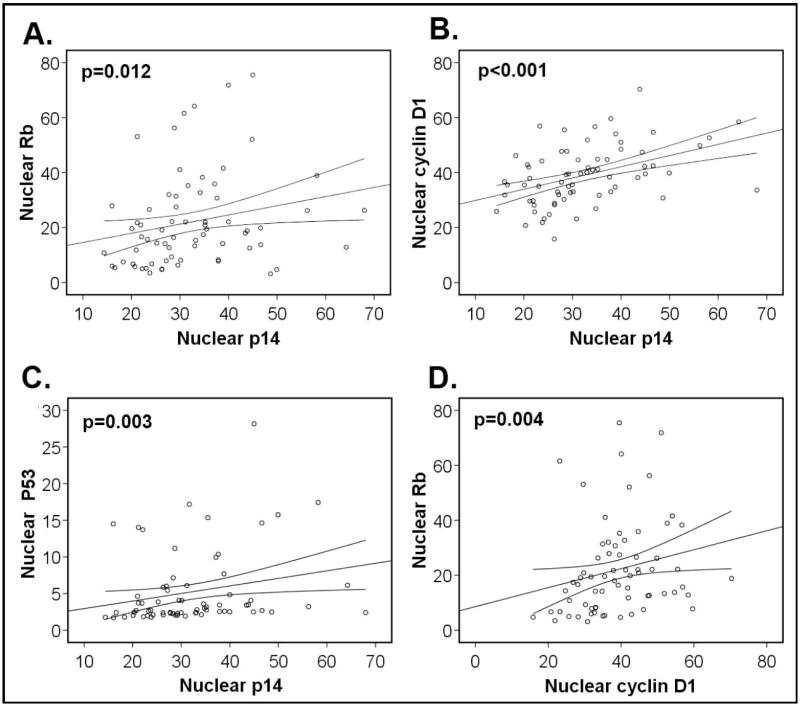
Nuclear expression of cell cycle control proteins was correlated by Spearman correlation. Significant correlations are shown for p14 and Rb, cyclin D1 and p53 as well as between Rb and cyclin D1. Lines represent correlation plot with 95% confidence intervals.
LCM/2D-DIGE analysis
To expand the search for differences in protein expression patterns between subsites, we performed large-scale proteomic profiling. A second cohort was identified for which matched tumor and adjacent normal frozen tissue was available, as proteomic profiling by LCM/2D-DIGE analysis cannot be performed with fixed specimens. Pure cell samples from lesional tissue were obtained by LCM as described in Materials and Methods. Figure 3 depicts tissue sections before and after LCM enrichment, as well as a representative 2D gel which demonstrates the ability of the procedure to separate individual proteins in two dimensions. Approximately 5,000 cells for each sample were captured. For quantitative analysis, proteins from 28 samples (14 cancer and 14 matched normal) were extracted, labeled, and analyzed by 2D-DIGE. An average of 2156 spots was identified by the DeCyder software on each gel. Of these, an average of 1310 was matched to the master spot map. From this group of spots, manual inspection revealed that 732 spots were unequivocally present on >90% of gels. We determined an expression level for each spot in each gel with reference to the invariant internal standard (see Material and Methods).
Figure 3. LCM and 2D-DIGE.

Panels A-E illustrate the process of LCM. Panel A is the hematoxylin and eosin stained pilot section. B shows the nuclear fast red stained sample prior to LCM. In C, the black circles indicate areas where the laser has impacted the tissue. D shows the leftover tissue that remains on the slide. E shows the captured tissue. Panel F shows a representative merged image of a 2D gel. Proteins from the captured tissue (tumor labeled with Cy5 and shown in red, mixed internal standard labeled with Cy3 and shown in green) are separated based on isoelectric point and molecular weight. Proteins more abundant in the mixed internal standard are green, proteins more abundant in cancer are red and equally expressed proteins are yellow.
The internal ratio values were used as input data for a Significance Analysis of Microarray (SAM) calculation, which was performed as described in Materials and Methods. We performed a multiclass SAM analysis based on the difference of cancer and patient-matched normal expression values for each spot. There were no significant differences by subsite based on a cutoff value of FDR<10% (data not shown). We performed an additional multiclass SAM analysis based on the sum of the cancer and normal expression values for each spot. This analysis was designed to detect differences based on the anatomical location from which the tissue was derived irrespective of whether it was cancerous. There were again no significant differences detected between subsites.
To demonstrate that the analytical methods were sensitive and appropriate, we performed a paired analysis of all cancers and all normal, regardless of subsite. Results are plotted in Fig. 4A. Spots that fall outside the parallel diagonal lines are ranked as potentially significant, defined in this case as having an estimated false discovery probability of less than 10%. As expected, many significant differences were detected. There were 348/732 proteins (47.5%) that showed significant differences applying a FDR=10%, and 129/732 (17.6%) remained significant at a more stringent FDR=0. By contrast, pair-wise comparisons of cancers by subsite (laryngeal cancer versus oral cancer, laryngeal cancer versus oropharyngeal cancer, and oropharyngeal cancer versus oral cancer; Fig. 4B, 4C, 4D showed no proteins that met the threshold for significance.
Figure 4. SAM plotsheets.
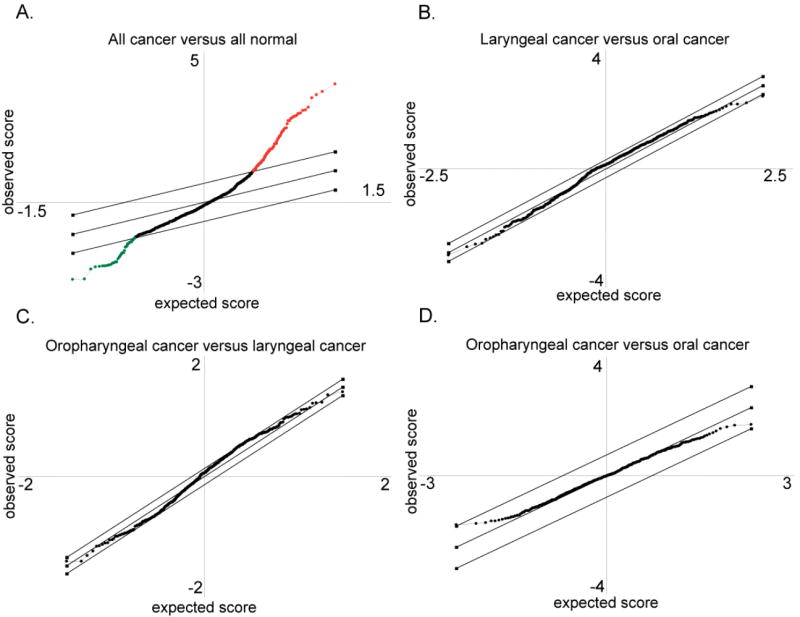
These panels depict the graphical representation of the SAM analysis. The diagonal lines delineate the bounds for normal variation. Circles that are outside the lines represent proteins that are differentially expressed between samples, with either increased abundance in normal (red), or increased abundance in cancer (green), as in panel A, a comparison of normal and cancer. Circles within the lines represent proteins that are not significantly different in the comparison, as in panels B, C, and D, representing the comparisons between laryngeal versus oral cancer, oropharyngeal versus laryngeal cancer, and oropharyngeal versus oral cancer, respectively.
A secondary analysis was performed by hierarchical clustering and principal component analysis using DeCyder EDA software. A heat map (Figure 5A) depicts relative abundance of each protein in each sample using a color scale, with samples grouped using a hierarchical clustering algorithm. Cancer and normal samples clustered spontaneously in two groups, but within these groups, specimens did not cluster by anatomical subsite. A similar conclusion is reached by principal component analyses (Figure 5B). Cancer and normal specimens each formed discrete clusters, whereas anatomic subsites were intermingled.
Figure 5. Heat map and principal component analysis.
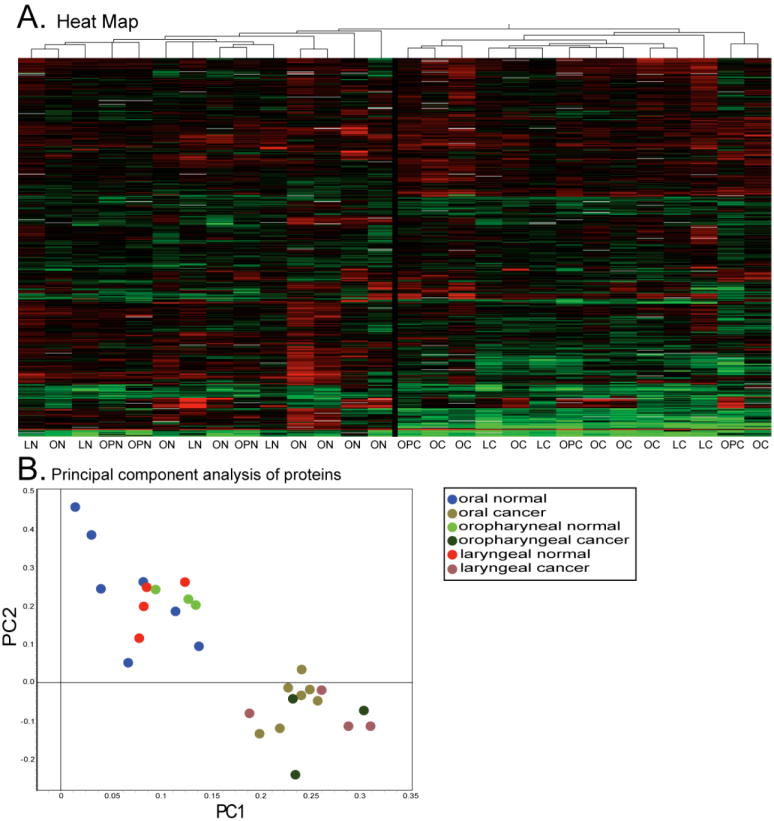
Panel A is a heat map representing the 732 proteins present on >90% of all gels. LN=Laryngeal Normal, LC=Laryngeal Cancer, ON=Oral Normal, OC=Oral Cancer, OPN=Oropharyngeal Normal, OPC=Oropharyngeal Cancer. The black line in the middle indicates separation of cancer and normal. B. Principal Component Analysis derived from the expression levels of the same 732 proteins.
DISCUSSION
It is well established that HNSCCs from different subsites, although histologically identical, differ in survival and recurrence rates 5. One hypothesis to explain this observation is that there are characteristic molecular alterations particular to tumors arising at different subsites. If so, these should be detectable by proteomic profiling. In the present study we applied two complementary, quantitative profiling methods. AQUA is an antibody-based approach that allows measurement of a predetermined set of markers while preserving spatial information. 2D-DIGE is a biochemical approach based on separation and quantification of proteins without prior assumptions about which proteins are likely to be important in a given biological process. We found no significant differences at the proteomic level when HNSCCs arising at different anatomical subsites were compared.
Prior studies have provided conflicting evidence whether there are fundamentally different molecular mechanisms underlying cancer progression in varying subsites within the head and neck. An early study of Takes et al. examined three of the same markers characterized here, cyclin D1, p53, and Rb 10. These authors reported that cyclin D1 was elevated in pharyngeal cancer compared to other subsites, whereas differences in the other markers were not significant. Consistent with this cyclin D1 finding, two studies by Freier et al reported that cyclin D1 protein was elevated in pharyngeal and laryngeal cancers and that the corresponding CCND1 locus was amplified in pharyngeal cancer, relative to other sites 11, 12. By contrast, Huang et al. showed that, although the CCND1 locus was often amplified in HNSCC, there were no significant differences between subsites 13. Similarly, Volavsek et. al. reported no differences in p53, cyclin D1, p21, or Rb levels between cancers of the hypopharynx and larynx subsites 14. Our immunohistochemistry data, acquired using the AQUA methodology, agree with the latter two studies.
It is possible that methodological differences or limitations play some role in explaining the differences between studies, for example the use of AQUA versus other scoring methodologies for immunohistochemistry, or the analysis of microdissected tissue versus bulk specimens. AQUA has proven useful, however, for detecting prognostically important biomarkers, as well as for performing high-throughput pathway analysis 34-36. It is possible, however, that differences by subsite in other proteins not examined here could exist. Similarly, 2D-DIGE is only able to sample a small portion of the expressed proteins in a human cell (<1% based on a proteome size of 1×10⁵ or more) 37. Several authors have demonstrated that the combined LCM/2D-DIGE technique used in the current study is sensitive enough to discern subtle differences between similar groups, such as between cancer stages or subtypes (refs 18, 38; see also H. Arnouk, M.M., J.R.L., R.P., W.S.D., et al. submitted).
Our finding of no systematic difference between HNSCCs from various subsites within the head and neck should not be taken to imply a lack of heterogeneity among HNSCCs. By AQUA analysis we found a large median coefficient of variance for each cell cycle protein studied, demonstrating considerable inherent biologic diversity within HNSCCs. There is no a priori reason why similar aerodigestive mucosal surfaces should have fundamentally different carcinogenic pathways based only on anatomic subsite designation, anymore than a basal cell carcinoma (BCC) of the cheek should be molecularly distinct from a BCC arising on the arm. Instead, we propose that observed heterogeneity may reflect divergent etiologic pathways irrespective of subsite.
Acknowledgments
This work was supported by NIH R33 CA95941(WSD) and CORE Resident Research Grant, American Academy of Otolaryngology / Head and Neck Surgery (PMW)
Footnotes
Selected for Resident Research Award (second place); American Academy of Otolaryngology / Head and Neck Surgery 2008 Annual Meeting. Accepted for Oral Presentation (Abstract RF137)
Contributor Information
Paul M. Weinberger, Department of Otolaryngology, Medical College of Georgia, Augusta, Georgia.
Mark Merkley, Institute for Molecular Medicine and Genetics, Medical College of Georgia, Augusta, Georgia.
Jeffrey R. Lee, Institute for Molecular Medicine and Genetics, Medical College of Georgia, Augusta, Georgia Department of Pathology, Medical College of Georgia, Augusta, Georgia; Charlie Norwood VA Medical Center, Augusta, Georgia.
Bao-Ling Adam, Center for Biotechnology and Genomic Medicine, Medical College of Georgia, Augusta, Georgia
Christine G. Gourin, Department of Otolaryngology, Medical College of Georgia, Augusta, Georgia
Robert H. Podolsky, Center for Biotechnology and Genomic Medicine, Medical College of Georgia, Augusta, Georgia
Bruce G. Haffty, Department of Radiation Oncology, UMDNJ-Robert Wood Johnson Medical School, New Haven, Connecticut
Evangelia Papadavid, Department of Medical Oncology, Yale University, New Haven, Connecticut
Clarence Sasaki, Department of Otolaryngology, Yale University, New Haven, Connecticut
Amanda Psyrri, Department of Medical Oncology, Yale University, New Haven, Connecticut
William S. Dynan, Institute for Molecular Medicine and Genetics, Medical College of Georgia, Augusta, Georgia.
References
- 1.Landis SH, Murray T, Bolden S, Wingo PA. Cancer statistics, 1999. CA Cancer J Clin. 1999 Jan-Feb;49(1):8–31. 31. doi: 10.3322/canjclin.49.1.8. [DOI] [PubMed] [Google Scholar]
- 2.Sasaki CT, Jassin B. Cancer of the pharynx and larynx. Am J Med. 2001 Dec 3;111(Suppl 8A):118S–123S. doi: 10.1016/s0002-9343(01)00850-6. [DOI] [PubMed] [Google Scholar]
- 3.De Vita VT, H S, Rosenberg SA, editors. Cancers of the larynx and hypopharynx. 5. New York: Lippincott-Raven; 1997. [Google Scholar]; Sessions RB, H L, Forastiere AA, editors. Cancer, principles and practice of oncology. [Google Scholar]
- 4.Werner JA, Dunne AA, Myers JN. Functional anatomy of the lymphatic drainage system of the upper aerodigestive tract and its role in metastasis of squamous cell carcinoma. Head Neck. 2003 Apr;25(4):322–332. doi: 10.1002/hed.10257. [DOI] [PubMed] [Google Scholar]
- 5.Hoffman HT, Karnell LH, Funk GF, Robinson RA, Menck HR. The National Cancer Data Base report on cancer of the head and neck. Arch Otolaryngol Head Neck Surg. 1998 Sep;124(9):951–962. doi: 10.1001/archotol.124.9.951. [DOI] [PubMed] [Google Scholar]
- 6.Al-Sarraf M. Treatment of locally advanced head and neck cancer: historical and critical review. Cancer Control. 2002 Sep-Oct;9(5):387–399. doi: 10.1177/107327480200900504. [DOI] [PubMed] [Google Scholar]
- 7.Goodwin WJ, Thomas GR, Parker DF, et al. Unequal burden of head and neck cancer in the United States. Head Neck. 2007 Oct 30; doi: 10.1002/hed.20710. [DOI] [PubMed] [Google Scholar]
- 8.Repassy G, Forster-Horvath C, Juhasz A, Adany R, Tamassy A, Timar J. Expression of invasion markers CD44v6/v3, NM23 and MMP2 in laryngeal and hypopharyngeal carcinoma. Pathol Oncol Res. 1998;4(1):14–21. doi: 10.1007/BF02904689. [DOI] [PubMed] [Google Scholar]
- 9.Lukits J, Timar J, Juhasz A, Dome B, Paku S, Repassy G. Progression difference between cancers of the larynx and hypopharynx is not due to tumor size and vascularization. Otolaryngol Head Neck Surg. 2001 Jul;125(1):18–22. doi: 10.1067/mhn.2001.116187. [DOI] [PubMed] [Google Scholar]
- 10.Takes RP, Baatenburg de Jong RJ, Schuuring E, Litvinov SV, Hermans J, Van Krieken JH. Differences in expression of oncogenes and tumor suppressor genes in different sites of head and neck squamous cell. Anticancer Res. 1998 Nov-Dec;18(6B):4793–4800. [PubMed] [Google Scholar]
- 11.Freier K, Joos S, Flechtenmacher C, et al. Tissue microarray analysis reveals site-specific prevalence of oncogene amplifications in head and neck squamous cell carcinoma. Cancer Res. 2003 Mar 15;63(6):1179–1182. [PubMed] [Google Scholar]
- 12.Freier K, Bosch FX, Flechtenmacher C, et al. Distinct site-specific oncoprotein overexpression in head and neck squamous cell carcinoma: a tissue microarray analysis. Anticancer Res. 2003 Sep-Oct;23(5A):3971–3977. [PubMed] [Google Scholar]
- 13.Huang Q, Yu GP, McCormick SA, et al. Genetic differences detected by comparative genomic hybridization in head and neck squamous cell carcinomas from different tumor sites: construction of oncogenetic trees for tumor progression. Genes Chromosomes Cancer. 2002 Jun;34(2):224–233. doi: 10.1002/gcc.10062. [DOI] [PubMed] [Google Scholar]
- 14.Volavsek M, Bracko M, Gale N. Distribution and prognostic significance of cell cycle proteins in squamous carcinoma of the larynx, hypopharynx and adjacent epithelial hyperplastic lesions. J Laryngol Otol. 2003 Apr;117(4):286–293. doi: 10.1258/00222150360600896. [DOI] [PubMed] [Google Scholar]
- 15.Shaw J, Rowlinson R, Nickson J, et al. Evaluation of saturation labelling two-dimensional difference gel electrophoresis fluorescent dyes. Proteomics. 2003 Jul;3(7):1181–1195. doi: 10.1002/pmic.200300439. [DOI] [PubMed] [Google Scholar]
- 16.Sitek B, Luttges J, Marcus K, et al. Application of fluorescence difference gel electrophoresis saturation labelling for the analysis of microdissected precursor lesions of pancreatic ductal adenocarcinoma. Proteomics. 2005 Jul;5(10):2665–2679. doi: 10.1002/pmic.200401298. [DOI] [PubMed] [Google Scholar]
- 17.Wilson KE, Marouga R, Prime JE, et al. Comparative proteomic analysis using samples obtained with laser microdissection and saturation dye labelling. Proteomics. 2005 Oct;5(15):3851–3858. doi: 10.1002/pmic.200401255. [DOI] [PubMed] [Google Scholar]
- 18.Greengauz-Roberts O, Stoppler H, Nomura S, et al. Saturation labeling with cysteine-reactive cyanine fluorescent dyes provides increased sensitivity for protein expression profiling of laser-microdissected clinical specimens. Proteomics. 2005 May;5(7):1746–1757. doi: 10.1002/pmic.200401068. [DOI] [PubMed] [Google Scholar]
- 19.Shekouh AR, Thompson CC, Prime W, et al. Application of laser capture microdissection combined with two-dimensional electrophoresis for the discovery of differentially regulated proteins in pancreatic ductal adenocarcinoma. Proteomics. 2003 Oct;3(10):1988–2001. doi: 10.1002/pmic.200300466. [DOI] [PubMed] [Google Scholar]
- 20.Kondo T, Seike M, Mori Y, Fujii K, Yamada T, Hirohashi S. Application of sensitive fluorescent dyes in linkage of laser microdissection and two-dimensional gel electrophoresis as a cancer proteomic study tool. Proteomics. 2003 Sep;3(9):1758–1766. doi: 10.1002/pmic.200300531. [DOI] [PubMed] [Google Scholar]
- 21.Haffty BG, Wilson LD, Son YH, et al. Concurrent chemo-radiotherapy with mitomycin C compared with porfiromycin in squamous cell cancer of the head and neck: final results of a randomized clinical trial. Int J Radiat Oncol Biol Phys. 2005 Jan 1;61(1):119–128. doi: 10.1016/j.ijrobp.2004.07.730. [DOI] [PubMed] [Google Scholar]
- 22.Rimm DL, Camp RL, Charette LA, Costa J, Olsen DA, Reiss M. Tissue microarray: a new technology for amplification of tissue resources. Cancer J. 2001 Jan-Feb;7(1):24–31. [PubMed] [Google Scholar]
- 23.Hoos A, Cordon-Cardo C. Tissue microarray profiling of cancer specimens and cell lines: opportunities and limitations. Lab Invest. 2001 Oct;81(10):1331–1338. doi: 10.1038/labinvest.3780347. [DOI] [PubMed] [Google Scholar]
- 24.Camp RL, Charette LA, Rimm DL. Validation of tissue microarray technology in breast carcinoma. Lab Invest. 2000 Dec;80(12):1943–1949. doi: 10.1038/labinvest.3780204. [DOI] [PubMed] [Google Scholar]
- 25.Fernebro E, Dictor M, Bendahl PO, Ferno M, Nilbert M. Evaluation of the tissue microarray technique for immunohistochemical analysis in rectal cancer. Arch Pathol Lab Med. 2002 Jun;126(6):702–705. doi: 10.5858/2002-126-0702-EOTTMT. [DOI] [PubMed] [Google Scholar]
- 26.Camp RL, Chung GG, Rimm DL. Automated subcellular localization and quantification of protein expression in tissue microarrays. Nat Med. 2002 Nov;8(11):1323–1327. doi: 10.1038/nm791. [DOI] [PubMed] [Google Scholar]
- 27.Kruskal WH, Wallis WA. Use of ranks in one-criterion variance analysis. J Am Stat Assoc. 1952 Dec 1;47(260):583–621. [Google Scholar]
- 28.Wilcoxon F. Individual Comparisons by Ranking Methods. Biometrics Bulletin. 1945;1:80–83. [Google Scholar]
- 29.Spearman C. Demonstration of Formulae for True Measurement of Correlation. Am J Psychol. 1907 April;18(2):161–169. [Google Scholar]
- 30.Tusher VG, Tibshirani R, Chu G. Significance analysis of microarrays applied to the ionizing radiation response. Proc Natl Acad Sci U S A. 2001 Apr 24;98(9):5116–5121. doi: 10.1073/pnas.091062498. [DOI] [PMC free article] [PubMed] [Google Scholar]
- 31.Karp NA, McCormick PS, Russell MR, Lilley KS. Experimental and statistical considerations to avoid false conclusions in proteomic studies using differential in-gel electrophoresis. Mol Cell Proteomics. 2007 Aug;6(8):1354–1364. doi: 10.1074/mcp.M600274-MCP200. [DOI] [PubMed] [Google Scholar]
- 32.Ragin CC, Modugno F, Gollin SM. The epidemiology and risk factors of head and neck cancer: a focus on human papillomavirus. J Dent Res. 2007 Feb;86(2):104–114. doi: 10.1177/154405910708600202. [DOI] [PubMed] [Google Scholar]
- 33.Herrero R, Castellsague X, Pawlita M, et al. Human papillomavirus and oral cancer: the International Agency for Research on Cancer multicenter study. J Natl Cancer Inst. 2003 Dec 3;95(23):1772–1783. doi: 10.1093/jnci/djg107. [DOI] [PubMed] [Google Scholar]
- 34.Psyrri A, Bamias A, Yu Z, et al. Subcellular localization and protein levels of cyclin-dependent kinase inhibitor p27 independently predict for survival in epithelial ovarian cancer. Clin Cancer Res. 2005 Dec 1;11(23):8384–8390. doi: 10.1158/1078-0432.CCR-05-1270. [DOI] [PubMed] [Google Scholar]
- 35.Yu Z, Weinberger PM, Haffty BG, et al. Cyclin d1 is a valuable prognostic marker in oropharyngeal squamous cell carcinoma. Clin Cancer Res. 2005 Feb 1;11(3):1160–1166. [PubMed] [Google Scholar]
- 36.Yu Z, Weinberger PM, Provost E, et al. beta-Catenin functions mainly as an adhesion molecule in patients with squamous cell cancer of the head and neck. Clin Cancer Res. 2005 Apr 1;11(7):2471–2477. doi: 10.1158/1078-0432.CCR-04-2199. [DOI] [PubMed] [Google Scholar]
- 37.Harrison PM, Kumar A, Lang N, Snyder M, Gerstein M. A question of size: the eukaryotic proteome and the problems in defining it. Nucleic Acids Res. 2002 Mar 1;30(5):1083–1090. doi: 10.1093/nar/30.5.1083. [DOI] [PMC free article] [PubMed] [Google Scholar]
- 38.Hatakeyama H, Kondo T, Fujii K, et al. Protein clusters associated with carcinogenesis, histological differentiation and nodal metastasis in esophageal cancer. Proteomics. 2006 Dec;6(23):6300–6316. doi: 10.1002/pmic.200600488. [DOI] [PubMed] [Google Scholar]