Abstract
The chemoattractant cAMP induces the translocation of cytosolic PHCrac-GFP to the plasma membrane. PHCrac-GFP is a green fluorescent protein fused to a PH domain that presumably binds to phosphatydylinositol polyphosphates in the membrane. We determined the relative concentration of PHCrac-GFP in the cytosol and at different places along the cell boundary. In cells stimulated homogeneously with 1μM cAMP we observed two distinct phases of PHCrac-GFP translocation. The first translocation is transient and occurs to nearly the entire boundary of the cell; the response is maximal at 6-8 s after stimulation and disappears after ∼20 s. A second translocation of PHCrac-GFP starts after ∼30 s and persists as long as cAMP remains present. Translocation during this second response occurs to small patches with radius of ∼4-5 μm, each covering ∼10% of the cell surface. Membrane patches of PHCrac-GFP are both temporally and spatially closely associated with pseudopodia, which are extended at ∼10 s from the area with a PHCrac-GFP patch. These signaling patches in pseudopodia of homogeneously stimulated cells resemble the single patch of PHCrac-GFP at the leading edge of a cell in a gradient of cAMP, suggesting that PHCrac-GFP is a spatial cue for pseudopod formation also in uniform cAMP.
INTRODUCTION
Many biochemical and cellular processes, such as nuclear division, lipid transport, and cytoskeletal rearrangement are not uniformly distributed within the cell. A pronounced example is chemotaxis; a process in which cells move toward the higher concentration in a chemical gradient. Eukaryotic cells measure the difference in chemoattractant concentration between the ends of the cell and extend a pseudopodium up the gradient of chemoattractant. This mechanism of chemotaxis is essentially identical in all eukaryotes. Dictyostelium is used as a model, because this organism can be genetically manipulated like yeast, but still resemble mammalian cells with respect to cell movement. In Dictyostelium, cell movement is directed by a complex regulatory circuit composed of surface chemoattractant receptors that activate guanylyl cyclase and PI3-kinase producing cGMP and phosphatydylinositol 3-phosphates, respectively. cGMP is involved in myosin phosphorylation and assembly (Bosgraaf et al., 2002), whereas the phosphatydylinositol 3-phosphates form localized binding sites for PH domaincontaining proteins (Funamoto et al., 2002; Iijima and Devreotes, 2002).
Receptor activation by the extracellular chemoattractant cAMP may induce the translocation of several PH domaincontaining proteins from the cytosol to the plasma membrane, such as cytosolic regulator of adenylyl cyclase (CRAC) and protein kinase B (PKB). In gradients of chemoattractants these PH-domain-containing proteins translocate to the leading edge of the cell (Parent et al., 1998; Meili et al., 1999; Parent and Devreotes, 1999). In leukocytes a similar translocation of PH-domain-containing proteins to the leading edge was observed (Servant et al., 2000). In homogeneously stimulated cells, Dictyostelium exhibits a transient translocation to nearly the entire membrane (Parent and Devreotes, 1999), whereas neutrophils show a biphasic response; the first uniform and transient translocation of PHAKT-GFP to the membrane is followed by persistent localization in smaller areas of the membrane (Servant et al., 2000).
Chemotaxis is a complex network of multiple signaling pathway controlling pseudopod formation. The observations on the localization of PH-domaincontaining proteins led to the proposal that PI3-kinase-mediated signaling pathway provides the local accumulation of phosphatydylinositol 3-phosphates that control actin filament formation and pseudopod formation at the leading edge (Servant et al., 2000; Chung et al., 2001; Iijima et al., 2002). Inhibition of pseudopod formation in the back of the cell is probably provided in Dictyostelium by cGMP-mediated formation of myosin filaments (Bosgraaf et al., 2002). Understanding the interplay between these major signaling pathways requires quantitative data on the localization of the enzymes and second messengers involved. In this article we present a refined analysis of the localization of a GFP-containing PH domain. On addition of homogeneous cAMP stimulus we observed a rapid uniform translocation of PHCRAC-GFP to the membrane with a maximum at 8 s. This membrane localization is transient and disappears ∼20 s after stimulation, but reappears as patches of intense membrane associated fluorescence. A cell contains on average ∼2-3 patches, and each patch has a surface area of ∼50 μm2, which is ∼10% of the surface area of a cell. These patches are predominantly found in pseudopodia and are dynamic structures that disappear and reappear in the presence of continuous stimulation with cAMP. The kinetics of these responses suggests that a pseudopod is extended preferentially from the area of the membrane with a PHCRAC-GFP patch.
MATERIALS AND METHODS
Strain and Culture Conditions
A cell line expressing the PH-domain of CRAC fused to eGFP (Xiao et al., 1997; Parent et al., 1998) was made by electroporation of wild-type AX3 cells with plasmid WF38 (a generous gift of P. Devreotes). These PHCrac-GFP-expressing cells were selected and grown in HG5 medium with 10-40 μg/ml neomycin in dishes to 80% confluence. Cells were washed twice with 10 mM phosphate buffer, pH 6.5 (PB) while attached to the dish and starved in the dish in PB at room temperature for 5-8 h.
Fluorescence Microscopy
Starved cells were detached from the dish by repeated pipetting with PB. The cells were then seeded onto the bottom coverslip (type 1, 24 × 60 mm) of a homemade flow chamber (a generous gift of E. Potma; Potma et al., 2001), resulting in a cell density of ∼2 × 10⁵ cells/cm2. After adherence for ∼10 min, the flow chamber was assembled on a Zeiss LSM510 (Carl Zeiss, Oberkochen, Germany) confocal fluorescence microscope with a Plan-Neofluor 40× magnification 1.30 NA oil immersed objective. GFP fluorescence was excited using the 488-nm laser line (AOTF at 2%). The resulting fluorescence was separated from the excitation light with a 488-nm dichoric mirror and passed through a bandpass filter (505-550 nm). The pinhole was set at 67 μm (corresponding to approximately 1 airy unit) to obtain confocal sections.
The flow chamber has entrance and exit tubes that were filled with PB to the same level. By addition of fluid to the entrance tube, the chamber automatically and rapidly fills with the new liquid. In previous experiments it has been shown that exchange of solutions results in a laminar flow without occurrence of gradients, with delay time of ∼1 s (Potma et al., 2001). Before the start of every experiment the chamber was rinsed with PB, and the time between subsequent experiments was at least 3 min to let cells recover from previous experiments.
Data Analysis
A series of confocal images of 115 × 115 μm (512 × 512 pixels) were recorded (zoom 2.0) and saved as 12-bit grayscale bitmaps. The images were processed in Matlab 5.3 in the following way.
Cytosolic Signal. A cytosolic region of interest was selected from a particular cell with the aid of a computer; nuclei and visible cytosolic organelles were omitted. The mean fluorescence intensity IC and SD σ̂C of the pixel values in this region were determined for each image in the series. The cytosolic fluorescence intensity IC0 of an unstimulated cell was defined as the average value of IC in five images just before cAMP stimulation of the cells. From these five images also the background fluorescence intensity outside the cells IB was determined. We define the normalized cytosolic signal ÎC as follows:
 |
1 |
The SD of the normalized fluorescence intensity is
 |
2 |
Boundary Signal. With the aid of a computer, a contour of the same cell was calculated based on the transition of the background fluorescence intensity to the cytosolic fluorescence intensity at the periphery of the cell. This outer contour was positioned at the value of (IC - IB)/2 and was used to determine an inner contour at a distance of 0.5 μm from the outer contour. The inner contour then approximately coincided with the boundary region where translocation was apparent. If necessary the contour was adjusted by hand and aid of the computer. Using spline interpolation 1000 equidistant contour points were positioned on the inner contour. At every contour point a small line segment (0.2-1 μm, see below) perpendicular to the inner contour was constructed and the fluorescence intensity profile along this line segment was determined using linear pixel interpolation. The fluorescence intensity at the cell boundary (IM) was then extracted from the intensity profile using either a quick or an accurate methods.
In the quick method IM is defined as the maximum fluorescence intensity along the line segment. This method uses longer line segments (1 μm) and the contour does not have to coincide precisely with the boundary region. The disadvantage is that the value of the fluorescence intensity is overestimated because of skewed noise entering the data. A more accurate, but time-consuming, method requires the precise adjustment by hand of the inner contours with the boundary of the cell. The fluorescence intensity profile along the shorter line segment (0.225 μm, the size of a pixel) is determined and IM is defined to be the average fluorescence intensity value along the segment. The data obtained by the fast method provide a very clear picture of the events taken place at the plasma membrane, but contain slight overestimates of the fluorescence intensity. For statistical analysis of the data we prefer the accurate method, because it allows a quantitative comparison between fluorescence intensity in the cytosol and at the boundary.
Given IM, we define ÎM as the normalized signal at a specific location of the cell boundary:
 |
3 |
Thus, the signal at the membrane after stimulation is presented relative to the signal in the cytosol before stimulation.
For analysis and visualization of the dynamic changes of membrane localized PHCrac-GFP, the thousand values of one image are presented as grayscales or false color on a strip with an interval of 2 s. To facilitate visual interpretation of these plots, the fluorescence intensity of the strips were connected yielding a two-dimensional fluorescence spatiotemporal fluorescence intensity plot. The color codes represent the difference between the normalized boundary fluorescence and the normalized cytosolic fluorescence: ÎM - ÎC.
Fraction of Membrane with Significant Translocation
Translocation of fluorescence is apparent when the fluorescence intensity at the boundary ÎM is significantly different compared with the average fluorescence intensity in the cytosol ÎC. A Wilcoxon rank sum test was used to determine the boundary points with significant translocation. The average boundary intensity 〈ÎM〉 was calculated for every boundary point and a number of adjacent boundary points. The number of adjacent boundary points was chosen such that it spanned a length of three original confocal image pixels. A boundary point has significant translocation if  . The Fraction of Translocation (FoT) is defined as the fraction of boundary points that show significant translocation.
The probability that the average of three adjacent pixels in an unstimulated cell have the required intensity is
 |
this gives a background noise of only 1.6%.
Protrusions and Pseudopodia
The outline of the cell was compared for two subsequent images. The new area of the cell is defined as protrusion if it is a small extension (<1 μm); often multiple thin protrusions are formed from a small area of the cell. The new area of the cell is defined as a pseudopodium if it is larger extension (>1 μm); generally one broader pseudopod is formed from a small area of the cell.
RESULTS
Spatial Variation in Fluorescence in Response to cAMP
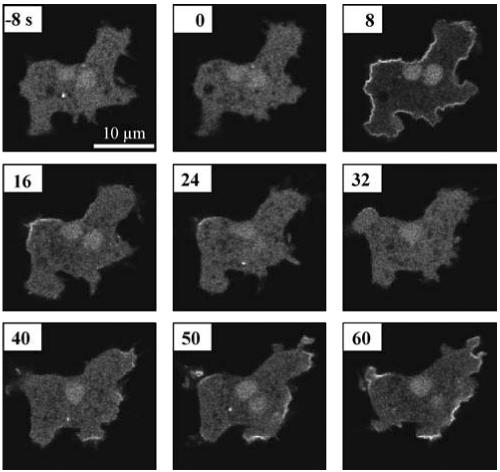
Figure 1 shows a series of confocal fluorescence images of a single cell recorded during 8 s before and 60 s after uniform stimulation with 1 μM cAMP. Before stimulation PHCrac-GFP is localized mainly in the cytosol. An increase of fluorescence at the boundary of the cell is apparent at 8 s after addition of cAMP. The strong fluorescence at the boundary has disappeared at 24 s. A second response at the boundary appears after 40 s. The enhanced fluorescence at the boundary now seems to be localized in separate regions and not along the entire boundary as during the first response.
Figure 1.
cAMP-mediated translocation of PHCrac-GFP. Aggregation competent cells were stimulated in a perfusion chamber with a homogeneous cAMP concentration of 1 μM at t = 0 s. Confocal images were taken at the times indicated. The figure shows GFP in the cytosol before cAMP stimulation, a transient translocation of GFP to the entire boundary of the cell at 8 s after addition of cAMP, and patches of GFP at the boundary after 40 s.
To quantify the fluorescence in the cytosol and at the boundary, generally a line is drawn through the cell. Statistical analysis of the fluorescence intensity along this line in many cells provides information on the relative concentration of PHCrac-GFP in the cytosol and at the boundary of the cell (Parent et al., 1998). This method is simple but uses only a very small portion of the pixels of the cells inner area. More importantly, the method is not very suitable for analysis of the fluorescence along the boundary of the cell, especially during the second patch-like response. We developed semiautomatic methods to quantify the fluorescence intensity in the cytosol and along the entire cell boundary.
Analysis of Fluorescent Intensity in the Cytosol
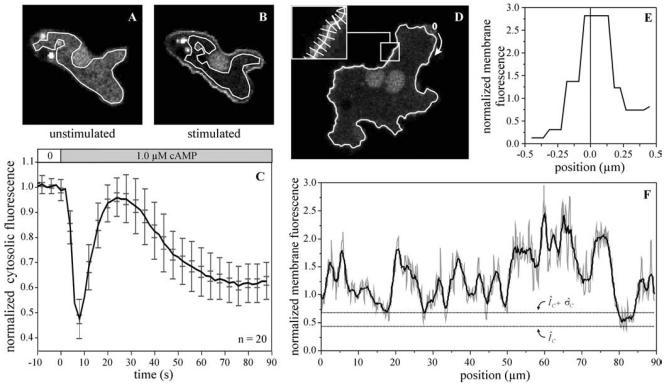
To estimate the fluorescent intensity of the cytosol, a region of interest was selected in a confocal image (Figure 2, A and B). This region of interest is as large as possible, but omits the strongly fluorescent nucleus and vesicles as well as big nonfluorescent vacuoles. Dictyostelium cells show heterogeneous levels of PHCrac-GFP expression. Therefore, the fluorescence intensity of the cytosol after stimulation with cAMP is presented relative to the fluorescence intensity of the same cell before stimulation. The normalized fluorescent intensity in the cytosol after stimulation with 1 μM cAMP is presented in Figure 2C as the average value of 20 different cells from the same experiment. The fluorescence intensity before stimulation does not decrease significantly (<1% per 10 s); therefore, bleaching of eGFP does not contribute significantly to changes in the observed fluorescence levels. A decrease of fluorescence intensity is first observed between 2 and 4 s after addition of cAMP to the perfusion chamber, which has a lag-time of ∼1 s. The average intensity decreases to a minimum of 0.48 ± 0.08 at 8 s after stimulation with 1 μM cAMP. This decrease of fluorescence intensity is transient; the fluorescence approaches prestimulus levels (0.95 ± 0.07) at ∼25 s after stimulation. Subsequently a second phase of depletion of cytosolic fluorescence intensity takes place, which starts at ∼30 s after stimulation and reaches a minimal fluorescence intensity of 0.63 ± 0.07. The depletion of PHCrac-GFP from the cytosol remains present at this level during the subsequent stimulation with 1 μM cAMP.
Figure 2.
Quantification of fluorescence intensity in the cytosol and along the cell boundary. A representative cell before and 8 s after stimulation with 1 μM cAMP is shown in panels A and B, respectively. An area of the cytosol was selected that is devoid of the nucleus and large vesicles. The mean fluorescence intensity in the selected area was determined and is presented in C as relative fluorescence at different times after stimulation with cAMP. The results shown are the means and SD (large bars) or SE of the mean (small bars) of 20 cells. (D) The boundary contour of the cAMP-stimulated cell. On this contour thousand short perpendicular lines were positioned (inset in D); the fluorescence intensity along one line segment is presented in E. The fluorescence intensity along the membrane was determined for the 1000 boundary points as described in MATERIALS AND METHODS and is presented in F. The thin gray line represent the original data, which are smoothed by adjacent averaging in the black line. ÎC + σ̂C refers to the fluorescence intensity of the cytosol ÎC and the SD σ̂C. The 0-position and direction are indicated by the arrow in D.
Analysis of Fluorescent Intensity at the Plasma Membrane
In fluorescent images of PHCrac-GFP-labeled cells, the plasma membrane is not formally identified. We will determine the fluorescent intensity along the boundary of the cell, which will include the plasma membrane and membraneassociated proteins, but may represent the cytosol if no membrane-associated GFP is present.
After determination of the fluorescence intensity in the cytosol of a specific cell, an outer contour of the cell was calculated using the transition of background fluorescence intensity outside the cell to the cytosolic fluorescence intensity inside the cell (see MATERIALS AND METHODS). Then, an inner contour at a distance of 0.5 μm from the outer contour was calculated, which will be close to the boundary of the cell (Figure 2D). Perpendicular to and evenly distributed along the inner contour thousand lines were positioned (inset in Figure 2D), and the fluorescence intensity along each line segment was determined (Figure 2E). Using interpolation (see MATERIALS AND METHODS), the fluorescence intensity at the boundary was calculated and was normalized to the fluorescence intensity in the cytosol of the same cell before cAMP stimulation. Figure 2F shows the normalized fluorescence at the boundary of the cell at 8 s after stimulation with cAMP. The thin gray line represents the raw data and the thick black line is the result of smoothing the data by averaging over a length of three adjacent pixels.
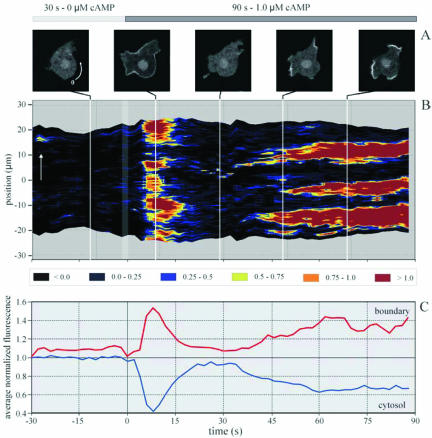
For analysis and visualization of the dynamic changes of membrane localized PHCrac-GFP, the thousand values for the fluorescence intensity of one image are presented as false color, and the data for subsequent images are placed after each other yielding a two-dimensional spatiotemporal fluorescence intensity plot. Figure 3B presents the normalized fluorescence intensity at the boundary of a cell stimulated with 1 μM cAMP. Before stimulation the fluorescence at the boundary is essentially identical to the fluorescence in the cytosol. The images taken up to 4 s after cAMP addition are not significantly different from the images taken before stimulation. A strong and significant increase of fluorescence is apparent in the images taken between 4 and 18 s after cAMP addition. Translocation of PHCrac-GFP to the boundary appears to be nearly ubiquitous along the boundary; only small parts of the boundary do not show increased levels of fluorescence. The average fluorescence intensity at the boundary of seven cells is 1.4 ± 0.1 relative to the fluorescence intensity of the cytosol before stimulation. Between 20 and 35 s after cAMP, addition fluorescence intensity at the boundary has returned to nearly the same intensity levels as before stimulation. At ∼35 s after stimulation strong fluorescence intensity at the periphery reappears, but translocation is far from uniform. The regions with increased fluorescence intensity appear as localized patches, separated by voids or regions with low levels of fluorescence. Three patches are visible in the cell presented in Figure 3. The increased fluorescence at the boundary after prolonged cAMP stimulation remains present in patches for the subsequent period of the experiment. The mean fluorescence intensity in the cytosol and along the boundary of this cell is presented in Figure 3C, demonstrating that the changes in the cytosol are associated with opposite changes at the boundary of the cell.
Figure 3.
Fluorescence intensity in the cytosol and at the at the cell boundary. (A) Cell at different times after stimulation with 1 μM cAMP. (B) PHCrac-GFP at the boundary, presented as the difference of fluorescence intensity between the boundary and the cytosol, color-coded as shown below panel A. The ordinate refers to the position along the cell with the 0-position and direction indicated by the arrow in the cell image. (C) Fluorescence intensity in the cytosol of this cell and along its entire boundary obtained from seven cells. The data show two phases of depletion in the cytosol that coincide with increases of fluorescence at the boundary.
Statistical Analysis of the Fraction of Translocation in the Membrane
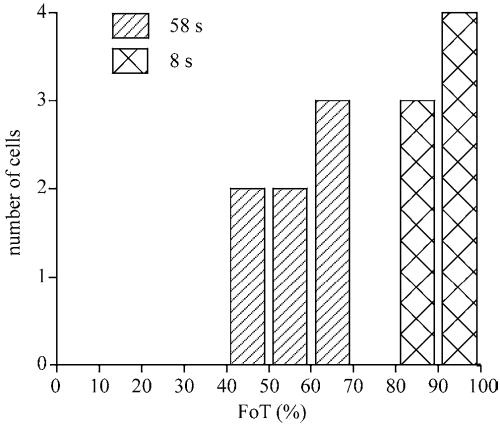
To compare the translocation events in the membrane of many cells, we have determined the fraction of the boundary that exhibits translocation of PHCrac-GFP. The FoT is defined as the fraction of boundary points that have a fluorescence intensity that is significantly higher than the fluorescence intensity in the cytosol (i.e., ÎM > ÎC + σ̂C; see Figure 2F and MATERIALS AND METHODS). At 8 s after addition of 1 μM cAMP, the fraction of translocation is high (FoT = 91.4 ± 6.4%). At 58 s after stimulation the fraction of translocation is much lower (FoT = 56.2 ± 7.3%), demonstrating that PHCrac-GFP translocates to only about half of the boundary. Importantly, both FoT values have a relatively narrow distribution as indicated by the small SDs, and consequently the two populations show no overlap (Figure 4). This suggests that the uniform first response is very different from the second more patchy response.
Figure 4.
Fraction of boundary with significant translocation (FoT). The FoT value is defined as the fraction of the boundary that shows a significantly higher fluorescence intensity than in the cytosol. The FoT values were determined for 7 cells at 8 and 58 s after stimulation. The FoT value at 8 s after stimulation is very high, indicating PHCrac-GFP associates to nearly the entire boundary, whereas at 58 s after stimulation PHCrac-GFP is found at only ∼50% of the boundary in patches.
Properties of Signaling Patches
Inspection of more than 20 cells from different experiments revealed that patches are dynamic structures that disappear and reappear at other places during cAMP stimulation. The fluorescence intensity at the edge of most patches increases steeply, from 10 to 90% of the maximal intensity over a distance of only 1.0 μm. The distance between patches appears to be very variable; we observed cases where patches are very close together (3 μm) or very far apart (20 μm) and all distances between those values. The number of patches per cell is variable from 0 to 4 patches with an average of 2.3 ± 1.1 patches/cell, and their size is 9.0 ± 3.2 μm at t = 58 s after stimulation with 1 μM cAMP.
Many patches start their formation at a specific boundary point and then spread out to their full size. Analysis of 23 patches from 7 cells demonstrates that the half-time of patch formation is ∼8-10 s from start to full intensity. Because the average size of a patch is ∼10 μm, this implies that the initial growth rate of patches is ∼0.5 μm/s. The average lifetime of patches was estimated from these 23 recordings during 90 s and appeared to be variable. No patches were observed that have a lifetime shorter than 20 s. About 55% of the patches have a lifetime between 20 and 60 s, and ∼45% of the patches that appeared at some moment during the 90 s of cAMP stimulation were still present at the end of the recordings, indicating a lifetime longer than 45 s. The average patch lifetime was estimated to be 53 ± 16 s.
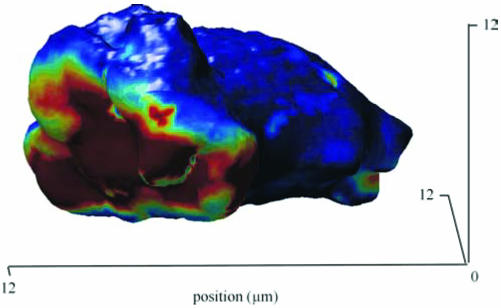
Figure 5 reveals a three-dimensional reconstruction of a Dictyostelium cell in 1 μM cAMP. Cells in the perfusion chamber are relatively flat with a radius of ∼6 μm and a height of ∼5 μm. One nearly round patch is visible with radius of ∼4 μm and an estimated surface area of ∼50 μm2.
Figure 5.
Three-dimensional reconstruction of patches. Cells expressing PHCrac-GFP were stimulated with 1 μM cAMP for 2-3 min. From a series of confocal Z-scans, the fluorescence intensity at the cell boundary was determined. The figure reveals one patch with a diameter of ∼8 μm.
Patches Are Found in Pseudopodia.
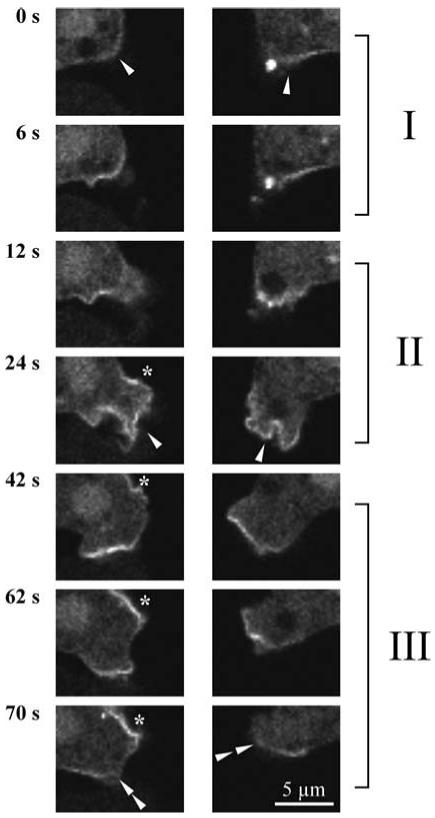
Figures 1 and 3 show that PHCrac-GFP patches are often observed at the periphery of pseudopodia. We have analyzed in more detail the localization of the patches relative to the position of pseudopodia. After ∼1 min of stimulation with 1 μM cAMP, virtually all pseudopodia contain a patch of PHCrac-GFP (28 of 29 pseudopodia in 15 cells), but not all patches were found in pseudopodia (11 of 39 patches); at the position of 8 of these 11 patches a pseudopod was formed within the next 15 s, whereas only 3 patches remained unassociated to a pseudopod.
To investigate whether patches are formed in existing pseudopodia or vice versa, that pseudopodia will form at the position of patches, we followed the life cycles of patches and pseudopodia. This was done for the first patches that appear after stimulation with cAMP as well as for patches that appear at longer times after stimulation. Cells stimulated with 1 μM cAMP stop locomotion, retract pseudopodia (cringe), and then resume to extend pseudopodia (Varnum and Soll, 1984). Only 2 of 15 patches that appeared after the cringe started in a protrusion, whereas nearly all patches were formed at a convex area of the cell (Figure 6, part I). These 13 patches grew in the subsequent 10 s to a full-size patch. At the same time small protrusions/ruffles were formed at the position of the patches. About 12-16 s after the onset of patch formation, large protrusions appeared and the patches temporarily became less confined (Figure 6, part II); these protrusions converted to extended pseudopodia with a defined patch of PHCrac-GFP at the periphery. We followed 15 pseudopodia with patches toward the end of their life cycle (Figure 6, part III). About 40-60 s after the onset of patch formation patches reduce in size over a period of ∼6-8 s and disappear. Then two events were observed: In ∼60% of the cases the old pseudopod was actively retracted at 7 ± 2 s after the patch disappeared. In the other 40% of the cases the main cell body had translocated into the old pseudopod. Patches that are formed at longer times after stimulation with cAMP show a similar behavior as the first patches after stimulation with 1 μM cAMP: the patch starts at a specific point and shows growth in 10 s, and subsequently a pseudopodium is formed.
Figure 6.
Correlation between PHCrac-GFP patches and pseudopodia. The life cycles of two patches are presented that appear ∼35 s after stimulation with 1 μM cAMP. Phase I, onset of patch formation. The first appearance of increased levels of PHCrac-GFP at the boundary is indicated by the arrow at t = 0 s; the patch grows during the next 10 s. Phase II, protrusions and pseudopod extension occurs at the location of the PHCrac-GFP patch (arrow; the asterisk at 24 s indicates the start of a new patch). Phase II termination of the patch and retraction of the pseudopod. At about 60 s the patch reduces in size and disappears, and the pseudopod is retracted (double arrow).
In the absence of cAMP stimulation, cells are actively forming and retracting pseudopodia, but patches of PHCrac-GFP are not present (see Figure 1). In addition, after washing away cAMP, patches rapidly disappear and PHCrac-GFP returns to the cytosol, while pseudopodia are still being formed (unpublished results). These observation reveal that cAMP is essential for PHCrac-GFP patch formation and that pseudopodia can be formed in the absence of PHCrac-GFP patches. On the other hand, when PHCrac-GFP patches are formed, they are often seen at a place where a pseudopodium is formed after a few seconds.
Patches during Local Stimulation in a cAMP Gradient
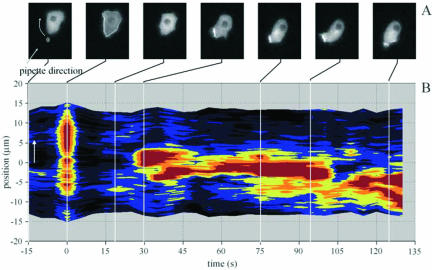
The previous results demonstrate that a homogeneous cAMP stimulus induces patches of binding sites in the membrane for PHCrac-GFP, which are associated with the enhanced extension of pseudopodia. Patches with these properties might be helpful in sensing and responding to spatial chemotactic gradients. Figure 7 shows the fluorescence intensity of PHCrac-GFP at the boundary of cells stimulated with cAMP from a pipette, which provides a strong spatial gradient of cAMP (data derived from Parent et al., 1998). Initially, cAMP induces a rapid and rather uniform translocation of PHCrac-GFP to the entire boundary of the cell. This response is transient: PHCrac-GFP reappears in the cytosol, which is followed by a new phase of translocation to the boundary. This translocation is not uniform, but has the appearance of a single patch with a diameter of ∼6 μm. The patch is always located at the side of the cell closest to the pipette with cAMP and is associated with formation of a pseudopodium. The patch in Figure 7 remains present for ∼75 s and disappears and a new patch is formed. Also this new patch of PHCrac-GFP is associated with the formation of a pseudopod.
Figure 7.
Fluorescent intensity at the boundary of a locally stimulated cell. Data obtained from Parent et al. (1998). Cells were stimulated with a pipette filled with 1 μM cAMP. (A) The fluorescence intensity of a typical cell (the position of the pipette is indicated; note that this is not a confocal image). The fluorescence intensity at the boundary is presented for this cell in B; the position of the pipette is at 0 μm. The results show a nearly uniform response at t = 0 s, followed by a patch of ∼6 μm that is formed in the direction of the pipette and is present from 28 to 104 s. A new patch is formed around 108 s, not at the position of the old patch but immediately to the right side. These patches of PHCrac-GFP are associated with the formation of pseudopodia at those positions.
DISCUSSION
On stimulation of Dictyostelium cells in a perfusion chamber with a uniform cAMP concentration, we observed a rapid, transient translocation of PHCrac-GFP to nearly the entire plasma membrane, as was observed previously (Parent et al., 1998). This response was followed by a second translocation of cytosolic PHCrac-GFP that did not occur to the entire plasma membrane; instead, distinct patches of intense fluorescence were formed at the plasma membrane. This second patchy response to uniform cAMP has not been reported previously in Dictyostelium, so we were concerned about possible artifacts. Patches appear ∼30-40 s after stimulation with cAMP, which is approximately the time of cAMP-induced cAMP secretion. Inhibition of this cAMP relay with 2 mM caffeine (Theibert and Devreotes, 1983) did not affect the cAMP-induced patch formation (our unpublished results). The notion that patches are observed as long as cAMP is present, whereas the relay response is transient, also indicates that cAMP synthesis and secretion is not related to patch formation. The changes of the fluorescence intensity at the boundary closely mirror the changes seen in the cytosol (Figure 3C). Thus, patches are not the result of local folds or wrinkles in the membrane. We conclude that patches are not artifacts, but the result of PHCrac-GFP translocation to restricted areas of the plasma membrane. Aditionally, Dictyostelium cells do not need a spatial cAMP gradient to respond in a localized manner. Neutrophils show a similar biphasic response to a temporal increment of the stimulus concentration (Servant et al., 2000). The first uniform and transient translocation of PHAKT-GFP to the membrane is followed by persistent polarization of the cell in a random direction; this polarization is associated with the local accumulation of PHAKT-GFP at the leading side of the cell (Servant et al., 2000). As in neutrophils, these patches of PHCrac-GFP were often found in pseudopodia. In contrast to neutrophils, uniformly stimulated Dictyostelium cells do not polarize in one direction, because we observed multiple patches of PHCrac-GFP and pseudopodia in a single cell.
To understand the biological relevance of this second patchy PHCrac-GFP translocation response to uniform cAMP stimulation, we have compared its properties with the PHCrac-GFP translocation to the leading edge induced by a gradient of cAMP (Table 1). The PHCrac-GFP patches induced by uniform cAMP have a size of ∼9 μm, which is essentially identical to the size PHCrac-GFP at the leading edge in a cAMP gradient. Also the lifetime of a PHCrac-GFP patch in uniform cAMP is approximately the same as the lifetime of PHCrac-GFP in a pseudopodium at the leading edge in a cAMP gradient, ∼1 min. The cAMP-induced PHCrac-GFP in patches and at the leading edge show the same sensitivity to the PI3K inhibitor LY294002 (Funamoto et al., 2001; our unpublished results). Finally, cells extend a pseudopod at the location of a PHCrac-GFP patch ∼5-15 s after this patch was formed, either at the leading edge of a cell in a cAMP gradient or at the patches of a cell in uniform cAMP. The only difference is the number of patches, which is only one patch at the leading edge in a cAMP gradient and between two and four patches in uniform cAMP. We conclude that PHCrac-GFP patches in uniformly stimulated cells have the same properties as the single PHCrac-GFP patch at the leading edge in a cAMP gradient.
Table 1.
Properties of PHCrac-GFP at leading edge of cells in a cAMP gradient and of PHCrac-GFP in patches of cells in uniform cAMP
A strong spatial and temporal correlation was demonstrated between the life cycle of patches and the life cycle of pseudopodia in uniformly stimulated cells (Figure 6), such that patches arise and disappear ∼10 s before pseudopodia. A causal link between PHCrac-GFP localization and pseudopod formation has also been obtained from mutant analysis. In cAMP-stimulated pten-null cells, the magnitude and time course of PI(3,4,5)P3 production are increased compared with wild-type cells (Huang et al., 2003). The absence of 3-phosphatase activity leads to broadening of PHCrac-GFP localization as well as to broadening of the region from which F-actin-filled pseudopodia are extended (Iijima and Devreotes, 2002). Thus, pseudopodia are more likely to be formed at regions of the plasma membrane that contain elevated levels of PI(3,4,5)P3 and PHCrac-GFP. This strongly suggests that PI(3,4,5)P3/PHCrac-GFP patches are a spatial cue for pseudopod formation. In uniform cAMP multiple PI(3,4,5)P3/PHCrac-GFP patches and pseudopodia are formed, whereas in a cAMP gradient only one PI(3,4,5)P3/PHCrac-GFP patch is present at the leading edge.
In uniform cAMP, the translocation of PHCrac-GFP to patches is a dynamic process. Patches have an average lifetime of ∼1 min, and new patches are formed as long as cAMP remains present. The continued formation of patches in the presence of cAMP implies that the second translocation response does not exhibit perfect adaptation. The absence of adaptation is also demonstrated by experiments in which several minutes of cAMP stimulation are interrupted in the perfusion chamber by a brief 30-s period with buffer. During 30 s of buffer all patches disappear, to reappear within 10 s after readdition of cAMP (our unpublished results). The absence of perfect adaptation is unexpected, because nearly all responses of Dictyostelium cells to constant cAMP stimulation are transient and exhibit perfect adaptation (e.g., see Devreotes and Steck, 1979; Van Haastert and Van der Heijden, 1983). It has been demonstrated that cAMP induces the dissociation and activation of the G protein Gα2βγ in vivo, which remains dissociated as long as cAMP is present (Janetopoulos et al., 2001). Activation of PI3K is mediated by Gα2βγ, and this transduction pathway (including receptor and Gα2βγ) apparently does not exhibit perfect adaptation. Thus, cells are able to constantly monitor the extracellular cAMP concentration, not only in a cAMP gradient, but also at constant cAMP concentrations.
The continuous formation of multiple PHCrac-GFP patches in Dictyostelium cells in constant cAMP not only reveals the absence of perfect adaptation, but also indicates that one patch does not become dominant over other patches, and consequently cells are not polarized in one direction. Neutrophils, in contrast, become persistently polarized in a random direction upon uniform stimulation, and show a single patch of PHAKT-GFP at the leading edge (Servant et al., 2000). The absence of adaptation of PHCrac-GFP translocation and the low tendency of Dictyostelium cells to become polarized in uniform cAMP is reflected by the chemotactic behavior of 5-h starved Dictyostelium cells in gradients of cAMP. Reversal of the gradient often leads to the formation of a new front at the old back of the Dictyostelium cell, whereas neutrophils usually make a U-turn at the existing front (Zigmond et al., 1981; Swanson and Taylor, 1982). Interestingly, inhibition of PI3K in 5-h starved Dictyostelium cells with LY294002 suppresses the extension of pseudopodia at the old back, and cells now change direction by making a U-turn (Chen et al., 2003).
In summary, we have demonstrated that uniform cAMP induces patches of PI(3,4,5)P3/PHCrac-GFP that are likely to be the spatial cues to form pseudopodia. The absence of perfect adaptation of this response is unexpected, but explains why Dictyostelium cells readily reverse direction when the cAMP gradient reverses.
Acknowledgments
We thank Peter Devreotes for providing plasmid WF38 and Eric Potma for the flow chamber. This research was supported by the Netherlands Organization for Scientific Research (NWO).
References
- Bosgraaf, L., Russcher, H., Smith, J.L., Wessels, D., Soll, D.R., and Van Haastert, P.J.M. (2002). A novel cGMP signalling pathway mediating myosin phosphorylation and chemotaxis in Dictyostelium. EMBO J. 21, 4560-4570. [DOI] [PMC free article] [PubMed] [Google Scholar]
- Chen, L., Janetopoulos, C., Huang, Y.E., Iijima, M., Borleis, J., and Devreotes, P.N. (2003). Two phases of actin polymerization display different dependencies on PI(3,4,5)P3 accumulation and have unique roles during chemotaxis. Mol. Biol. Cell 14, 000-000. [DOI] [PMC free article] [PubMed] [Google Scholar]
- Chung, C.Y., Funamoto, S., and Firtel, R.A. (2001). Signaling pathways controlling cell polarity and chemotaxis. Trends Biochem. Sci. 26, 557-566. [DOI] [PubMed] [Google Scholar]
- Devreotes, P.N., and Steck, T.L. (1979). Cyclic 3′, 5′ AMP relay in Dictyostelium discoideum. II. Requirements for the initiation and termination of the response. J. Cell Biol. 80, 300-309. [DOI] [PMC free article] [PubMed] [Google Scholar]
- Funamoto, S., Meili, R., Lee, S., Parry, L., and Firtel, R.A. (2002). Spatial and temporal regulation of 3-phosphoinositides by PI 3-kinase and PTEN mediates chemotaxis. Cell 109, 611-623. [DOI] [PubMed] [Google Scholar]
- Funamoto, S., Milan, K., Meili, R., and Firtel, R.A. (2001). Role of phosphatidylinositol 3′ kinase and a downstream pleckstrin homology domaincontaining protein in controlling chemotaxis in dictyostelium. J. Cell Biol. 153, 795-810. [DOI] [PMC free article] [PubMed] [Google Scholar]
- Huang, Y.E., Iijima, M., Parent, C.A., Funamoto, S., Firtel, R.A., and Devreotes, P.N. (2003). Receptor mediated regulation of PI3Ks confines PI(3, 4, 5)P3 to the leading edge of chemotaxing cells. Mol. Biol. Cell 14, 1313-1322. [DOI] [PMC free article] [PubMed] [Google Scholar]
- Iijima, M., and Devreotes, P. (2002). Tumor suppressor PTEN mediates sensing of chemoattractant gradients. Cell 109, 599-610. [DOI] [PubMed] [Google Scholar]
- Iijima, M., Huang, Y.E., and Devreotes, P. (2002). Temporal and spatial regulation of chemotaxis. Dev. Cell 3, 469-478. [DOI] [PubMed] [Google Scholar]
- Janetopoulos, C., Jin, T., and Devreotes, P. (2001). Receptor-mediated activation of heterotrimeric G-proteins in living cells. Science 291, 2408-2411. [DOI] [PubMed] [Google Scholar]
- Meili, R., Ellsworth, C., Lee, S., Reddy, T.B., Ma, H., and Firtel, R.A. (1999). Chemoattractant-mediated transient activation and membrane localization of Akt/PKB is required for efficient chemotaxis to cAMP in Dictyostelium. EMBO J. 18, 2092-2105. [DOI] [PMC free article] [PubMed] [Google Scholar]
- Parent, C.A., Blacklock, B.J., Froehlich, W.M., Murphy, D.B., and Devreotes, P.N. (1998). G protein signaling events are activated at the leading edge of chemotactic cells. Cell 95, 81-91. [DOI] [PubMed] [Google Scholar]
- Parent, C.A., and Devreotes, P.N. (1999). A cell's sense of direction. Science 284, 765-770. [DOI] [PubMed] [Google Scholar]
- Potma, E., de Boeij, W.P., van Haastert, P.J., and Wiersma, D.A. (2001). Real-time visualization of intracellular hydrodynamics in single living cells. Proc. Natl. Acad. Sci. USA 98, 1577-1582. [DOI] [PMC free article] [PubMed] [Google Scholar]
- Servant, G., Weiner, O.D., Herzmark, P., Balla, T., Sedat, J.W., and Bourne, H.R. (2000). Polarization of chemoattractant receptor signaling during neutrophil chemotaxis. Science 287, 1037-1040. [DOI] [PMC free article] [PubMed] [Google Scholar]
- Swanson, J.A., and Taylor, D.L. (1982). Local and spatially coordinated movements in Dictyostelium discoideum amoebae during chemotaxis. Cell 28, 225-232. [DOI] [PubMed] [Google Scholar]
- Theibert, A., and Devreotes, P.N. (1983). Cyclic 3′, 5′-AMP relay in Dictyostelium discoideum: adaptation is independent of activation of adenylate cyclase. J. Cell Biol. 97, 173-177. [DOI] [PMC free article] [PubMed] [Google Scholar]
- Van Haastert, P.J., and Van der Heijden, P.R. (1983). Excitation, adaptation, and deadaptation of the cAMP-mediated cGMP response in Dictyostelium discoideum. J. Cell Biol. 96, 347-353. [DOI] [PMC free article] [PubMed] [Google Scholar]
- Varnum, B., and Soll, D.R. (1984). Effects of cAMP on single cell motility in Dictyostelium. J. Cell Biol. 99, 1151-1155. [DOI] [PMC free article] [PubMed] [Google Scholar]
- Xiao, Z., Zhang, N., Murphy, D.B., and Devreotes, P.N. (1997). Dynamic distribution of chemoattractant receptors in living cells during chemotaxis and persistent stimulation. J. Cell Biol. 139, 365-374. [DOI] [PMC free article] [PubMed] [Google Scholar]
- Zigmond, S.H., Levitsky, H.I., and Kreel, B.J. (1981). Cell polarity: an examination of its behavioral expression and its consequences for polymorphonuclear leukocyte chemotaxis. J. Cell Biol. 89, 585-592. [DOI] [PMC free article] [PubMed] [Google Scholar]


