

Abstract
The three-dimensional structure of chromatin affects DNA accessibility and is therefore a key regulator of gene expression. However, the path of the DNA between consecutive nucleosomes, and the resulting chromatin fiber organization remain controversial. The conformational space available for the folding of the nucleosome chain has been analytically described by phase diagrams with a two-angle model, which describes the chain trajectory by a DNA entry-exit angle at the nucleosome and a torsion angle between consecutive nucleosomes. Here, a novel type of numerical phase diagrams is introduced that relates the geometric phase space to the energy associated with a given chromatin conformation. The resulting phase diagrams revealed differences in the energy landscape that reflect the probability of a given conformation to form in thermal equilibrium. Furthermore, we investigated the effects of entropy and additional degrees of freedom in the dynamic phase diagrams by performing Monte Carlo simulations of the initial chain trajectories. Using our approach, we were able to demonstrate that conformations that initially were geometrically impossible could evolve into energetically favorable states in thermal equilibrium due to DNA bending and torsion. In addition, dynamic phase diagrams were applied to identify chromatin fibers that reflect certain experimentally determined features.
Introduction
In eukaryotic cell nuclei, DNA is wrapped 1.67 times around a histone octamer protein core. The resulting protein-DNA complex is referred to as the nucleosome and represents the basic building block of chromatin (1). Nucleosomes are connected via the intervening linker DNA and form a beads-on-a-string-like structure that can associate into a chromatin fiber (1,2). In addition, the H1 linker histone or the variant linker histone H5 found in avian erythrocytes can bind to the nucleosome. The resulting structure is termed a chromatosome and can promote the further compaction to the chromatin fiber structure (1,3,4). The spatial organization of nucleosomes in the chromatin fiber affects DNA accessibility and is therefore an important factor in processes such as transcription, replication, repair, and recombination (3,5–7). Although the structure of the nucleosome is known at atomic resolution (8), the chromatin fiber structure and its higher-order organization remain controversial and various models have been suggested (1,3,9,10). Two types of models can be distinguished: solenoid models, in which consecutive nucleosomes on the chain stack on each other to form a helical fiber structure (11), and crossed-linker models with straight linker DNA that mediate contacts between nucleosomes that are not directly adjacent on the nucleosome chain (12). The available experimental data point to the existence of different chromatin fiber geometries. Numerous structures have been proposed, including 1), a crossed-linker two-start helix without linker histone based on the crystal structure of a tetranucleosome particle (13); 2), a one-start helix with interdigitated (ID) nucleosomes as derived from electron microscopy studies of reconstituted chromatin fibers (14,15); and 3), a two-start helix conformation with crossed-linker DNA and a zig-zag-like DNA backbone with a so-called nucleosome stem motif, which occurs for native chromatin of chicken erythrocytes (16,17).
To explore the conformational space of the nucleosome chain, investigators have used Monte Carlo (MC) simulations to gain valuable insights into the structure of chromatin in thermal equilibrium (18–25). To include additional degrees of freedom for the folding of the nucleosome chain and allow investigation of structures that are not accessible in the two-angle model, a six-angle model for the nucleosome geometry in the fiber was recently introduced (25). However, for a number of experimental findings, such as those obtained with reconstituted chromatin with ≥207 basepair (bp) nucleosome repeat lengths (NRLs), model structures are still lacking (4,15,20). High-resolution experimental data for the nucleosome/chromatosome geometry with respect to the path of the incoming and outgoing DNA are currently limited to that of the tetranucleosome crystal structure with 167 bp NRL. In addition, the dependence of the fiber structure on the salt concentration (22,26–28) as well as on other factors, such as the (cooperative) binding of linker histones (16,17,29,30), need to be investigated further.
In a simplified description termed the “two-angle model”, the conformation of the nucleosome chain with a given NRL is described by a torsion angle β between nucleosomes and a DNA entry-exit angle α at the nucleosome (31). This model has been used to investigate the large number of geometrically possible nucleosome geometries in phase diagrams (32–35). In these diagrams, properties of the chromatin fiber were analyzed in a two-dimensional parameter space defined by the angles α and β, with a focus on the geometrically possible conformations and their properties, e.g., their energy (36). However, there are several fiber conformations, such as those based on the tetranucleosome crystal structure or the fibers proposed for chromatin from chicken erythrocytes (20,25), that are stable in thermal equilibrium but can only form after considerable DNA bending and twisting to obtain an energetically favorable stacking of two nucleosomes. With relaxed DNA, these fibers would be classified as sterically impossible in the two-angle phase diagrams. Here, phase diagrams and MC simulations were combined to take advantage of both approaches. First, numerical phase diagrams for the energy associated with a given chromatin fiber were developed. In contrast to phase diagrams of the two-angle model (32–35), more complex nucleosome geometries according to the six-angle model were considered and the associated energies were calculated. The resulting phase diagrams revealed considerable energy differences between the fiber geometries. Subsequently, their stability was evaluated in MC simulations. This novel approach accounts for energetic and entropic effects on chromatin fiber compaction, and is referred to as a numerical dynamic phase diagram (DPD). It was applied to identify chromatin structures, which are in better agreement with the available experimental data than previously proposed model structures (20,25).
Materials and Methods
Six-angle chromatin computer model and MC simulations
Numerical phase diagrams were created based on the six-angle computer model of chromatin (20,21,25). In this model, nucleosomes are represented by a spherocylindrically shaped potential that interacts between different nucleosomes. The nucleosomes are connected via linker DNA segments (Fig. 1 A). The two-angle model (31) is extended by additional degrees of freedom to account for certain nucleosome and chromatosome geometries (20). The actual opening angle, here denoted as ψ, is determined by the entry-exit angles α and γ measured parallel and perpendicular to the flat side of the nucleosome cylinder, respectively (Fig. 1 A). The energy of the system is a sum of different contributions as described previously (20,21,25). These comprise 1), the elastic properties of DNA modeled by harmonic potentials for stretching, torsion, and bending; 2), the electrostatic repulsion of the DNA described by a Debye-Hückel approximation and parameterized for a salt concentration of 100 mM NaCl; 3), the nucleosome-nucleosome interaction potential calculated from a series expansion in S-functions; and 4), the excluded volume between DNA segments and nucleosomes described by a soft core repulsive potential. A detailed description of the six-angle model and all energy terms is given in the Supporting Material, and the simulation parameters are listed in Table S1.
Figure 1.

(A) Schematic description of the six-angle model of chromatin. The nucleosomes are connected by pieces of elastic DNA with length l (depicted as springs). The nucleosomes are shown as cylinders; however, they are represented by an anisotropic potential as spherocylindrical particles. The angles α, γ, and β describe the DNA path between consecutive nucleosomes, and ϕ, ɛ, and δ describe the nucleosome orientation relative to the incoming and outgoing linker DNA. The parameter c is the distance from the center of the histone core to the start of the linker DNA and can describe a nucleosome stem structure (16,17). The gap between the two DNA strands leaving and entering the chromatosome core particle at this point is denoted by d. For more details, see the Supporting Material. (B) Denotation of the chromatin fiber structures by nucleosome stacks and DNA path according to Depken and Schiessel (37). A sample fiber structure is shown (left: side view, right: top view). A helical winding of the chain is described by [Nstack, Nstep], where Nstack is the number of nucleosome stacks and Nstep is the step size across stacks between connected nucleosomes. A seven-start helix with different linker DNA paths (black lines) is shown with solenoidal ([7, 1]) and crossed-linker DNA ([7, 2] and [7, 3]) paths. The dashed line marks the linker DNA to the nucleosome of the next turn.
A given chromatin fiber structure is referenced by the denotation introduced by Depken and Schiessel (37). The folding of the nucleosome chain is described by two parameters [Nstack, Nstep], where Nstack (corresponding to Nrib in Depken and Schiessel (37)) is the number of top-on-top nucleosome stacks, and Nstep is the step size between connected nucleosome stacks (Fig. 1 B). For example, the solenoid model is described by [1, 1], two-start fibers by [2, 1], and ID fiber models with various numbers of nucleosome stacks n by [n, 1] with n > 2. Fiber models with crossed-linker DNA are characterized by higher step numbers Nstep, e.g., a five-start helix [5, 2] or seven-start helix [7, 3] (Fig. 1 B). Chromatin fibers with irregular or no stacking of nucleosomes cannot be represented by this denotation.
For the computation of numerical DPDs, MC simulations were conducted. A Metropolis MC algorithm with rotation and pivot moves was used (21,25). Selected structures were subjected to extended simulations to achieve a representative sample of conformations in thermal equilibrium. The number of simulation steps was chosen such that at least 200 statistically uncorrelated conformations were generated. For the phase diagrams, structures were parameterized to have a maximal nucleosome-nucleosome attraction energy Emax of 6 kBT. Additional simulations were conducted with Emax of 9 and 12 kBT with a replica exchange procedure, with up to 160 replicas used to avoid trapping into local energy minima (25).
Chromatin fiber models
Phase diagrams were investigated for three different nucleosome geometries selected from recent studies (Fig. S1 and Table S2 of the Supporting Material): 1), the crossed-linker (CL) two-start helix geometry derived from the tetranucleosome crystal structure with an NRL of 169 bp (13,20); 2), a crossed-linker model with a nucleosome stem structure (CLS), where the stem size represents the conformation introduced by binding of the linker histone H5. This model was parameterized to fit the data of native chromatin of chicken erythrocytes with an NRL of 212 bp (21,25); and 3), the ID geometry model, which represents a model for reconstituted chromatin in the presence of linker histones with high mass densities for NRLs of 187, 197, and 207 bp (15,20). The CLS geometry can be described by the two-angle model (31), whereas the CL and ID models require the six-angle model (20).
Numerical phase diagrams
Numerical phase diagrams of chains with 100 nucleosomes were examined for the opening angle ψ as a function of α and γ, and the nucleosome twist angle β. For the static phase diagrams, the continuous two-dimensional space was divided into steps of 1° in the range of 0–180° and 0–359° for ψ and β, respectively. For smaller ranges of ψ, steps of 0.5° were used. The remaining parameters of the six-angle model were kept at the values of the respective model (Table S2). In the static phase diagrams, all chromatin conformations were considered to be fully relaxed in terms of the elastic DNA potentials for bending, torsion, and stretching. Thus, in the initial conformations, the DNA elastic energies made no contribution to the total energy. Only energy terms for the electrostatic interaction between the linker DNA, the internucleosomal interaction, and the DNA-nucleosome excluded volume potential contributed to the total energy. A threshold of 1000 kBT for the total energy was chosen to distinguish between sterically possible and impossible conformations. Phase diagrams were also created to visualize the energy associated with a given fiber conformation.
For each configuration of the DPDs, an MC simulation with 107 simulation steps was performed. Chromatin structures were evaluated in terms of the energies determined for the last conformation of the simulated trajectory. Furthermore, experimentally accessible properties such as diameter, linear mass density, and fiber shape, as described previously (25), were systematically investigated. To reduce computing time, the step width of the raster in the DPDs was enlarged by a factor of 5.
Results
The static phase diagram of the CLS model reveals stability differences between chromatin fiber conformations
Corresponding to previous investigations of the CLS geometry (18,21,25), the opening angle ψ was chosen to fulfill the condition γ = 0 and ψ = α, so that the phase diagram could be compared with previous phase diagrams of the two-angle model (32–35) (Fig. 2 A). The result is depicted in Fig. 2 B. In some regions, especially at the border between sterically possible and impossible conformations, the energies were significantly above average. This is caused by the electrostatic repulsion of linker DNA in close proximity (Fig. S2 A). In particular, conformations with more than three nucleosome stacks and a crossed-linker DNA path exhibited high electrostatic energies, e.g., [5, 2] and [7, 3] fibers (Fig. 2 B, fibers 5 and 7). The low-energy regions were usually associated with a favorable nucleosome-nucleosome attraction term (Fig. S2 B). In addition to nucleosome stacking, optimal lateral orientation of two nucleosomes can yield significant attraction energy (25). Accordingly, interdigitated [n, 1] conformations with n > 4 and closely arranged nucleosome stacks led to the lowest energy (Fig. 2 B, fibers 11–16). The [2, 1] zig-zag (Fig. 2 B, fibers 1–4) and interdigitated [3, 1] and [4, 1] (Fig. 2 B, fibers 8–10) fibers displayed the broadest energy valleys. It is noted that a recently developed model for chromatin of chicken erythrocytes (25) is located in the sterically forbidden area in the absence of DNA bending/twisting (Fig. 2 B, fiber 6).
Figure 2.
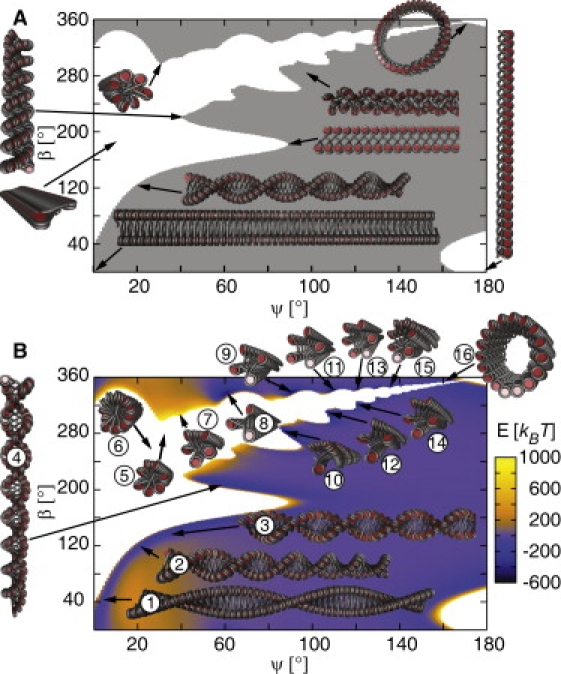
Static energy phase diagrams of the CLS geometry with NRL = 212 bp for the opening angle ψ (γ = 0) and the nucleosome twist angle β with a step width of 1°. Fiber conformations with sterical overlaps are represented in white. (A) A classical phase diagram representation in which the region of fiber conformations without sterical overlaps is depicted in gray. (B) A phase diagram showing the energy E associated with a given fiber conformation. The diagram exhibits regions of very high energy caused by electrostatic DNA repulsion. These include fibers with crossed-linker DNA, e.g., [5, 2], [11, 5] and [7, 3] (fibers 5–7). In contrast, [2, 1] zig-zag fiber conformations (fibers 1–4) and [3, 1] and [4, 1] fibers (fibers 8–10) have the broadest energy valleys, whereas [n, 1] structures with n > 4 exhibit lower energy values but smaller valleys (fibers 11–16). Fiber 6 represents our previous model of chromatin from chicken erythrocytes (25).
The energy landscape of the static phase diagram depends strongly on the nucleosome geometry
Energy phase diagrams were also created for the CL and ID models. For the CL geometry, the condition γ = −α was used, which corresponds to the tetranucleosome model structure (20). The resulting energy phase diagram differed significantly from the CLS model with respect to the shape of the sterically forbidden region and energy values (Fig. 3 A). Two-start helix conformations ([2, 1] fibers) displayed the deepest and broadest energy valley (Fig. 3 A, fibers 1–4) but were also found to be associated with high energies (Fig. 3 A, fibers 5 and 6). Furthermore, conformations with an increased number of nucleosome stacks (e.g., [4, 1], [5, 1], and [8, 1] fibers (Fig. 3 A, fibers 7–10)) were present, but were not located within the low-energy valleys.
Figure 3.
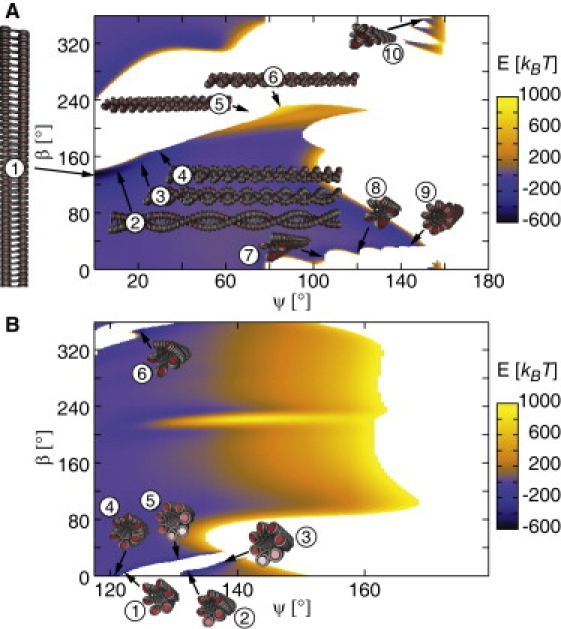
Static energy phase diagrams of different nucleosome geometries for the opening angle ψ and the nucleosome twist angle β. (A) CL geometry with NRL = 169 bp. The step width for ψ and β is 1° and the opening angle ψ results from the condition γ = −α. A broad energy valley exists for [2, 1] conformations (fibers 1–4). More compact [n, 1] fibers with n > 4 exhibit no apparent energy valleys (fibers 7–10). Fiber 5 is our previous model based on the tetranucleosome crystal structure (20). (B) ID geometry with NRL = 197 bp. The angle α was set to 117.5°, and γ was varied to achieve the actual angle ψ. Step widths of 0.5° and 1° were used for ψ and β, respectively. Most of the sterically possible regions in the diagram with large opening angles led to high energies. The [5, 1], [6, 1], and [7, 1] fibers with opening angles between 120° and 140°, and twist angles < 40° yielded the lowest energy (fibers 1–3, 5, and 6). Fiber 4 is the previously derived model for chromatin fibers reconstituted on arrays of strong nucleosome positioning elements (20).
For the ID geometry, α was set to the previously selected value of 117.5° (20), and γ was varied to obtain the opening angle ψ plotted in the phase diagram. For an NRL of 187 bp, broad low-energy valleys were apparent (Fig. S3 A). Notably, for 197 bp (Fig. 3 B) and in particular for 207 bp (Fig. S3 B), these regions disappeared. In all diagrams for the ID geometry, the low-energy regions were present near the border that separates sterically possible and impossible conformations (Fig. 3 B and Fig. S3). These were [n, 1] fibers with n > 4, which are energetically advantageous due to the high number of nucleosome stacks. For the CL (Fig. 3 A, fiber 5) and ID geometry with NRLs of 187 (Fig. S3 A, fiber 2) and 207 bp (Fig. S3 B, fiber 1), the states of the previous developed models (20) were found to be located in sterically forbidden areas, since DNA deformations to avoid clashing of nucleosomes were not allowed in the static phase diagrams.
Sterically impossible conformations can be transformed into energetically favorable ones by DNA bending and twisting
A subset of conformations of the static phase diagrams was simulated for 107 MC steps to create DPDs. During the simulation, fiber conformations changed due to DNA bending and twisting. The resulting phase diagrams differed considerably from the static ones. Most of the initially forbidden areas became populated (Fig. 4 and Fig. S4). For the CLS geometry, [n, 1] fiber conformations with n > 3 led to the lowest energy (Fig. 4 A, fibers 5, 6, 8, and 9). However, [2, 1] and [3, 1] fiber conformations were also energetically favorable (Fig. 4 A, fibers 1–4 and 7). The CL geometry retained the initial [2, 1] type fibers as the most favorable conformation but became slightly more irregular and less dense (Fig. 4 B). For the ID geometry with an NRL of 197 bp, a large low-energy region with mostly [6, 1] and [7, 1] fiber conformations appeared (Fig. 4 C). For an NRL of 187 bp, the DPD yielded extended low-energy regions for [5, 1] and [6, 1] fiber conformations (Fig. S4 A). For an NRL of 207 bp, only [n, 1] fiber conformations with n > 11 and large diameters (>47 nm) retained their fiber-like shape (Fig. S4 B). In general, the energetically most favorable regions occurred near the border between previously sterically possible and impossible conformations in the DPDs of the different fiber types.
Figure 4.
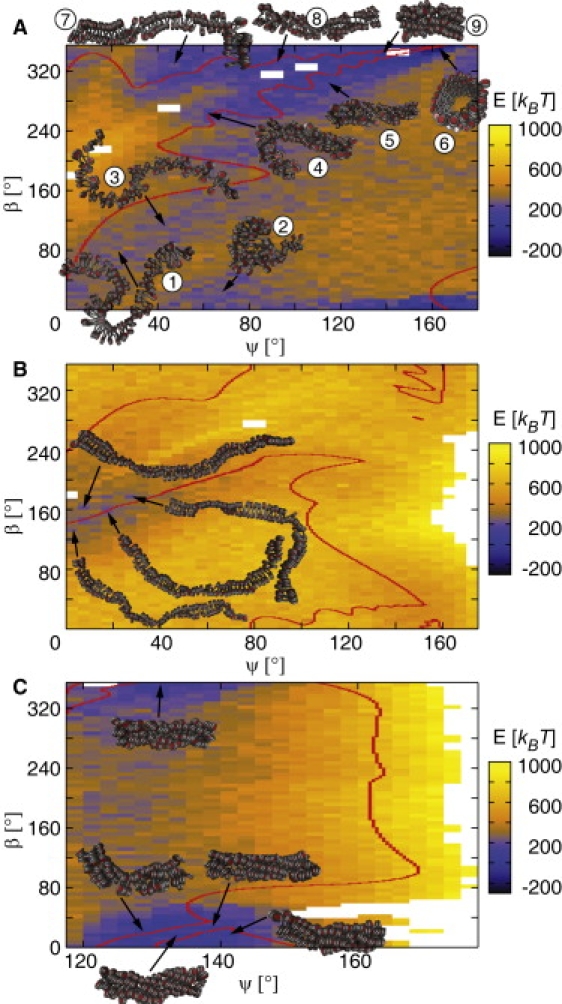
Dynamic energy phase diagrams for the opening angle ψ and the nucleosome twist angle β (corresponding to Figs. 2 and 3). The red contour lines indicate the former borderline between sterically possible and impossible conformations of static phase diagrams (Figs. 2 and 3). Chromatin structures became more irregular. Most of the conformations that initially were sterically forbidden became possible and, in part, even energetically favorable. (A) CLS geometry with NRL = 212 bp. Structures that were initially located in regions of low energy mostly retained their shape (fibers 1, 3, 5, 6, 8, and 9). Fiber structures with more than four nucleosome stacks and crossed-linker DNA, e.g., [5, 2], [7, 3] and [11, 5] (Fig. 2B, fibers 5–7), transformed to [3, 1] fibers (fibers 4 and 7). (B) CL geometry with NRL = 169 bp. The initially existing energy valley broadened, with [2, 1] fibers being the energetically most favorable conformations. The [n, 1] fibers with n > 4 (Fig. 3A, fibers 7–10) were unstable (data not shown). (C) ID geometry with NRL = 197 bp. The [5, 1] and [6, 1] conformations retained their fiber-like structure and were the energetically most favorable.
For the CL geometry, the recently developed chromatin model based on the tetranucleosome crystal structure was initially located in the forbidden region of the phase diagram (Fig. 3 A, fiber 5) (20). This DPD was searched for energetically more favorable structures that satisfy the properties of the tetranucleosome structure. A [2, 1] fiber conformation (ψ = 25°, β = 175°) was found in a broad energy valley, which was further investigated in thermal equilibrium by extensive MC simulation (Fig. 5 A). Properties were computed as mean values from the resulting ensemble (Table 1). The newly identified structure had average values of 27.8 nm diameter, 2.9 nucleosomes/11 nm fiber linear mass density, and a 136 kBT lower total energy than the previously constructed model (Table S3).
Figure 5.
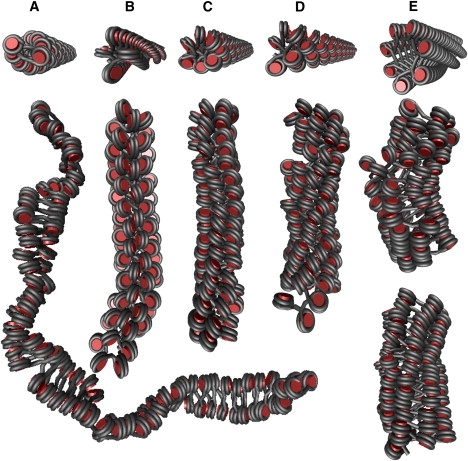
New structures for the CL and ID geometries derived from the numerical phase diagrams. The first row shows the initial structures as created in the static phase diagrams. The second row depicts sample fibers of the Boltzmann ensemble generated by extended MC simulations. The detailed properties of each structure are presented in Table 1. (A) CL geometry with 169 bp led to a [2, 1] fiber (ψ = 25°, β = 175°) with a mean diameter of 27.8 nm and a mean linear mass density of 2.9 nucleosomes/11 nm fiber. (B) ID fibers for NRL = 187 bp (ψ = 117.5°, β = 295°) with nucleosomes parallel to the chromatin fiber axis. The structure exhibits an open top-on-top stacking of nucleosomes with an average diameter of ∼31 nm and mean linear mass density of 7.1 nucleosomes/11 nm fiber. (C) ID fibers for NRL = 187 bp (ψ = 125°, β = 355°) with nucleosomes nearly perpendicular to the chromatin fiber axis exhibits a [6, 1] fiber conformation. Average diameter and mass density were similar to the structure depicted in panel B. (D) ID fiber with NRL = 197 bp (ψ = 130°, β = 355°) yielded a [6, 1] fiber conformation with a mean diameter of 35.9 nm and a mean linear mass density of 8.1 nucleosomes/11 nm fiber. (E) ID fibers with NRL = 207 bp (ψ = 133°, β = 23°). The second and third rows show examples of a fiber simulated with Emax of 9 and 12 kBT, respectively. For 9 kBT, [7, 1], [8, 1], and [9, 1] fiber conformations (in part mixed within the chain) occurred, whereas for 12 kBT more regular [7, 1] and [8, 1] fiber conformations appeared. Both structures had a mean diameter of ∼45 nm and linear mass densities of 9.9 (9 kBT) and 12.8 nucleosomes/11 nm fiber (12 kBT).
Table 1.
New model structures derived from numerical phase diagrams further investigated by MC simulations
| Geometry | NRL (bp) | ψ (°) | α (°) | γ (°) | β (°) | Emax (kBT) | Fiber type [Nstack, Nstep] | Diameter (nm) | Linear mass density (nucleosomes/11 nm fiber) |
|---|---|---|---|---|---|---|---|---|---|
| CL | 169 | 25 | 17.7 | −17.7 | 175 | 6 | [2, 1] | 27.8 ± 0.5 | 2.89 ± 0.06 |
| ID | 187 | 117.5 | 117.5 | 0 | 295 | 6 | — | 30.9 ± 0.15 | 7.1 ± 0.23 |
| ID | 187 | 125 | 117.5 | −54.23 | 355 | 6 | [6, 1] | 31.3 ± 0.25 | 7.8 ± 0.25 |
| ID | 197 | 130 | 117.5 | −70.89 | 355 | 6 | [6, 1] | 35.9 ± 0.7 | 8.1 ± 0.6 |
| ID | 207 | 133 | 117.5 | −79.54 | 23 | 6 | — | — | — |
| ID | 207 | 133 | 117.5 | −79.54 | 23 | 9 | [7, 1], [8, 1], [9, 1] | 45 ± 1.21 | 9.9 ± 1.25 |
| ID | 207 | 133 | 117.5 | −79.54 | 23 | 12 | [7, 1], [8, 1] | 45.4 ± 0.42 | 12.8 ± 0.37 |
The remaining parameters of the six-angle model correspond to the values in Table S2. The values (mean and standard deviation) for the diameter and linear mass density were computed from the statistical ensemble in thermal equilibrium. The ID structure with ψ = 117.5 and β = 295 exhibited no distinct nucleosome stacking, and no fiber structure was achieved for the ID geometry with NRL = 207 bp and Emax = 6 kBT.
New stable ID fiber conformations were detected in the numerical phase diagram analysis
Recently developed models for the ID geometry were reevaluated to identify structures that were in better agreement with the experimental data from electron microscopy images of reconstituted chromatin. For NRLs of 187–207 bp, a diameter of ∼33 nm and a linear mass density of ∼11 nucleosomes/11 nm fiber were measured. Fibers with higher NRLs had ∼44 nm diameter and a linear mass density of ∼15 nucleosomes/11 nm (15). For an NRL of 187 bp, the DPD revealed two types of ID fiber conformations. The first type (ψ = 117.5°, β = 295°) contained nucleosomes with parallel alignment to the fiber axis (Fig. 5 B). However, in the other [6, 1] fiber (ψ = 125°, β = 355°), nucleosomes were stacked nearly perpendicular to the fiber axis (Fig. 5 C). Longer MC simulations revealed that both fiber-like structures were stable in thermal equilibrium, with a mean diameter of ∼31 nm and mean linear mass densities of 7.1 (ψ = 117.5°, β = 295°) and 7.8 nucleosomes/11 nm fiber (ψ = 125°, β = 355°) (Table 1). For an NRL of 197 bp, a [7, 1] fiber (ψ = 130, β = 355) was the lowest-energy structure that agreed with the experimental data (Fig. 5 D). Long MC simulations of this conformation yielded a mean diameter of 35.9 nm and a mean linear mass density of 8.1 nucleosomes/11 nm fiber (Table 1).
A systematic search of the DPD computed for the ID geometry with 207 bp revealed that most of the fiber-like conformations with diameters between 30 and 40 nm were not stable in the simulation, whereas fibers with diameters > 47 nm were (Fig. S4 B, and data not shown). Thus, the static phase diagrams were used to identify structures with specific features derived from the experimental studies. Several of these fiber conformations showed an excellent agreement in terms of diameter and mass density (15). The conformations with the lowest energies were further investigated with higher Emax values by replica exchange simulations. The results indicated that fiber conformations with diameters < 40 nm were not stable even with Emax of 12 kBT (data not shown). However, the conformation with ψ = 133° and β = 23° formed stable fiber conformations for Emax of 9 and 12 kBT (Fig. 5 E). For Emax = 9 kBT, the simulated trajectory exhibited different nucleosome stacking patterns: [7, 1], [8, 1] and [9, 1], which appeared, in part, in a single fiber. For Emax = 12 kBT, more regular fibers with [7, 1] and [8, 1] stacking patterns were found. In some cases, the fiber started with seven stacks and ended with eight stacks. The structures had a diameter of ∼45 nm and linear mass densities of 9.9 (9 kBT) and 12.8 nucleosomes/11 nm fiber (12 kBT) (Table 1).
Discussion
Sterically possible chromatin fiber conformations
The static phase diagram for the CLS geometry (Fig. 2 A) reveals a variety of sterically possible structures. These include planar structures without nucleosome stacking, as well as zig-zag and interdigitated fibers, and depict a conformational space that is equivalent to that determined in analytical studies of the two-angle model (33,35). The shape of the forbidden region is similar to the phase diagram reported by Barbi et al. (32) even though the approach presented here is based on energy computation instead of geometric descriptions. In previous phase diagram investigations, it was concluded that the most compact fiber conformations exist at the border of the forbidden area (33,34), which is in agreement with the results presented here (Figs. 2 and 3, and Fig. S3). In contrast to previous phase diagram investigations (32–36), however, our numerical diagrams were computed with an increased conformation flexibility as given by the six-angle model. This allowed the systematic investigation of geometries that cannot be represented by the two-angle model but are of biological relevance, as discussed previously (20).
Energetically favorable chromatin fiber conformations
The static energy phase diagrams revealed a wide range of energetically unfavorable and favorable conformations (Figs. 2 and 3, and Fig. S3). Regions with high energy resulted mostly from electrostatic repulsion of linker DNA in close proximity, which is pronounced at the border between sterically possible and impossible conformations (Fig. S2 A). In contrast, regions of low electrostatic repulsion of linker DNA segments showed no specific location within the regions that defined a favorable conformation regime (Figs. 2 and 3, Fig. S2 A, and Fig. S3). This is in agreement with the results of different DNA repulsion energies in previously reported phase diagrams (33). Regions of low energy correlated with densely stacked nucleosomes (Fig. 2 B and Fig. S2 B), as previously found for the tetranucleosome crystal structure (13), electron microscopy images of reconstituted chromatin (15), and liquid crystals of nucleosome core particles (38).
As expected, the different nucleosome geometries had distinct low-energy conformations (Figs. 2 and 3, and Fig. S3). For the two-angle geometry of the CLS model, favorable [2, 1], [3, 1] and [4, 1] fiber conformations were found. Furthermore, [n, 1] fiber conformations with n > 4 (associated with larger fiber diameters) had lower energies but were located in narrower energy valleys, which are less favorable in terms of entropy. This type of interdigitated fiber was also found to be energetically most favorable for the ID geometry (Fig. 3 B and Fig. S3). Recently, similar fiber conformations were identified by a new geometric analysis based on the stacking of nucleosomes, which fit the experimental data mentioned above (37). Crossed-linker [5, 2] and [7, 3] fiber conformations were proposed to be more favorable than [5, 1], [7, 1], and [7, 2] fibers with bent linker DNA. In the analysis of the chromatin fiber stability conducted here, the crossed-linker fiber conformations with more than three nucleosome stacks (e.g., [5, 2] and [7, 3] fibers (Fig. 2 B, fibers 5 and 7)) were energetically unfavorable due to high electrostatic repulsion. These and similar crossed-linked fiber conformations were unstable during the simulations and changed to other conformations (see below). However, for [n, 1] fibers with n > 4, the nucleosome arrangement proposed by Depken and Schiessel (37) led to stable fiber conformations (Fig. 4, Fig. S3, and Fig. S4). Cooperative binding of H1 (4,29,30), binding of other architectural proteins such as HP1 (39), higher internucleosomal attraction (25,40), or different salt conditions (22,23,26–28) could stabilize conformations with crossed-linker DNA. Furthermore, straight and bent linker DNA may appear simultaneously in compacted chromatin fibers, as demonstrated in investigations of nucleosome interactions by cross-linking experiments and MC simulations (22).
In contrast to the CLS and ID geometries, the CL geometry favored [2, 1] two-start fiber conformations (Figs. 3 A and 4 B). This finding supports the previously proposed model in which the [2, 1] CL fibers represent chromatin fibers without linker histones, and the ID geometry represents the structure induced by binding of linker histones (20). This is in good agreement with experimental data of reconstituted chromatin fibers (4,15), the tetranucleosome crystal structure (13), and experimental data and computer simulations of oligonucleosomes with and without linker histones (22).
Chromatin fiber stability and ability to buffer local structure modifications
The DPDs revealed the stability of different fiber conformations. Crossed-linker fibers with more than three nucleosome stacks generally evolved into [3, 1] fibers (Fig. 4 A, fibers 4 and 7). This type of fiber was previously proposed as a model for chromatin of chicken erythrocytes (Fig. S1 B) (25). Furthermore, increased contacts between nucleosomes i and i + 3 appeared in part for compacted oligonucleosomes with linker histone and divalent cations investigated by cross-linking experiments and MC simulations (22).
The width of the energy valleys can serve as an indicator for the probability of fiber conformations because it reflects a favorable entropic contribution for the corresponding type of structures. In these regions, small changes in the nucleosome geometry, such as those induced by entropic effects, changes in salt concentration, or histone modifications, would lead only to small changes in the stability of the fiber. For instance, the [2, 1] fibers of the CL and CLS geometry were located in relatively broad energy valleys in the static phase diagrams (Figs. 2 B, fibers 1–4, and 3 A, fibers 1–4). The DPDs revealed that these fiber structures mostly retained their conformation in thermal equilibrium, but with a more irregular structure as compared to the initial states (Fig. 4 A, fibers 1 and 3, and Fig. 4 B). In contrast, conformations located in narrow energy valleys were limited in their conformational flexibility. Hence, they could represent states that are particularly responsive to regulatory changes that control the accessibility of the DNA for protein complexes involved in genome functions. For instance, the [n, 1] CLS conformations with n > 3 were located in a very narrow energy valley (Fig. 2 B, fibers 9–16). Even moderate differences of the opening angle and nucleosome twist angle would lead to considerable changes of these structures.
Due to entropic effects, all fiber conformations investigated became more irregular during the simulations (Fig. 4 and Fig. S4), which is in agreement with the behavior of native chromatin (41,42). Furthermore, fiber conformations that were sterically impossible with relaxed DNA in the initial structure transformed in many cases into energetically favorable states (Fig. 4 and Fig. S4). This behavior was most pronounced at the border, where energetically favorable fiber conformations were located. Structures with steric overlaps changed into those energetically more favorable states, which in turn required additional DNA bending and torsion.
In the set of simulations presented in Fig. 4 and Fig. S4, the DPDs were used to investigate the stability of the fiber conformations. Due to the limited number of MC simulation steps conducted for each structure, thermal equilibrium was reached only in some cases. However, 107 MC steps were sufficient to cause striking changes, e.g., from a sterically impossible [11, 5] to a favorable [3, 1] fiber conformation (Figs. 2 B and 4 A). Moreover, the extended simulation of the newly identified structures conducted here, as well as in our previous works, resulted in similar energy values as compared to the corresponding structures of the DPDs (Table S3). Thus, the simulated structures in the DPDs typically were close to thermal equilibrium after 107 MC steps. However, a reliable evaluation can only be made from additional simulations in which it is confirmed that thermal equilibrium has been reached.
Models for the tetranucleosome structure and reconstituted chromatin fibers
The newly identified [2, 1] fiber conformation for the CL geometry (Fig. 5 A and Table 1) is similar to the recently developed model based on the tetranucleosome crystal structure (Fig. S1 A and Table S2) in terms of the diameter and mass density (20). However, it has a significantly lower total energy due to reduced DNA bending and torsion. Both model structures are less compact than predicted from a simple repetition of the tetranucleosome crystal structure (13). This is in good agreement with electron microscopy images of reconstituted chromatin fibers without linker histones, which displayed very similar [2, 1] fibers (4).
For the ID geometry with an NRL of 187 bp, two possible fiber conformations were identified (Fig. 5, B and C, and Fig. S4 A): one with nucleosomes parallel (Fig. 5 B), and one with nucleosomes nearly perpendicular (Fig. 5 C) to the chromatin fiber axis (both with a mean diameter of 31 nm). The first is similar to the ID model of reconstituted chromatin that was recently proposed by Robinson et al. (15), whereas the latter [6, 1] fiber conformation corresponds to the proposed model of Daban and Bermúdez (14) and is similar to the recently reported model structures of Depken and Schiessel (37). The first model is in contrast to fibers with optimal stacking of nucleosomes (38), which served as the basis for various previously proposed models (14,37,43,44). MC simulations of similar ID fibers with parallel nucleosome orientation indicated that these structures were not stable in thermal equilibrium (20). Moreover, parallel and perpendicular nucleosome orientations with respect to the fiber axis were investigated for solenoid and zig-zag fibers by means of MC simulations (23). In comparison to parallel oriented nucleosomes, the perpendicular orientation resulted in a lower total energy with more realistic sedimentation coefficients. However, the apparent unfavorable parallel nucleosome orientation could be stabilized by additional linker histone interactions (4,29,30).
The MC simulations of conformations with NRLs ≥ 197 bp conducted here within the framework of the DPD analysis identified new stable fiber types (Fig. 5, D and E, and Table 1). For a 197 bp NRL, a [6, 1] fiber conformation with a mean diameter of 36 nm was found, which is in good agreement with experimental data (15). With an NRL of 207 bp, the mean diameter increased to ∼45 nm, which corresponds to the experimental results for an NRL of 217 bp (15). However, these structures were less densely packed than those reported in experimental studies (4,15). Higher fiber compaction or smaller diameters could be induced by elevated internucleosomal interaction energies (25), cooperative binding of linker histones (4,29,30), or divalent cations (22) as used for the reconstitution of chromatin fibers (4,15). For an Emax of 6 kBT, the DPDs for an NRL of 207 bp showed that most fiber-like conformations were not stable in the simulations. This is caused by high electrostatic repulsion of long DNA linkers and entropic effects, as observed in previous MC simulations (20,25). However, fiber conformations with an unrealistically high number of nucleosome stacks (>11) and large diameters (>47 nm) (Fig. S4 B) or with Emax ≥ 9 kBT (Fig. 5 E and Table 1) retained their fiber-like structures. It is therefore concluded that in reconstituted fibers with greater linker lengths, the maximum internucleosomal interaction energy Emax has to be at least 9 kBT to overcome entropic and/or high electrostatic DNA repulsion forces. This agrees with the results of recent force spectroscopy experiments (N. Kepper, R. Ettig, R. Stehr, G. Wedemann and K. Rippe, unpublished results). Even higher interaction energies of 10–16 kBT were inferred from a force spectroscopy study of reconstituted nucleosome arrays (40).
The new ID fiber type conformations identified here were more irregular than those proposed in previous studies (14,15,37,43). Of interest, stable fiber structures were found in different conformations (e.g., [7, 1] and [8, 1]) as well as in hybrid conformations that exhibited different nucleosome stacking patterns within a single chain of 100 nucleosomes. This points to a heterogeneity of fiber conformation that may be biologically relevant for establishing local variations of the structures associated with functionally different genomic elements.
Conclusions
The numerical phase diagrams introduced here provide a new approach for combining geometric and energetic aspects for systematic investigations of the folding of the nucleosome chain. The approach implemented in our DPD analysis closes the gap between static phase diagrams and MC simulations of single chromatin fibers. Energetically favorable and stable fiber conformations that reflect certain geometric features can be identified and then further investigated at thermal equilibrium by extended MC simulations. In general, comparisons of the static phase diagrams and DPDs revealed that several unfavorable or sterically impossible fiber conformations evolved into energetically favorable states. Thus, computation of the DPDs allows for a more comprehensive exploration of the conformational space that is available for folding of the nucleosome chain than previously used approaches. Our results show that crossed-linker chromatin fibers with more than three nucleosome stacks were energetically unfavorable and unstable due to high electrostatic repulsion of linker DNA (Figs. 2 B and 4 A). Higher mass densities (>6 nucleosomes/11 nm fiber) were achieved with interdigitated fiber conformations. In addition, recently investigated model structures (20,25) were reevaluated to yield a better agreement with experimentally determined features (Fig. 5 and Table 1). A refined two-start helix fiber conformation (Fig. 5 A) was identified for chromatin without linker histone and low mass density with features that correspond to the tetranucleosome crystal structure (13). Furthermore, fiber conformations retrieved from the DPDs were in agreement with experimental data for reconstituted chromatin with fully saturated linker histone content (15). These include a fiber conformation with an NRL of 187 bp and nucleosomes oriented parallel to the fiber axis (Fig. 5 B). ID six-start helix fibers with nucleosomes perpendicular to the fiber axis were identified for NRLs of 187 (Fig. 5 C) and 197 bp (Fig. 5 D). For an NRL of 207 bp, corresponding seven- to nine-start helix fibers (Fig. 5 E) were found to adopt stable fiber conformation when the maximum internucleosomal interaction energy was at least 9 kBT. Thus, for NRLs ≥ 197 bp, several new model structures were derived from the DPDs that extend the regime of stable fiber conformations as compared to that reported in our previous studies (20). In summary, the computation of DPDs allows one to investigate the many degrees of freedom of chromatin fiber conformations in relation to their stability in a systematic and comprehensive manner. This in turn makes it possible to identify conformations that satisfy experimentally determined criteria of interest, and to assign well-defined conformational states to the polymorphic nucleosome chain to elucidate its function as a dynamic regulator of DNA accessibility.
Acknowledgments
This study was supported in part by the Volkswagen Foundation (New Conceptual Approaches to Modeling and Simulation of Complex Systems) and the Deutsche Forschungsgemeinschaft (grant Ri 1283/8-1 to K.R.). The simulations were conducted under project mvb00007 of the North German Supercomputing Alliance.
Supporting Material
References
- 1.van Holde K.E. Springer; Heidelberg: 1989. Chromatin. [Google Scholar]
- 2.Woodcock C.L., Dimitrov S. Higher-order structure of chromatin and chromosomes. Curr. Opin. Genet. Dev. 2001;11:130–135. doi: 10.1016/s0959-437x(00)00169-6. [DOI] [PubMed] [Google Scholar]
- 3.Robinson P.J., Rhodes D. Structure of the ‘30 nm’ chromatin fibre: a key role for the linker histone. Curr. Opin. Struct. Biol. 2006;16:336–343. doi: 10.1016/j.sbi.2006.05.007. [DOI] [PubMed] [Google Scholar]
- 4.Routh A., Sandin S., Rhodes D. Nucleosome repeat length and linker histone stoichiometry determine chromatin fiber structure. Proc. Natl. Acad. Sci. USA. 2008;105:8872–8877. doi: 10.1073/pnas.0802336105. [DOI] [PMC free article] [PubMed] [Google Scholar]
- 5.Henikoff S. Nucleosome destabilization in the epigenetic regulation of gene expression. Nat. Rev. Genet. 2008;9:15–26. doi: 10.1038/nrg2206. [DOI] [PubMed] [Google Scholar]
- 6.Tremethick D.J. Higher-order structures of chromatin: the elusive 30 nm fiber. Cell. 2007;128:651–654. doi: 10.1016/j.cell.2007.02.008. [DOI] [PubMed] [Google Scholar]
- 7.Wachsmuth M., Caudron-Herger M., Rippe K. Genome organization: balancing stability and plasticity. Biochim. Biophys. Acta. 2008;1783:2061–2079. doi: 10.1016/j.bbamcr.2008.07.022. [DOI] [PubMed] [Google Scholar]
- 8.Luger K. Dynamic nucleosomes. Chromosome Res. 2006;14:5–16. doi: 10.1007/s10577-005-1026-1. [DOI] [PubMed] [Google Scholar]
- 9.Hansen J.C. Conformational dynamics of the chromatin fiber in solution: determinants, mechanisms, and functions. Annu. Rev. Biophys. Biomol. Struct. 2002;31:361–392. doi: 10.1146/annurev.biophys.31.101101.140858. [DOI] [PubMed] [Google Scholar]
- 10.Woodcock C.L., Skoultchi A.I., Fan Y. Role of linker histone in chromatin structure and function: H1 stoichiometry and nucleosome repeat length. Chromosome Res. 2006;14:17–25. doi: 10.1007/s10577-005-1024-3. [DOI] [PubMed] [Google Scholar]
- 11.Finch J.T., Klug A. Solenoidal model for superstructure in chromatin. Proc. Natl. Acad. Sci. USA. 1976;73:1897–1901. doi: 10.1073/pnas.73.6.1897. [DOI] [PMC free article] [PubMed] [Google Scholar]
- 12.van Holde K., Zlatanova J. What determines the folding of the chromatin fiber? Proc. Natl. Acad. Sci. USA. 1996;93:10548–10555. doi: 10.1073/pnas.93.20.10548. [DOI] [PMC free article] [PubMed] [Google Scholar]
- 13.Schalch T., Duda S., Richmond T.J. X-ray structure of a tetranucleosome and its implications for the chromatin fibre. Nature. 2005;436:138–141. doi: 10.1038/nature03686. [DOI] [PubMed] [Google Scholar]
- 14.Daban J.R., Bermúdez A. Interdigitated solenoid model for compact chromatin fibers. Biochemistry. 1998;37:4299–4304. doi: 10.1021/bi973117h. [DOI] [PubMed] [Google Scholar]
- 15.Robinson P.J.J., Fairall L., Rhodes D. EM measurements define the dimensions of the “30-nm” chromatin fiber: evidence for a compact, interdigitated structure. Proc. Natl. Acad. Sci. USA. 2006;103:6506–6511. doi: 10.1073/pnas.0601212103. [DOI] [PMC free article] [PubMed] [Google Scholar]
- 16.Bednar J., Horowitz R.A., Woodcock C.L. Nucleosomes, linker DNA, and linker histone form a unique structural motif that directs the higher-order folding and compaction of chromatin. Proc. Natl. Acad. Sci. USA. 1998;95:14173–14178. doi: 10.1073/pnas.95.24.14173. [DOI] [PMC free article] [PubMed] [Google Scholar]
- 17.Hamiche A., Schultz P., Prunell A. Linker histone-dependent DNA structure in linear mononucleosomes. J. Mol. Biol. 1996;257:30–42. doi: 10.1006/jmbi.1996.0144. [DOI] [PubMed] [Google Scholar]
- 18.Aumann F., Lankas F., Langowski J. Monte Carlo simulation of chromatin stretching. Phys. Rev. E Stat. Nonlin. Soft Matter Phys. 2006;73:041927. doi: 10.1103/PhysRevE.73.041927. [DOI] [PubMed] [Google Scholar]
- 19.Katritch V., Bustamante C., Olson W.K. Pulling chromatin fibers: computer simulations of direct physical micromanipulations. J. Mol. Biol. 2000;295:29–40. doi: 10.1006/jmbi.1999.3021. [DOI] [PubMed] [Google Scholar]
- 20.Kepper N., Foethke D., Rippe K. Nucleosome geometry and internucleosomal interactions control the chromatin fiber conformation. Biophys. J. 2008;95:3692–3705. doi: 10.1529/biophysj.107.121079. [DOI] [PMC free article] [PubMed] [Google Scholar]
- 21.Wedemann G., Langowski J. Computer simulation of the 30-nanometer chromatin fiber. Biophys. J. 2002;82:2847–2859. doi: 10.1016/S0006-3495(02)75627-0. [DOI] [PMC free article] [PubMed] [Google Scholar]
- 22.Grigoryev S.A., Arya G., Schlick T. Evidence for heteromorphic chromatin fibers from analysis of nucleosome interactions. Proc. Natl. Acad. Sci. USA. 2009;106:13317–13322. doi: 10.1073/pnas.0903280106. [DOI] [PMC free article] [PubMed] [Google Scholar]
- 23.Sun J., Zhang Q., Schlick T. Electrostatic mechanism of nucleosomal array folding revealed by computer simulation. Proc. Natl. Acad. Sci. USA. 2005;102:8180–8185. doi: 10.1073/pnas.0408867102. [DOI] [PMC free article] [PubMed] [Google Scholar]
- 24.Mergell B., Everaers R., Schiessel H. Nucleosome interactions in chromatin: fiber stiffening and hairpin formation. Phys. Rev. E Stat. Nonlin. Soft Matter Phys. 2004;70:011915. doi: 10.1103/PhysRevE.70.011915. [DOI] [PubMed] [Google Scholar]
- 25.Stehr R., Kepper N., Wedemann G. The effect of internucleosomal interaction on folding of the chromatin fiber. Biophys. J. 2008;95:3677–3691. doi: 10.1529/biophysj.107.120543. [DOI] [PMC free article] [PubMed] [Google Scholar]
- 26.Gerchman S.E., Ramakrishnan V. Chromatin higher-order structure studied by neutron scattering and scanning transmission electron microscopy. Proc. Natl. Acad. Sci. USA. 1987;84:7802–7806. doi: 10.1073/pnas.84.22.7802. [DOI] [PMC free article] [PubMed] [Google Scholar]
- 27.Kobori T., Iwamoto S., Ohtani T. Chromatin dynamics of unfolding and refolding controlled by the nucleosome repeat length and the linker and core histones. Biopolymers. 2007;85:295–307. doi: 10.1002/bip.20671. [DOI] [PubMed] [Google Scholar]
- 28.Hammermann M., Tóth K., Langowski J. Salt-dependent compaction of di- and trinucleosomes studied by small-angle neutron scattering. Biophys. J. 2000;79:584–594. doi: 10.1016/S0006-3495(00)76318-1. [DOI] [PMC free article] [PubMed] [Google Scholar]
- 29.Draves P.H., Lowary P.T., Widom J. Co-operative binding of the globular domain of histone H5 to DNA. J. Mol. Biol. 1992;225:1105–1121. doi: 10.1016/0022-2836(92)90108-v. [DOI] [PubMed] [Google Scholar]
- 30.Thomas J.O., Rees C., Finch J.T. Cooperative binding of the globular domains of histones H1 and H5 to DNA. Nucleic Acids Res. 1992;20:187–194. doi: 10.1093/nar/20.2.187. [DOI] [PMC free article] [PubMed] [Google Scholar]
- 31.Woodcock C.L., Grigoryev S.A., Whitaker N. A chromatin folding model that incorporates linker variability generates fibers resembling the native structures. Proc. Natl. Acad. Sci. USA. 1993;90:9021–9025. doi: 10.1073/pnas.90.19.9021. [DOI] [PMC free article] [PubMed] [Google Scholar]
- 32.Barbi M., Mozziconacci J., Victor J.M. How the chromatin fiber deals with topological constraints. Phys. Rev. E Stat. Nonlin. Soft Matter Phys. 2005;71:031910. doi: 10.1103/PhysRevE.71.031910. [DOI] [PubMed] [Google Scholar]
- 33.Diesinger P.M., Heermann D.W. The two-angle model and the phase diagram for chromatin. Phys. Rev. E Stat. Nonlin. Soft Matter Phys. 2005;74:031904–031912. doi: 10.1103/PhysRevE.74.031904. [DOI] [PubMed] [Google Scholar]
- 34.Diesinger P.M., Heermann D.W. The influence of the cylindrical shape of the nucleosomes and H1 defects on properties of chromatin. Biophys. J. 2008;94:4165–4172. doi: 10.1529/biophysj.107.113902. [DOI] [PMC free article] [PubMed] [Google Scholar]
- 35.Schiessel H., Gelbart W.M., Bruinsma R. DNA folding: structural and mechanical properties of the two-angle model for chromatin. Biophys. J. 2001;80:1940–1956. doi: 10.1016/S0006-3495(01)76164-4. [DOI] [PMC free article] [PubMed] [Google Scholar]
- 36.Bešker N., Anselmib C., Santis P.D. Theoretical models of possible compact nucleosome structures. Biophys. Chem. 2004;115:139–143. doi: 10.1016/j.bpc.2004.12.044. [DOI] [PubMed] [Google Scholar]
- 37.Depken M., Schiessel H. Nucleosome shape dictates chromatin fiber structure. Biophys. J. 2009;96:777–784. doi: 10.1016/j.bpj.2008.09.055. [DOI] [PMC free article] [PubMed] [Google Scholar]
- 38.Livolant F., Mangenot S., Durand D. Are liquid crystalline properties of nucleosomes involved in chromosome structure and dynamics? Philos. Transact. A Math. Phys. Eng. Sci. 2006;364:2615–2633. doi: 10.1098/rsta.2006.1843. [DOI] [PubMed] [Google Scholar]
- 39.Woodcock C.L. Chromatin architecture. Curr. Opin. Struct. Biol. 2006;16:213–220. doi: 10.1016/j.sbi.2006.02.005. [DOI] [PubMed] [Google Scholar]
- 40.Kruithof M., Chien F., van Noort J. Subpiconewton dynamic force spectroscopy using magnetic tweezers. Biophys. J. 2008;94:2343–2348. doi: 10.1529/biophysj.107.121673. [DOI] [PMC free article] [PubMed] [Google Scholar]
- 41.Horowitz R.A., Agard D.A., Woodcock C.L. The three-dimensional architecture of chromatin in situ: electron tomography reveals fibers composed of a continuously variable zig-zag nucleosomal ribbon. J. Cell Biol. 1994;125:1–10. doi: 10.1083/jcb.125.1.1. [DOI] [PMC free article] [PubMed] [Google Scholar]
- 42.Leuba S.H., Yang G., Bustamante C. Three-dimensional structure of extended chromatin fibers as revealed by tapping-mode scanning force microscopy. Proc. Natl. Acad. Sci. USA. 1994;91:11621–11625. doi: 10.1073/pnas.91.24.11621. [DOI] [PMC free article] [PubMed] [Google Scholar]
- 43.Wong H., Victor J.-M., Mozziconacci J. An all-atom model of the chromatin fiber containing linker histones reveals a versatile structure tuned by the nucleosomal repeat length. PLoS One. 2007;2:e877. doi: 10.1371/journal.pone.0000877. [DOI] [PMC free article] [PubMed] [Google Scholar]
- 44.Bishop T.C., Hearst J.E. Potential function describing the folding of the 30 nm fiber. J. Phys. Chem. B. 1998;102:6433–6439. [Google Scholar]
Associated Data
This section collects any data citations, data availability statements, or supplementary materials included in this article.