

Abstract
Non-enzymatic glycation of proteins is a post-translational modification produced by a reaction between reducing sugars and amino groups located in lysine and arginine residues or in the N-terminal position. This modification plays a relevant role in medicine and food industry. In the clinical field, this undesired role is directly linked to blood glucose concentration and therefore to pathological conditions derived from hyperglycemia (>11 mm glucose) such as diabetes mellitus or renal failure. An approach for qualitative and quantitative analysis of glycated proteins is here proposed to achieve the three information levels for their complete characterization. These are: 1) identification of glycated proteins, 2) elucidation of sugar attachment sites, and 3) quantitative analysis to compare glycemic states. Qualitative analysis was carried out by tandem mass spectrometry after endoproteinase Glu-C digestion and boronate affinity chromatography for isolation of glycated peptides. For this purpose, two MS operational modes were used: higher energy collisional dissociation-MS2 and CID-MS3 by neutral loss scan monitoring of two selective neutral losses (162.05 and 84.04 Da for the glucose cleavage and an intermediate rearrangement of the glucose moiety). On the other hand, quantitative analysis was based on labeling of proteins with [13C6]glucose incubation to evaluate the native glycated proteins labeled with [12C6]glucose. As glycation is chemoselective, it is exclusively occurring in potential targets for in vivo modifications. This approach, named glycation isotopic labeling, enabled differentiation of glycated peptides labeled with both isotopic forms resulting from enzymatic digestion by mass spectrometry (6-Da mass shift/glycation site). The strategy was then applied to a reference plasma sample, revealing the detection of 50 glycated proteins and 161 sugar attachment positions with identification of preferential glycation sites for each protein. A predictive approach was also tested to detect potential glycation sites under high glucose concentration.
Among post-translational modifications (PTMs)1 of proteins, non-enzymatic glycation is one of the less frequently studied in proteomics. Glycated proteins are formed by a non-enzymatic reaction between reducing carbohydrates (e.g. glucose, fructose, ribose, or derivatives such as ascorbic acid) with amino groups located in the N-terminal position or in lysine and arginine residues. It is worth emphasizing the differences between glycation and glycosylation. The latter is enzymatically catalyzed by glycosyltransferase and occurs in specific protein side chains such as asparagine (N-linked), serine and threonine (O-linked), and the C termini of cell surface proteins (1). Glycosylation is involved in many biological processes in contrast to glycation, which is a completely undesired modification from a clinical point of view.
Because of the crucial role of glucose as an energy source in humans, it is the main circulating sugar and thus the most relevant molecule in terms of protein glycation. The mechanisms involved in glycation are illustrated in Fig. 1 for glucose as the reducing sugar (2). The process starts with the formation of the Schiff base by a condensation reaction between the carbonyl group of the reducing sugar and the amino group of the protein. The next step is the conversion of the thermodynamically unstable Schiff base into the Amadori compound that is considered as the first glycation level. Finally, the Amadori compound undergoes a series of dehydration and fragmentation reactions, generating a variety of carbonyl compounds such as methylglyoxal, glyoxal, glucosones, deoxyglucosones, and dehydroascorbate (3). These carbonyl compounds are generally more reactive than the original carbohydrate and act as propagators by reactions with free amino groups, leading to the formation of a variety of heterogeneous structures irreversibly formed and commonly known as advanced glycation end products. The impact of glycation encompasses alterations of the structure, function, and turnover of proteins (4). Evidently, the effects on biological function will depend on the extent of glycation. From a clinical point of view, the detection of this PTM at the initial stage would be helpful for both prognostic and diagnostic purposes.
Fig. 1.

Scheme of glycation process.
The kinetics of the initial glycation process is governed by the formation of the Amadori compound, a slow process under human physiological conditions (37 °C; ∼5 mm blood glucose concentration in healthy subjects) (5). However, the reaction kinetics is enhanced under prolonged hyperglycemia exposure, which is one of the pathological mechanisms involved. In contrast to physiological glucose concentration, chronic supraphysiological glucose concentration (>10 mm) negatively affects a large number of organs and tissues, such as pancreas, eyes, liver, muscles, adipose tissues, brain, heart, kidneys, and nerves. Glucose toxicity is the main cause of diabetic complications, which are often observed only several years after the development of the illness (6, 7). However, chronic hyperglycemia can also increase the development rate of early diabetic states by affecting the secretion capacity of pancreatic cells, which in turn increases blood glucose concentration. This vicious circle finally leads to the total incapacity of β-cells to secrete insulin (8, 9). Thus, glycation has often been related to chronic complications of diabetes mellitus, renal failure, and degenerative changes occurring in the course of aging (10–12).
Glycation of proteins is one of the potential mechanisms expected to be involved in glucotoxicity because of clinical evidence. Calvo et al. (13–15) have evaluated the non-enzymatic glycation rate of high density lipoprotein in type 1 and 2 diabetic patients. The authors isolated glycated apolipoprotein A-I (apoA-I) from diabetic patients and compared its lipid binding properties with those of apoA-I from healthy subjects. They found that apoA-I glycation promotes a decrease in the stability of the lipid-apolipoprotein interaction and also in its self-association. Therefore, the structural cohesion of high density lipoprotein molecules is seriously affected by glycation of apoA-I. In vivo studies in mice proved that glycated insulin exhibits a reduced ability to stimulate glucose oxidation by the isolated mouse diaphragm muscle. This observation was in concordance with previous studies suggesting that glycation of insulin decreases its potency to stimulate lipogenesis in isolated rat adipocytes. This is consistent with the observation that glycated insulin displayed a significantly reduced ability to lower plasma glucose concentrations in mice. These and other studies clearly indicated that glycation results in a significant impairment of insulin action to regulate plasma glucose homeostasis (16).
The glycemic control of clinical patients is currently assessed indirectly with the conventional test of glycated hemoglobin (HbA1c). HbA1c is a long term indicator of the patient glycemic state because of the erythrocyte lifespan (∼120 days). HbA1c concentration represents the memory effect of blood glucose concentrations over the previous 8–12 weeks (17–20). Other measurements indicative of short term glucose perturbation are needed to understand its potential biological effect. It should also be taken into account that any protein could be potentially glycated. Because of the continuous exposition to glucose, the concentrations of HbA1c and glycated human serum albumin in plasma from healthy subjects have been estimated around 5–7 and 15%, respectively (21, 22). Therefore, the development of methods for the identification and quantification of glycated proteins as well as for prediction of new potential targets under different conditions is crucial to elucidate their biological effect.
Recently, Metz and co-workers (23–25) proposed several approaches for the characterization of glycated proteins. These approaches are based on bottom-up work flows characterized by the implementation of selective and sensitive steps for the enrichment and isolation of glycated proteins and/or peptides with boronate affinity chromatography (BAC) and data-dependent mass spectrometry methods. Nevertheless, these approaches have been focused on qualitative analysis only. Therefore, it is clear that there is a demand for quantitative methods for the analysis of glycated proteins to evaluate the glycemic control of clinical samples or to compare patient glycemic states.
A method for quantitative analysis of glycated proteins is presented here. This method is based on differential labeling of proteins with isotopically labeled sugars (13C-sugars), named glycation isotopic labeling (GIL). The labeling step is performed by natural incubation under physiological conditions mimicking the in vivo glycation process. By this procedure, only preferential glycation targets are labeled because of the chemoselectivity of this process. After labeling, this approach can be implemented in any proteomics work flow based on MS detection and relative quantitation of the two isotopic forms. In this study, the approach was implemented in the analysis of non-enzymatic glycation sites in the human plasma proteome.
EXPERIMENTAL PROCEDURES
Chemicals
Disodium hydrogen phosphate, sodium hydroxide, ammonium acetate, acetic acid, [12C6]glucose (≥99.5%), and [13C6]glucose (99 atom % 13C) were purchased from Sigma. Myoglobin from horse heart (≥90%), β-lactoglobulin from bovine milk (∼90%), and insuline from bovine pancreas (powder cell culture tested) were provided by Sigma. Lysozyme from hen egg white (10,500 units mg−1) was from Fluka. These four proteins were used to prepare a multistandard mixture in 0.1 m phosphate buffer, pH 7.5. Human reference plasma containing 3.8% trisodium citrate as anticoagulant was purchased from Sigma. Plasma was tested and found to be negative for antibody to human immunodeficiency virus, types 1 and 2, antibody to hepatitis C virus, and hepatitis B surface antigen. According to the manufacturer, whole blood was collected with anticoagulants (9:1), pooled, and centrifuged. The resulting plasma was filtered (0.45 μm) and lyophilized.
Triethylammonium hydrogen carbonate buffer (TEAB; 1 m, pH 8.5), iodoacetamide (≥99%), tris(2-carboxyethyl)phosphine hydrochloride (TCEP; 0.5 m), and sodium phosphate were from Sigma-Aldrich. Endoproteinase Glu-C from Staphylococcus aureus V8 was from Fluka. Water for chromatography (LiChrosolv) and acetonitrile (Chromasolv) for HPLC (≥99.9%) were from Merck and Sigma, respectively. Superpure formic acid (≥99%) was purchased from Biosolve Chemicals (Valkenswaard, The Netherlands) as the ionizing agent for LC-MS analysis.
Glucose Labeling of Protein Multistandard
Two aliquots of the multistandard of four model proteins (0.125 mg of each protein) in 0.5 ml of phosphate buffer were independently incubated with 30 mm [12C6]glucose and [13C6]glucose for 24 h at 37 °C. Glucose and other salts were removed with Microcon ultrafiltration devices that have an Ultracel® YM-3 regenerated cellulose membrane with 3-kDa molecular mass cutoff (Millipore) followed by a buffer exchange to 0.5 m TEAB, pH 8.5 in the same unit according to the manufacturer's instructions. Protein concentration was subsequently measured using the Bradford assay with bovine serum albumin as the calibration protein.
Glucose Labeling of Reference Human Plasma
Human plasma was reconstituted in 5 ml of water according to the recommended manufacturer's protocol. Two aliquots of the reconstituted plasma (50 μl each) in 0.5 ml of phosphate buffer were independently incubated with 30 mm [12C6]glucose and [13C6]glucose for 24 h at 37 °C. Then, each aliquot was separately analyzed, or the aliquots were pooled in 1:1 ratio, depending on the analytical purpose, for subsequent analysis. In any case, glucose and other salts were similarly removed by Microcon devices to isolate the proteins that were reconstituted in 0.5 m TEAB, pH 8.5. Protein concentration was subsequently measured using the Bradford assay with bovine serum albumin as the calibration protein.
Endoproteinase Glu-C Enzymatic Digestion of Proteins
Reconstituted proteins in the case of the multistandard (400 μl) and 1 mg of plasma proteins according to the Bradford assay (diluted to 400 μl of TEAB) were enzymatically digested using endoproteinase Glu-C. For this purpose, cysteine groups were reduced with 50 mm tris(2-carboxyethyl)phosphine hydrochloride in water (20 μl) by incubation of the reaction mixtures for 60 min at 60 °C. Then, cysteine residues were alkylated with 400 mm iodoacetamide (10 μl) for 30 min in the dark at room temperature. Freshly prepared endoproteinase Glu-C (1.0 μg/μl) was added (67 μl to obtain a ratio 1:15, w/w), and the digestion was performed overnight at 37 °C. Then, digestion mixtures were evaporated under speed vacuum and reconstituted in 50 μl of mobile phase A (0.2 m NH4Ac, 50 mm MgCl2, pH 8.1) for isolation of glycated peptides.
Enrichment of Glycated Peptides by Boronate Affinity Chromatography
Reconstituted peptides were fractionated by boronate affinity chromatography by interaction between boronic acids and cis-diol groups of glycated peptides present at low concentration. For this purpose, the target sample (50 μl) was injected in a Waters HPLC system equipped with a TSK-Gel boronate affinity column from Tosoh Bioscience (7.5 cm × 7.5-mm inner diameter; 10-μm particle size) at room temperature. An isocratic chromatographic method was used for affinity separation that consists of the following steps: 1) 0–10 min, 100% mobile phase A for retention of glycated peptides by esterification between boronate ligands and 1,2-cis-diol groups of glucose moieties under alkaline conditions with elution of non-glycated peptides; 2) 10–20 min, 100% mobile phase B (0.1 m acetic acid) for elution of glycated peptides; and 3) 20–30 min, 100% mobile phase A for the equilibration of the column to the initial conditions. Both the non-glycated and the glycated fractions were collected for subsequent evaporation and reconstitution in 5% ACN, 0.1% formic acid. Then, peptides were desalted and preconcentrated prior to LC-MS/MS analysis. This was carried out with C18 microspin columns (Harvard Apparatus, Holliston, MA) according to the manufacturer's recommended protocol, which ends with elution of peptides with 400 μl of 50% ACN, 0.1% formic acid. This solution was evaporated to dryness for reconstitution with 50 μl 5% ACN, 0.1% formic acid.
LC-MS/MS Analysis of Peptides
Peptide digests were analyzed by electrospray ionization in positive ion mode on a hybrid linear ion trap-Orbitrap mass spectrometer (Thermo Fisher, San Jose, CA). Nanoflow HPLC was performed using a Waters NanoAquity HPLC system equipped with a helium degasser. Peptides were trapped on a homemade 100-μm-inner diameter × 18-mm-long precolumn packed with 200-Å (5-μm) Magic C18 particles (C18AQ, Michrom Bioresources, Inc.). Subsequent peptide separation was performed on a homemade gravity-pulled 75-μm-inner diameter × 150-mm-long analytical column packed with 100-Å (5-μm) C18AQ particles (Michrom Bioresources, Inc.) and directly interfaced to the mass spectrometer.
For each LC-MS/MS analysis, an estimated amount of 0.5 μg of peptides (0.1 μg/μl) was loaded on the precolumn at 3 ml/min in water/ACN (95:5 v/v) with 0.1% formic acid (v/v). After retention, peptides were eluted using an ACN gradient at 220 nl/min with mobile phase A (water, 0.1% formic acid) and B (ACN, 0.1% formic acid). The gradient program was as follows: 0 min, 95% A, 5% B; 55 min, 65% A, 35% B; 60 min, 15% A, 85% B; 65 min, 85% A, 15% B; and 75–90 min, 95% A, 5% B. The electrospray ionization voltage was applied via a liquid junction using a platinum wire inserted into a microtee union (Upchurch Scientific, Oak Harbor, WA) located between the precolumn and the analytical column. Ion source conditions were optimized using the tuning and calibration solution recommended by the instrument provider.
Two complementary data-dependent tandem mass spectrometry methods were used for analysis of glycated proteins: MS2 with higher energy collisional dissociation (HCD) as the activation mode and MS3 by neutral loss scanning with CID as the activation mode. In data-dependent HCD-MS2 analysis, fragmentation of the three most abundant precursor ions was carried out in the octopole collision cell attached to the C-trap (normalized collision energy, 50%) followed by Orbitrap detection. The precursor ion isolation window was set to 4 m/z units. MS survey scans were acquired at resolution R = 60,000 in profile mode, whereas MS2 spectra were acquired at resolution R = 7500. Precursor ions of charge state 2+ and higher were included for data-dependent selection. In cases where charge state could not be identified, the most abundant ion was selected for HCD. Data-dependent acquisition was then performed over the entire chromatographic cycle. The data-dependent CID-MS3 neutral loss scan was entirely carried out in the linear trap (except the MS survey scan, which was performed with Orbitrap accuracy) with three steps: 1) fragmentation of medium collision energy (35%) to promote the cleavage of the glucose moiety (−162.05 Da, which corresponds to −81.02 and −54.01 m/z units for doubly and triply charged peptides, respectively) or an intermediate fragmentation of the glucose molecule (−84.04 Da, which corresponds to −42.02 and −28.01 m/z units for doubly and triply charged peptides, respectively), 2) isolation of those ions in which one of the neutral losses is detected, and 3) fragmentation of the isolated peptide (35%) followed by ion trap detection. The precursor ion isolation window was set to 2 m/z units.
Data Analysis
After data-dependent acquisition, a postacquisition work flow was initiated specifically for each MS operation mode. For HCD-MS2 experiments, the work flow was based on detection of precursor ions in an accurate way and correction for misassigned precursor ion isotopes (26). The resulting dta files for both MS operation modes were searched against the UniProt-Swiss-Prot/TrEMBL database (Swiss-Prot Release 56.6 of December 16, 2008, 287,050 entries and TrEMBL Release 39.6 of December 16, 2008, 4,988,379 entries) using Phenyx 2.6 (GeneBio, Geneva, Switzerland). No taxonomy was used for the model protein mixture, and Homo sapiens was specified for database searching of plasma experiments. Common amino acid modifications for both MS operation modes were carbamidomethylation of cysteines and oxidized methionine, which were set as fixed and variable modifications, respectively. For HCD-MS2 experiments, glycation of lysine and arginine residues or in N-terminal positions (162.052 and 168.072 Da for glycated peptides with [12C6]glucose or [13C6]glucose), respectively was selected as a variable modification. For MS3 neutral loss experiments, a variable modification as a consequence of glucose fragmentation after neutral loss of 84.04 Da (78.01 Da for Lys and Arg and on N-terminal positions) was additionally specified. Endoproteinase Glu-C was selected as the enzyme with three potential missed cleavages as maximum. The peptide and fragment ion tolerance depended on the MS operation mode. For HCD-MS2, peptide and fragment ion tolerance was 6 ppm. This tolerance was set to 0.8 Da for fragment ions in MS3 neutral loss. In both modes, two sequential search rounds were used. In the first round, two missed cleavages were allowed in normal mode. This round was selected in “turbo” search mode. In the second round, three missed cleavages were allowed in half-cleaved mode. The minimum peptide length allowed was 6 for both rounds. The acceptance criteria were slightly lowered in the second round search. For HCD-MS2 experiments, these were: AC score (Minimum significant value for a protein's accesion number score. The AC score is the sum of the best scores for validated peptide sequences. Protein matches scoring lower than this value are rejected from the identified proteins), 9.7; peptide Z-score, 9.7; and peptide p value, 1 × 10⁻⁷ for round 1 and AC score, 9.5; peptide Z-score, 9.5; and peptide p value, 1 × 10⁻⁶ for round 2, corresponding to an estimated false positive ratio of less than 1%. For MS3 in neutral loss experiments, these parameters were changed: AC score, 7.0; peptide Z-score, 7.0; and peptide p value, 1 × 10⁻⁶ for round 1 and AC score, 6.5; peptide Z-score, 6.5; peptide p value, 1 × 10⁻⁵ for round 2, corresponding to an estimated false positive ratio of less than 1%. False positive ratios were estimated using a reverse decoy database. This estimation was performed using separate searches in the reverse database to keep the database size constant. This involved a slight underestimation of the estimated false positive ratio (27). In the case of several matching entries, Swiss-Prot entries were preferred to TrEMBL entries. All data were acquired in triplicate (three analytical injections of the same sample) and analyzed in an independent manner.
Peptide Quantification
Quantitation of glycated proteins was possible because after enzymatic digestion the resulting glycated peptides (with addition of 162 or 168 mass units) produced doublet signals in precursor MS1 scans (labeling with light and heavy glucose). The mass shift of the doublet signals depended on the peptide charge and the number of glycation sites. Peptide quantification was carried out by calculation of the ratio between peak areas from extracted ion chromatograms corresponding to both isotopic forms of each glycated peptide. The peptide ratios [12C6]glucose peptide/[13C6]glucose peptide were obtained from the average values of intrarun triplicates. As shown in Fig. 2, data treatment was automated using the SuperHirn software (version 1.0) (28), which was developed by the group of Prof. Ruedi Aebersold at the Institute of Molecular Systems Biology (ETHZ, Switzerland). The .raw data files were converted to mzXML (29) file format in profile mode, and SuperHirn performed the feature extraction and alignment of the replicate runs (SuperHirn used standard Orbitrap settings). The postprocessing of the feature list was performed in the R statistical programming environment (The R Project for Statistical Computing). Briefly, the SuperHirn result files were parsed to find all heavy-light pairs (within a mass tolerance of 0.01 Da and retention time tolerance of 20 s) that appeared in at least two of the replicates. Then, all accepted identifications from the Phenyx Excel export were attributed to a heavy-light pair if such a pair could be detected (∼80% of the cases).
Fig. 2.

Bottom-up proteomics work flows used for quantitative analysis of glycated proteins showing labeling with light and heavy glucose.
RESULTS
Optimization of Method for Analysis of Glycated Proteins
Qualitative Analysis by Tandem Mass Spectrometry
The complete work flow for the analysis of glycated proteins (shown in Fig. 2) was optimized with the multistandard of model proteins and the reference plasma. The first step studied was the enzymatic cleavage (data not shown). For this purpose, the influence of two different enzymes, trypsin (cleaving predominantly at the carboxyl side of Lys and Arg residues) and endoproteinase Glu-C (cleaving predominantly at the carboxyl side of Glu residues), was tested. As glucose attachment is selective for Lys and Arg residues, the trypsin digestion pattern was affected with an increase of the number of missed cleavage sites. A high proportion of half-cleaved peptides were also detected. The influence of glucose attachment was less dramatic for endoproteinase Glu-C, and identifications of missed cleavage sites and, particularly, half-cleaved peptides were considerably reduced. The endoproteinase Glu-C was selected for further analysis.
Concerning mass spectrometry, electron transfer dissociation (23) and CID in data-dependent MS3 and pseudo-MS3 approaches (neutral loss scanning and multistage activation, respectively) (24) have proved to be efficient activation modes for identification of glycated peptides. Nevertheless, the use of the Orbitrap hybrid mass analyzer enables the application of an additional ion dissociation mode, which has not been tested yet for glycation analysis. This is the HCD mode that is characterized by its performance in an additional octopole collision cell attached to the C-trap using nitrogen as the collision gas. The use of nitrogen results in a more energetic fragmentation than the helium-based dissociation occurring in CID. In addition, HCD is a fast activation mode, as compared with CID, that may reach high vibrational energies per bond before dissociation of the target molecular ion. As a result, high quality fingerprinting spectra are obtained that enhance the identification of glycated peptides. Fig. 3 compares CID- and HCD-generated spectra by activation of two representative glycated peptides corresponding to human serum albumin (HSA) identified in plasma. Optimum collision energies in terms of identification were used for each case (35 and 50% for CID and HCD, respectively). The HCD spectrum provides a high quality fingerprinting of the peptide backbone with identification of y and b ions. One other benefit of HCD-MS2 is the detection of immonium ions that can be clearly visualized in the low mass range to confirm peptide identification. Immonium ions have pinpoint the presence of modified aminoacids such as phosphorylated Tyr and carboxymethylated Cys enables to pin point the presence of modified amino acids. By similarity, this can be applied to glycated Lys and Arg taking into account the losses detected in glycated peptides such as the loss of three water molecules and the intermolecular rearrangement of the glucose moiety (−54.031 and −84.042 Da) must be considered. Thus, immonium-derived ions calculated for glycated Lys were at 192.102 and 162.091 Da (the most favored Lys immonium ion provides a signal at 84.081 Da, which is displaced to 246.134 Da with glucose attachment). However, typical losses detected in glycated entities generate two signals at 192.102 and 162.091 Da. Similarly, immonium-derived ions for glycated Arg were at 237.135 and 207.124 Da. Because of the selectivity of these ions, glycated peptides can be localized by extracting ion chromatograms in MS2 as shown in Fig. 4 for Lys glycated peptides.
Fig. 3.

Comparison of CID and HCD activation modes in MS2 analysis of glycated peptide from HSA identified in plasma. Optimum collision energies for identification were used for each case (35 and 50% for CID and HCD, respectively).
Fig. 4.

Extracted ion chromatograms in MS2 of immonium ions calculated for glycated Lys in plasma analysis. 192.102 Da corresponds to glycated Lys with a loss of three water molecules, and 162.091 Da corresponds to the intermolecular rearrangement of the glucose moiety with loss of 84.042 Da.
Analysis in MS2 was complemented by MS3 in neutral loss scanning. Fig. 5 shows a representative example for a glycated peptide from serum albumin detected in the plasma analysis. The precursor ions were activated in a first step by CID (35%) to promote the loss of specific neutral fragments. The fragmentation scheme for this peptide illustrates the characteristic neutral losses obtained by the different approaches. These neutral losses fit with the cleavage of the glucose moiety (162.05 Da), dehydration of up to three water molecules (18.01, 36.02, and 54.03 Da) to form pyrylium ion, and dehydration with additional loss of a formaldehyde molecule to generate the furylium and immonium ions (84.04 Da). After this fragmentation, ions formed by loss of 162.05 and 84.04 Da are isolated in the ion trap for a second fragmentation, which now generates representative MS3 spectra for identification purposes as shown in Fig. 5. Ions formed by the other neutral losses (18.01, 36.02, and 54.03 Da) are excluded as they do not provide sufficient information for identification in MS3 spectra. Because these ions still contain labile parts in their structure, the MS3 spectra generated are similar to CID-MS2 spectra of glycated peptides. Neutral loss analysis was carried out in the ion trap to avoid transfers of ions to the Orbitrap analyzer with the subsequent decrease of sensitivity.
Fig. 5.

CID-MS3 analysis in neutral loss scan mode for HSA glycated peptide identified in plasma. Two neutral losses were monitored: 162.05 and 84.04 Da corresponding to glucose cleavage and an intermolecular rearrangement of the glucose moiety, respectively.
The efficiency of BAC-based fractionation was proved by analysis of the non-glycated fraction (non-retained fraction) with both MS operational modes. There was no detection of glycated peptides in this fraction, proving the retention capability of the boronate phase. Characterization of the BAC step was completed by searching non-glycated peptides in the retained fraction with HCD-MS2. In the analysis of the multistandard of proteins, the proportion of non-glycated peptides identified in the retained fraction was below 10%, validating the selectivity of the isolation step (in the analysis of plasma, this percentage was below 20%, which is still acceptable considering the low concentration of glycated peptides).
Quantitative Analysis Based on GIL Approach
As shown in Fig. 2, quantitation is based on the differential labeling with isotopic sugars under physiological conditions to compare biological states. As previously emphasized, labeling with both isotopic glucose molecules enables the detection of glycated peptides by mass spectrometry because they produce a doublet signal in MS scan (+6 Da per glycation site). The quantitative approach was initially optimized with the multistandard of model proteins, which were analyzed with the protocol shown in Fig. 2. Fig. 6 shows one of the MS scans obtained at a retention time of 26.57 min by reverse phase LC in which two doubly charged glycated peptides were co-eluted. The doublet signals are 533.31/536.32 and 624.82/627.83 m/z units with a mass shift of 3 Da, which is indicative of doubly charged glycated peptides. The peptide at 533.31 m/z units corresponds to a horse myoglobin glycated peptide, whereas that at 624.82 m/z units was identified as a bovine insulin glycated peptide. This experiment was performed after incubation of the standard sample with “light” and “heavy” glucose and subsequent pooling with a 1:1 ratio. The intensity of MS signals corresponding to the two versions of the peptide labeled with both isotopic glucose forms was practically the same. Particularly, the ratios between peak areas were 0.965 ± 0.010 and 1.018 ± 0.025 for myoglobin and insulin glycated peptides, respectively. These values were obtained after analysis of three technical replicates.
Fig. 6.

Mass scan obtained by LC-MS/MS analysis in which two glycated peptides (E↓K(glucose)TKIPAVF↓K and E↓RGFFYTPK(glucose)A↓C-terminal site for horse myoglobin and bovine insulin, respectively) are co-eluted. Doublet signals are enlarged to show the glycation efficiency of [12C6]glucose and [13C6]glucose.
Tests of Optimized Protocol to Human Plasma
After optimization of the glucose labeling principle, the next step was to test it with a relatively complex biofluid such as human plasma. For this purpose, two aliquots of plasma (50 μl each) were independently incubated with 30 mm [12C6]glucose and [13C6]glucose for 24 h at 37 °C. In this case, each aliquot was analyzed separately using the work flow shown in Fig. 2. After incubation and ultrafiltration, an aliquot of 2 mg of proteins was taken for enzymatic digestion and glycation analysis. The aim for this experiment was to validate the applicability of doublet signal detection as an analytical tool for the assessment of glycation. Fig. 7 shows the MS1 survey scans of five glycated peptides containing the preferential glycation sites of HSA according to the literature. These glycation sites have been found at concentrations within the range of 0.8–8% in healthy subjects according to Kisugi et al. (21). In this study, a concentration of 14.7% glycated albumin was found in healthy individuals, and a concentration of 25.4% was found in diabetic patients. The same five preferential glycation sites were detected in our study. The intensity of these signals is the contribution of both the native glycated protein existing in plasma and the glycation consequent to the glucose stimuli (30 mm incubation for 24 h at 37 °C).
Fig. 7.

MS precursor scans of the glycated peptides containing five preferential glycation sites in human serum albumin according to Kisugi et al. (21). Left side, [13C6]glucose incubation. Right side, direct analysis.
Concerning the experiment based on incubation with [13C6]glucose, the same peptides produced doublet signals that favor their identification. In this case, the signals corresponding to peptides labeled with [13C6]glucose are result of the in vitro incubation. On the other hand, the signals generated by glycated peptides with light glucose are indicative of their native concentration in plasma. This experiment validates the principle of isotopic sugar labeling for quantitation of glycated proteins as discussed in the following sections.
Detection, Quantitation, and Prediction of Human Glycated Plasma Proteins
Assessment of Native Level of Plasma Protein Glycation
The application of the optimized [13C6]glucose labeling protocol to plasma provides a global view about the glycemic state of an individual. This analysis provides the profile of glycated proteins identified together with information about glycation sites as shown in supplemental Table 1 (also see supplemental Tables 3 and 4) for the reference plasma used in this research. A total of 35 proteins was found to be glycated in the reference plasma sample without any prefractionation step at the protein level. The proposed methodology was able to detect 113 different glycation sites, which are of particular interest as each glycation site could have a different impact on the biological function of proteins. For instance, 35 different glycation sites were identified for HSA. As indicated previously, earlier studies have identified preferential glycation sites for HSA in Lys residues located at positions 549, 257, 264, 468, and 160. Our approach enables comparison of the reactivity of the different glycation sites for the sugar attachment. For this purpose, values of the ratio between the peak areas of the in vivo and in vitro glycated peptides (labeled with [12C6]glucose and [13C6]glucose, respectively) were estimated from the extracted ion chromatograms. Fig. 8 compares the glycation reactivity for the different sites detected in four representative plasmatic proteins as a function of area ratio. The resulting graphs provide structural information about localization of preferential glycation sites that is of great interest to elucidate their biological effect on the protein function. The affinity glycation sites for HSA (Lys-549, -264, -257, -75, -160, -161, and -97 as the preferential glycation sites) as well as for other plasma proteins such as serotransferrin (Lys-315 and -508), haptoglobin (Lys-270 and -151), or apolipoprotein A-I (Lys-12 and -77) can be deduced from these representations. Supplemental Table 1 additionally includes quantitative information for each of the glycated peptides identified in plasma (in relative terms as the ratio between peak areas produced by [12C6]glucose- and [13C6]glucose-labeled peptides). These ratios were automatically calculated with SuperHirn. To evaluate this automated analysis, we plotted the ratios obtained by manual integration against those calculated from the software (Fig. 9A). This revealed a high correlation between the two values (Pearson correlation = 0.91). Fig. 9B plots the log intensities corresponding to [12C6]glucose-glycated peptides against those for [13C6]glucose-labeled peptides. The features with deviating [12C6]glucose/[13C6]glucose ratios are clearly differentiated from the cloud of background ratios. The width of the cloud indicates the deviation in log intensities even if no real change is present. The points belonging to replicates of the same feature are connected by a gray line, which shows that replicates are very close and therefore highlights the good technical precision of the analytical method. The deviation between replicates is much smaller than the “biological” deviation between different features (supplemental Fig. 1 shows the same graphs for CID-MS3).
Fig. 8.

Glycation affinity of different sites identified in four glycated proteins found in plasma. Error bars correspond to standard deviations estimated with 3 analytical replicates.
Fig. 9.

A, scatter plot for the SuperHirn and manually determined ratios between peak areas provided by the in vivo and in vitro labeled peptides for the experiment assessing the real glycemic state using HCD-MS2. B, scatterplot of the log intensities of the light and heavy features, which can be detected in all three replicates. A light gray line connects replicates of the same feature. The regression line shows the lowest fit, and the dashed lines above and below it indicate the 0.01 and 0.99 quantiles of the residues to the lowest fit.
Prediction of Glycation Site State as Response to Glucose Stimuli
In this study, glucose perturbations were assessed by independent incubation of two plasma aliquots with [12C6]glucose and [13C6]glucose. A glucose concentration of 30 mm was selected for incubation mimicking a glucotoxicity perturbation (supplemental Fig. 2). After incubation, both aliquots were pooled at a 1:1 ratio for standardization prior to proteomics analysis following the reported protocol. As shown in supplemental Table 2 (see also supplemental Tables 5 and 6), 50 glycated proteins were identified with this analysis. As compared with the analysis based on exclusive incubation with [13C6]glucose, 20 previously undiscovered glycated proteins were identified. Additionally, a total number of 161 glycation sites were detected. Most of these identifications corresponded to singly glycated peptides. Nevertheless, it is worth emphasizing the detection of peptides containing two different glycation sites, which were undetectable in the analysis of native glycation. For this reason, these peptides could be considered as potential biomarkers to assess glucotoxicity levels in clinical patients. Concerning data treatment, the signals corresponding to peptides labeled with [13C6]glucose are representative of the 30 mm glucose stimulus. On the other hand, the signals produced by peptides labeled with [12C6]glucose are the contribution of two different sources: native glycated proteins present before incubation (equal contribution from both aliquots) and those generated as a consequence of the [12C6]glucose stimulus for 24 h. Therefore, with this approach, glycated proteins formed as a result of the glucotoxic perturbation can be differentiated in relative terms. For doubly glycated peptides, we can discriminate between 1) those in vitro labeled with [12C6]glucose or [13C6]glucose as a result of the stimulus and 2) those that were singly labeled with [12C6]glucose before the stimulus and were secondarily labeled due to the glucose perturbation with [12C6]glucose or [13C6]isotopic forms.
This prediction approach assesses the impact of glycemic disturbances for the different glycation sites. Supplemental Table 2 also evaluates the effect of the 30 mm glucose stimuli for each glycated peptide (right column) by comparison with the native glycation as reference. This parameter was calculated with the following expression (see supplemental Fig. 2).
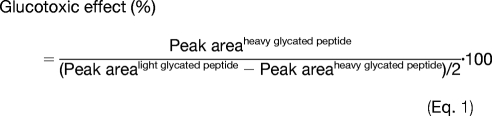 |
As an example, preferential glycation sites of HSA such as Lys-549, Lys-264, and Lys-257 showed a glucotoxic effect between 36.2 and 56.8% in plasma subjected to 30 mm glucose for 24 h. On the other hand, a higher impact was observed in potential sites with lower glycation affinity such as Lys-524 and Lys-543, which showed glucotoxic effects of 229.5 and 316.2%, respectively. Additionally, the predictive approach enables the identification of potential glycation targets such as the glycated peptides containing Arg-242 in HSA, Arg-273 in serotransferrin, or Lys-37 in Ig κ chain C region. As can be seen, peak area ratios of the [12C6]glucose- and [13C6]glucose-labeled peptides were close to 1.0, which is indicative of labeling only during the glucotoxic perturbation. As a similar labeling efficiency has been observed for [12C6]glucose and [13C6]glucose, the result for these peptides proves that they are new potential targets for glycation under these specific conditions (in plasma subjected to 30 mM glucose exposition for 24 h). The graphs resulting from quantitative analysis with SuperHirn can be visualized in supplemental Fig. 1.
DISCUSSION
Optimization of Method for Analysis of Glycated Proteins
This research describes the development of an application for qualitative and quantitative analysis of glycated proteins in human plasma. Several reasons may explain the lack of methods for identification and quantitation of glycated proteins. Among them, we have to emphasize the modification of enzymatic digestion patterns and the lack of strategies to detect glycated proteins present in human biofluids at low concentrations. Because of the influence of glycation on trypsin enzymatic digestion, the implementation of an alternative protease such as Glu-C has proved to be an effective way to avoid pattern modifications. In this way, enzymatic specificity can be maintained for identification of glycated peptides by minimizing the generation of missed cleavage sites and half-cleaved peptides. The development of selective and sensitive strategies for the detection of glycated proteins was accomplished by the recent advances in mass spectrometry. Electron transfer dissociation has proved to be an efficient activation mode for identification of glycated peptides by tandem mass spectrometry. CID-based fragmentation tends to dissociate Amadori compounds (see Fig. 1). Consequently, low quality spectra are produced because of a poor production of sequence specific ions from the peptide backbone. Signals corresponding to ions generated by losses of specific neutral fragments preferentially dominate the mass spectrum with a reduced success in peptide identification (31, 32). This well characterized fragmentation pattern has been recently used by Zhang et al. (24) in data-dependent MS3 by neutral loss scanning and pseudo-MS3 by multistage activation. Both approaches benefit from a first step of ion dissociation that promotes labile neutral losses to increase the MS/MS quality of spectra produced by a second dissociation step. For this reason, data-dependent MS3 seems to be an efficient alternative to electron capture dissociation/electron transfer dissociation to increase identifications in glycation analysis.
In this research, a combination of an MS2 mode with HCD activation and CID-MS3 by neutral loss scanning is proposed for qualitative analysis of glycated proteins. The high accuracy in the HCD-MS2 mode for precursor and fragment ions is crucial to achieve a high identification level (26, 33) of glycated peptides. This is particularly true if a protease such as Glu-C is used for hydrolysis. On average, this enzyme generates longer peptides when compared with trypsin (Fig. 10A). This approach corresponds to the concept of middle-down proteomics defined by Mann and co-workers (34, 35) as an alternative to benefiting from precision in proteomics. The average length and charge of the identified glycated peptides in plasma are shown in Fig. 10B.
Fig. 10.

A, HCD-MS2 spectra of an HSA glycated peptide identified in the analysis of plasma by the work flow proposed in Fig. 2. Digestion with Glu-C protease enables the generation of long peptides (25 amino acid residues for this specific case). The analysis of long peptides in combination with high accuracy for precursor and fragment ions enables to take benefits from the “middle-down proteomics” concept. B, number of glycated peptides identified in plasma versus charge state of these identifications, which gives an idea about the length of the detected peptides.
The CID-MS3 mode is a complementary approach to HCD-MS2 as the former is particularly useful for identification of glycated peptides with charge states of 2+ and 3+. As an example to evaluate this complementary application, both MS modes were compared in terms of identification of glycation sites. Thus, a total of 113 different glycation sites were identified from human plasma. Interestingly, 64% of them were detected with HCD-MS2, and 46.9% were detected with neutral loss scanning. These results justify the complementary application of both MS modes to increase the identification capability.
The optimization of the overall method was completed by tests to validate the quantitative approach based on glycation isotopic labeling using [13C6]glucose. These tests were carried out with a standard of model proteins in which glycation was not detected in a preliminary test. The obtained results proved that the glycation efficiency of both isotopic glucose forms is similar when estimated with peak areas in extracted chromatograms of the precursor ions of the [12C6]glucose- and [13C6]glucose-labeled peptides. Evidently, this is a critical aspect for the implementation of isotopic glucose labeling as a quantitative approach.
Applicability of Quantitative Approach
Application to Human Plasma Glycated Proteome
As previously indicated, any protein can be glycated. However, the reference method for the assessment of the glycemic control of a patient is the measurement of HbA1c concentration. In addition to being exclusively focused on one protein, the erythrocyte lifespan (∼120 days) defines HbA1c as a long term indicator of the patient state (36–38). It is clear that the overall profiles of glycated proteins represent a more complete indicator of the glycemic state of a particular patient. This information can be achieved with the approach based on incubation with [13C6]glucose as this provides a normalized view on the current glycemic state of a subject. Because [12C6]glucose concentration is not modified, a profile of glycated proteins present in a target sample is obtained, indicating a potential pathological state.
The ratio between peak areas corresponding to the peptides labeled with [12C6]glucose and [13C6]glucose provides additional quantitative information in relative terms. Peptides labeled with heavy glucose are considered as internal standards, and these isotopic forms specifically mimic physiological conditions. Therefore, in vitro labeling with [13C6]glucose depends on sample properties such as protein content or pathological factors affecting glycation. The application of this approach is useful for the relative estimation of the extent of glycation at each potential attachment site. In addition, the isotopic glucose labeling is valid as a quantitative approach to compare two glycation states for the same or different patients.
Prediction of Glycemic State as Response to Glucose Stimuli
The exact mechanism of the glycation process (see Fig. 1) clearly explains the selectivity of the reaction. In general terms, amino groups with lower pKa values should be expected to be more reactive toward glycation because of their greater nucleophilicity. However, there are additional factors that point at the Amadori rearrangement as the critical step to set the site specificity (39). Thus, the properties of nearby amino acids seem to play a relevant role in the potential attachment of sugars to Lys residues. For instance, positively charged amino acids located close to a Lys residue have been proposed to exert a catalytic action for glycation (40). Also, the presence of a His residue close to a Lys in primary or three-dimensional structures promotes its glycation (39, 41). On the other hand, Baynes et al. (42) reported a partial inhibitory effect on Lys glycation due to formation of hydrogen bonds with other amino acids. Recently, Johansen et al. (43) have developed a sequence-based predictor of glycation by investigation of ε amino groups of lysines. As a result of the statistical analysis, acidic amino acids, mainly Glu and Lys residues, were found to catalyze the glycation of nearby Lys. The catalytic acidic amino acids were found to be mainly C-terminal from the glycation site, whereas the basic Lys residues were mainly found to be N-terminal. This in silico predictor, NetGlycate 1.0 Server, is the only predictive tool for analysis of non-enzymatic glycation of proteins. The only limitation is that it is restricted to lysine glycation, and therefore it does not take into account glycation in arginine residues or in the N-terminal position.
The predictive approach proposed here is based on the differential labeling with [12C6]glucose and [13C6]glucose and considers all possible glycations. As glucose labeling is performed by incubation under physiological conditions, glycation of proteins is mimicked in natural terms. As proven above, this favors the evaluation of the impact of glucose concentrations on identified sites. Corresponding information is collected in supplemental Table 2 for each identified glycation site, which was obtained in comparison with native conditions. This approach also leads to the identification of new glycation targets under different glucotoxicity conditions, which is of value in the search for biomarkers of a specific pathological disorder. The independent incubation of two aliquots with [12C6]glucose and [13C6]glucose validates the detection of each glycation site by identification of the same peptide labeled with both isotopic forms (supplemental Fig. 2).
In conclusion, an approach for the qualitative and quantitative analysis of glycated proteins was developed in an attempt to characterize this clinically undesired PTM. Qualitative analysis by HCD-MS2 and CID-MS3 operational modes enabled the identification of glycated proteins in plasma as well as the elucidation of glycation sites. The latter is crucial to determine the effect of the sugar attachment on the biological function of proteins. Quantitative analysis was accomplished by partial labeling of proteins with [13C6]glucose to discriminate from native glycated proteins labeled with [12C6]glucose. Labeling was performed by physiological incubation, taking into account the chemoselective character of glycation. The resulting method was tested by analyzing native glycated proteins in plasma as well as predicting glycation sites under high glucose concentrations. The proposed methodology could be of great interest in clinical applications.
Supplementary Material
Acknowledgments
We are grateful to Yohann Couté, Löic Dayon, and Manfredo Quadroni for valuable discussions in the preparation of this manuscript.
* This work was supported by the Spanish Ministry of Science and Innovation, the Spanish Foundation for Science and Technology (grant with Reference 2007-0398), and the Swiss SystemsX.ch initiative (Grant IPP-200N/ONN).
 The on-line version of this article (available at http://www.mcponline.org) contains supplemental Tables 1–6 and Figs. 1 and 2.
1The abbreviations used are:
- PTM
- post-translational modification
- apoA-I
- apolipoprotein A-I
- BAC
- boronate affinity chromatography
- GIL
- glycation isotopic labeling
- HbA1c
- glycated hemoglobin
- HCD
- higher energy collisional dissociation
- HSA
- human serum albumin
- TEAB
- triethylammonium hydrogen carbonate buffer.
REFERENCES
- 1.Costello C. E., Contado-Miller J. M., Cipollo J. F. (2007) A glycomics platform for the analysis of permethylated oligosaccharide alditols. J. Am. Soc. Mass Spectrom 18, 1799–1812 [DOI] [PMC free article] [PubMed] [Google Scholar]
- 2.Maillard L. C. (1912) Action des acides amines sur le sucres: formation des mélanoidines per vole méthodique. Compterendu de l'Académie des Sciences 154, 66–68 [Google Scholar]
- 3.Thornalley P. J., Langborg A., Minhas H. S. (1999) Formation of glyoxal, methylglyoxal and 3-deoxyglucosone in the glycation of proteins by glucose. Biochem. J 344, 109–116 [PMC free article] [PubMed] [Google Scholar]
- 4.Ulrich P., Cerami A. (2001) Protein glycation, diabetes, and aging. Recent Prog. Horm. Res 56, 1–21 [DOI] [PubMed] [Google Scholar]
- 5.Brock J. W., Hinton D. J., Cotham W. E., Metz T. O., Thorpe S. R., Baynes J. W., Ames J. M. (2003) Proteomic analysis of the site specificity of glycation and carboxymethylation of ribonuclease. J. Proteome Res 2, 506–513 [DOI] [PubMed] [Google Scholar]
- 6.Brunner Y., Schvartz D., Priego-Capote F., Couté Y., Sanchez J. C. (2009) Glucotoxicity and pancreatic proteomics. J. Proteomics 71, 576–591 [DOI] [PubMed] [Google Scholar]
- 7.Reusch J. E. (2003) Diabetes, microvascular complications, and cardiovascular complications: what is it about glucose? J. Clin. Investig 112, 986–988 [DOI] [PMC free article] [PubMed] [Google Scholar]
- 8.LeRoith D. (2002) Beta-cell dysfunction and insulin resistance in type 2 diabetes: role of metabolic and genetic abnormalities. Am. J. Med 113, Suppl. 6A, 3S–11S [DOI] [PubMed] [Google Scholar]
- 9.Dubois M., Vacher P., Roger B., Huyghe D., Vandewalle B., Kerr-Conte J., Pattou F., Moustaïd-Moussa N., Lang J. C. (2007) Glucotoxicity inhibits late steps of insulin exocytosis. Endocrinology 148, 1605–1614 [DOI] [PubMed] [Google Scholar]
- 10.Baynes J. W. (2001) The role of AGEs in aging: causation or correlation. Exp. Gerontol 36, 1527–1537 [DOI] [PubMed] [Google Scholar]
- 11.Brownlee M. (2001) Biochemistry and molecular cell biology of diabetic complications. Nature 414, 813–820 [DOI] [PubMed] [Google Scholar]
- 12.Hipkiss A. R. (2006) Accumulation of altered proteins and ageing: causes and effects. Exp. Gerontol 41, 464–473 [DOI] [PubMed] [Google Scholar]
- 13.Calvo C., Talussot C., Ponsin G., Berthézène F. (1988) Nonenzymatic glycation of apolipoprotein A-I. Effects on its self-association and lipid binding properties. Biochem. Biophys. Res. Commun 153, 1060–1067 [DOI] [PubMed] [Google Scholar]
- 14.Calvo C., Verdugo C. (1992) Association in vivo of glycated apolipoprotein A-I with high density lipoproteins. Eur. J. Clin. Chem. Clin. Biochem 30, 3–5 [DOI] [PubMed] [Google Scholar]
- 15.Calvo C., Ponsin G., Berthezene F. (1988) Characterization of the nonenzymatic glycation of high-density lipoprotein in diabetic patients. Diabete Metab 14, 264–269 [PubMed] [Google Scholar]
- 16.Abdel-Wahab Y. H., O'Harte F. P., Boyd A. C., Barnett C. R., Flatt P. R. (1997) Glycation of insulin results in reduced biological activity in mice. Acta Diabetol 34, 265–270 [DOI] [PubMed] [Google Scholar]
- 17.Miedema K. (2004) Towards worldwide standardisation of HbA1c determination. Diabetologia 47, 1143–1148 [DOI] [PubMed] [Google Scholar]
- 18.Ladyzyñski P., Wójcicki J. M., Bak M., Sabaliñska S., Kawiak J., Foltyñski P., Krzymieñ J., Karnafel W. (2008) Validation of haemoglobin glycation models using glycemia monitoring in vivo and culturing of erythrocytes in vitro. Ann. Biomed. Eng 36, 1188–1202 [DOI] [PubMed] [Google Scholar]
- 19.Saudek C. D., Derr R. L., Kalyani R. R. (2006) Assessing glycemia in diabetes using self-monitoring blood glucose and hemoglobin A1c. JAMA 295, 1688–1697 [DOI] [PubMed] [Google Scholar]
- 20.Brownlee M., Hirsch I. B. (2006) Glycemic variability: a hemoglobin A1c-independent risk factor for diabetic complications. JAMA 295, 1707–1708 [DOI] [PubMed] [Google Scholar]
- 21.Kisugi R., Kouzuma T., Yamamoto T., Akizuki S., Miyamoto H., Someya Y., Yokoyama J., Abe I., Hirai N., Ohnishi A. (2007) Structural and glycation site changes of albumin in diabetic patient with very high glycated albumin. Clin. Chim. Acta 382, 59–64 [DOI] [PubMed] [Google Scholar]
- 22.Yoshiuchi K., Matsuhisa M., Katakami N., Nakatani Y., Sakamoto K., Matsuoka T., Umayahara Y., Kosugi K., Kaneto H., Yamasaki Y., Hori M. (2008) Glycated albumin is a better indicator for glucose excursion than glycated hemoglobin in type 1 and type 2 diabetes. Endocr. J 55, 503–507 [DOI] [PubMed] [Google Scholar]
- 23.Zhang Q., Tang N., Schepmoes A. A., Phillips L. S., Smith R. D., Metz T. O. (2008) Proteomic profiling of nonenzymatically glycated proteins in human plasma and erythrocyte membranes. J. Proteome Res 7, 2025–2032 [DOI] [PMC free article] [PubMed] [Google Scholar]
- 24.Zhang Q., Petyuk V. A., Schepmoes A. A., Orton D. J., Monroe M. E., Yang F., Smith R. D., Metz T. O. (2008) Analysis of non-enzymatically glycated peptides: neutral-loss-triggered MS3 versus multi-stage activation of tandem mass spectrometry. Rapid Commun. Mass Spectrom 22, 3027–3034 [DOI] [PMC free article] [PubMed] [Google Scholar]
- 25.Zhang Q., Ames J. M., Smith R. D., Baynes J. W., Metz T. O. (2009) A perspective on the Maillard reaction and the analysis of protein glycation by mass spectrometry: probing the pathogenesis of chronic disease. J. Proteome Res 8, 754–769 [DOI] [PMC free article] [PubMed] [Google Scholar]
- 26.Scherl A., Tsai Y. S., Shaffer S. A., Goodlett D. R. (2008) Increasing information from shotgun proteomics data by accounting for misassigned precursor ion masses. Proteomics 8, 2791–2797 [DOI] [PubMed] [Google Scholar]
- 27.Elias J. E., Gygi S. P. (2007) Target-decoy search strategy for increased confidence in large-scale protein identifications by mass spectrometry. Nat. Methods 4, 207–214 [DOI] [PubMed] [Google Scholar]
- 28.Mueller L. N., Rinner O., Schmidt A., Letarte S., Bodenmiller B., Brusniak M. Y., Vitek O., Aebersold R., Müller M. (2007) SuperHirn—a novel tool for high resolution LC-MS-based peptide/protein profiling. Proteomics 7, 3470–3480 [DOI] [PubMed] [Google Scholar]
- 29.Pedrioli P. G., Eng J. K., Hubley R., Vogelzang M., Deutsch E. W., Raught B., Pratt B., Nilsson E., Angeletti R. H., Apweiler R., Cheung K., Costello C. E., Hermjakob H., Huang S., Julian R. K., Kapp E., McComb M. E., Oliver S. G., Omenn G., Paton N. W., Simpson R., Smith R., Taylor C. F., Zhu W., Aebersold R. (2004) A common open representation of mass spectrometry data and its application to proteomics research. Nat. Biotechnol 22, 1459–1566 [DOI] [PubMed] [Google Scholar]
- 30.Macek B., Mann M., Olsen J. V. (2009) Global and site-specific quantitative phosphoproteomics: principles and applications. Annu. Rev. Pharmacol. Toxicol 49, 199–221 [DOI] [PubMed] [Google Scholar]
- 31.Jeriæ I., Versluis C., Horvat S., Heck A. J. (2002) Tracing glycoprotein structures: electron ionization tandem mass spectrometric analysis of sugar-peptide adducts. J. Mass Spectrom 37, 803–811 [DOI] [PubMed] [Google Scholar]
- 32.Frolov A., Hoffmann P., Hoffmann R. (2006) Fragmentation behaviour of glycated peptides derived from D-glucose, D-fructose and D-ribose in tandem mass spectrometry. J. Mass Spectrom 41, 1459–1469 [DOI] [PubMed] [Google Scholar]
- 33.Scherl A., Shaffer S. A., Taylor G. K., Hernandez P., Appel R. D., Binz P. A., Goodlett D. R. (2008) On the benefits of acquiring peptide fragment ions at high measured mass accuracy. J. Am. Soc. Mass Spectrom 19, 891–901 [DOI] [PMC free article] [PubMed] [Google Scholar]
- 34.Olsen J. V., Macek B., Lange O., Makarov A., Horning S., Mann M. (2007) Higher-energy C-trap dissociation (HCD) for precise peptide modification analysis. Nat. Methods 4, 709–712 [DOI] [PubMed] [Google Scholar]
- 35.Mann M., Kelleher N. L. (2008) Precision proteomics: the case for high resolution and high mass accuracy. Proc. Natl. Acad. Sci. U.S.A 105, 18132–18138 [DOI] [PMC free article] [PubMed] [Google Scholar]
- 36.Stanaway S. E. R. S., Gill G. V. (2000) Protein glycosylation in diabetes mellitus: biochemical and clinical considerations. Practical Diabetes International 17, 21–25 [Google Scholar]
- 37.Saynes K. C., McIntosh C., Feher M. D. (2001) Artifactually low glycated hemoglobin is a potential pitfall in diabetes management: consider congenital haemolytic anaemias. Practical Diabetes International 18, 103–106 [Google Scholar]
- 38.Chandalla H. B., Krishnaswamy P. R. (2002) Glycated hemoglobin. Current Science 83, 1522–1532 [Google Scholar]
- 39.Shilton B. H., Campbell R. L., Walton D. J. (1993) Site specificity of glycation of horse liver alcohol dehydrogenase in vitro. Eur. J. Biochem 215, 567–572 [DOI] [PubMed] [Google Scholar]
- 40.Iberg N., Flückiger R. (1986) Nonenzymatic glycosylation of albumin in vivo. Identification of multiple glycosylated sites. J. Biol. Chem 261, 13542–13545 [PubMed] [Google Scholar]
- 41.Acosta J., Hettinga J., Flückiger R., Krumrei N., Goldfine A., Angarita L., Halperin J. (2000) Molecular basis for a link between complement and the vascular complications of diabetes. Proc. Natl. Acad. Sci. U.S.A 97, 5450–5455 [DOI] [PMC free article] [PubMed] [Google Scholar]
- 42.Baynes J. W., Watkins N. G., Fisher C. I., Hull C. J., Patrick J. S., Ahmed M. U., Dunn J. A., Thorpe S. R. (1989) The Amadori product on protein: structure and reactions. Prog. Clin. Biol. Res 304, 43–67 [PubMed] [Google Scholar]
- 43.Johansen M. B., Kiemer L., Brunak S. (2006) Analysis and prediction of mammalian protein glycation. Glycobiology 16, 844–853 [DOI] [PubMed] [Google Scholar]
Associated Data
This section collects any data citations, data availability statements, or supplementary materials included in this article.