

Abstract
The study of recently admixed populations provides unique tools for understanding recent population dynamics, socio-cultural factors associated with the founding of emerging populations, and the genetic basis of disease by means of admixture mapping. Historical records and recent autosomal data indicate that the South African Coloured population forms a unique highly admixed population, resulting from the encounter of different peoples from Africa, Europe, and Asia. However, little is known about the mode by which this admixed population was recently founded. Here we show, through detailed phylogeographic analyses of mitochondrial DNA and Y-chromosome variation in a large sample of South African Coloured individuals, that this population derives from at least five different parental populations (Khoisan, Bantus, Europeans, Indians, and Southeast Asians), who have differently contributed to the foundation of the South African Coloured. In addition, our analyses reveal extraordinarily unbalanced gender-specific contributions of the various population genetic components, the most striking being the massive maternal contribution of Khoisan peoples (more than 60%) and the almost negligible maternal contribution of Europeans with respect to their paternal counterparts. The overall picture of gender-biased admixture depicted in this study indicates that the modern South African Coloured population results mainly from the early encounter of European and African males with autochthonous Khoisan females of the Cape of Good Hope around 350 years ago.
Main Text
Recently admixed populations provide unique opportunities for studies related to population history, natural selection, and admixture mapping.1 The mixed ancestries of chromosomal segments in the genomes of admixed populations, such as African Americans, Hispanic/Latinos or Mexican Americans, can be used for the identification of genetic risk factors for complex traits and diseases showing prevalence differences between populations.2–5 In the African continent, one of the populations displaying the highest levels of recent admixture is the now officially self-designated “Coloured” population, which mostly resides in the Western Cape region of South Africa. The origins of the South African Coloured (SAC) can be traced historically to the shores of Table Bay in the area that is now Cape Town at a date soon after the Dutch East India Company had established a refreshment station there in 1652.6 A few well-documented social and demographic events over the generations have fused indigenous Khoi and San (Khoisan), tribal Bantu-speaking populations, European settlers, and slaves' descendants from Java, India, Mozambique, and Madagascar into a highly admixed but discrete ethnic group.6–8 Currently, the estimated four million SAC make up roughly 9% of the South African population and form a unique population in which the African, European, and south Asian cultures have contributed to the melting pot.6–8
From a genetics point of view, only two recent studies have analyzed the genetic composition of this African population.9,10 The first, which analyzed 1,327 nuclear microsatellite and insertion/deletion markers in a large panel of African populations, found that the SAC cluster in intermediate positions between African and non-African populations.9 On the basis of STRUCTURE analysis, this population showed nearly equal levels (∼25%) of four ancestries, namely southern African Khoisan, Bantu-speaking, Indian, and European.9 Using high-density genome-wide genotyping in 20 Coloured individuals and comparing their variation with that of other populations worldwide, the second study concluded that the SAC resulted from a complex admixture process involving at least Bantu-speaking populations from South Africa, Europeans, south Asians, and Indonesians.10
Although autosomal markers provide genome-wide estimates of the different admixture proportions, they are of limited use for the study of gender-biased demographic events. In this context, exploiting segments of the genome that are inherited through only one sex—the maternally inherited mitochondrial DNA (mtDNA) and the nonrecombining portion of the Y chromosome (NRY)—has proven to be a powerful tool for unraveling gender-specific processes and socio-cultural effects, such as polygyny, matrilocality versus patrilocality, different forms of social organization, and gender-biased admixture,18–27 that might have influenced human evolution.11–17 An additional advantage of these genetic systems is that they are more sensitive to effects of genetic drift because of their up to four-fold reduction in effective population size relative to the autosomes and their lack of recombination, so they present increased resolution in discriminating between closely related populations.
In the context of SAC, where various continental gene contributions are expected, the use of the uniparentally inherited markers should be optimal given the deep phylogenetic separation of the mtDNA and NRY lineages between the different continents12,17 from which the SAC population originated.6 Here, we took advantage of the well-resolved phylogenies and strong geographic clustering of mtDNA and NRY lineages11,12,14,17 to (1) dissect the maternal and paternal phylogeographic components of the SAC, (2) characterize in detail their contemporary gender-specific proportions of suspected African, European, and Asian parental ancestries, and (3) unmask possible gender-biased admixture during the foundation of this population. To this end, we analyzed mtDNA and NRY diversity in a large sample of 590 unrelated individuals self-identified as South African Coloured. Samples were collected in the Western Cape in areas that are predominantly Christian and therefore do not include people of the group known as “Cape Malays.” Of the 590 donors, 315 were females, and 275 were males. We were technically able to genotype a total of 563 mtDNA genomes and 228 Y chromosomes (Table S1, available online). For all subjects, appropriate informed consent was obtained, and institutional review boards at the Faculty of Health Sciences, Stellenbosch University, South Africa and Institut Pasteur (n° RBM 2008.06) approved all procedures.
We first defined the maternal ancestry of the SAC population by analyzing a total of 64 mtDNA binary markers, selected on the basis of complete mtDNA genome phylogenies,17,28–30 and sequencing the Hyper Variable Segment-I (HVS-I) (Figure S1; Table S1). The 64 binary markers were tested in a hierarchical order (Figure S1) by fluorescence polarization (VICTOR-2TM Technology; Perkin Elmer) or direct sequencing. Variable positions at the HVS-I were determined from positions 16,024–16,383. Sequencing was performed on a 3730xl DNA Analyzer (Applied Biosystems). We used the resulting dataset to place each of the mtDNA genomes into its respective haplogroup (Hg) and to infer the continental and within-continental geographic origin of each of them. Our analyses revealed 43 different Hgs (Table 1), all known to coalesce prior to the foundation of the SAC population.17 The vast majority of the maternal gene pool of the SAC is of clear sub-Saharan African origin: 79% of their mtDNA lineages belong to the various sub-Saharan African L(xM,N) Hgs29,31 (Table 1; Figure 1). It is remarkable that fully 60% of SAC mtDNAs belong to Hg L0d. This Hg, together with L0k, has been shown to be specific to the Khoisan peoples of South Africa (e.g., Ju|'hoansi San, !Xun/Khwe, !Xun, and !Kung), and not to all click speakers; it is virtually absent from other populations across Africa.29,32–34 Recent complete mtDNA genome sequence data have shown that both L0d and L0k probably evolved within the ancestors of the Khoisan people and are indeed autochthonous to South Africa.29 To dissect the structure of Hg L0d, we typed 11 markers that are diagnostic of the internal L0d subclades (Figure S1). Our analyses revealed that all SAC L0d lineages can be classified into the three major L0d1, L0d2, and L0d3 subclades; L0d2a and L0d1b are the most frequently observed (22% and 17%, respectively, Table 1). Overall, the exceptionally high frequency of the different L0d subclades among SAC indicates a substantial maternal contribution of the Khoisan people to the foundation of the SAC population.
Table 1.
MtDNA Haplogroup Frequencies and Diversity Indices Observed in the South African Coloured Population
| mtDNA Haplogroupa | nb | Percent | kc | Hg D (SD)d | Ht D (SD)e | Pi (SD)f | |||
|---|---|---|---|---|---|---|---|---|---|
| Sub-Saharan African | |||||||||
| Total | 445 | 79.04 | 96 | 0.85 | (0.01) | 0.93 | (0.01) | 6.81 | (3.21) |
| L0d2a | 125 | 22.20 | 12 | 0.28 | (0.05) | 0.32 | (0.32) | ||
| L0d1b | 95 | 16.87 | 18 | 0.87 | (0.02) | 2.22 | (1.24) | ||
| L0d1a1g | 42 | 7.46 | 5 | 0.26 | (0.09) | 0.28 | (0.31) | ||
| L2a1 | 26 | 4.62 | 9 | 0.83 | (0.04) | 3.34 | (1.77) | ||
| L0d1a | 19 | 3.37 | 6 | 0.70 | (0.10) | 1.49 | (0.94) | ||
| L0d2c | 19 | 3.37 | 4 | 0.45 | (0.13) | 0.49 | (0.44) | ||
| L0d3 | 19 | 3.37 | 6 | 0.79 | (0.06) | 1.30 | (0.85) | ||
| L0a2 | 18 | 3.20 | 3 | 0.21 | (0.12) | 0.22 | (0.27) | ||
| L3d1a1 | 11 | 1.95 | 2 | 0.54 | (0.07) | 0.54 | (0.48) | ||
| L0d1c | 10 | 1.78 | 3 | 0.38 | (0.18) | 0.96 | (0.71) | ||
| L3e1b | 8 | 1.42 | 2 | 0.54 | (0.12) | 1.07 | (0.79) | ||
| L0a1b | 7 | 1.24 | 3 | 0.52 | (0.21) | 0.76 | (0.62) | ||
| L0d2b | 6 | 1.07 | 1 | … | … | … | … | ||
| L3e1a | 6 | 1.07 | 3 | 0.73 | (0.16) | 1.13 | (0.85) | ||
| L1c2 | 5 | 0.89 | 5 | 1.00 | (0.13) | 4.40 | (2.61) | ||
| L3d3 | 5 | 0.89 | 1 | … | … | … | … | ||
| L4b2 | 5 | 0.89 | 1 | … | … | … | … | ||
| L1b | 3 | 0.53 | 1 | … | … | … | … | ||
| L3e3 | 3 | 0.53 | 1 | … | … | … | … | ||
| L3f | 3 | 0.53 | 1 | … | … | … | … | ||
| L0d2 | 2 | 0.36 | 2 | 1.00 | (0.50) | 3.00 | (2.45) | ||
| L3e2 | 2 | 0.36 | 1 | … | … | … | … | ||
| L5c | 2 | 0.36 | 2 | 1.00 | (0.50) | 3.00 | (2.45) | ||
| L0d1c1 | 1 | 0.18 | 1 | … | … | … | … | ||
| L1c3a | 1 | 0.18 | 1 | … | … | … | … | ||
| L2c | 1 | 0.18 | 1 | … | … | … | … | ||
| L3e2b | 1 | 0.18 | 1 | … | … | … | … | ||
| West Eurasian/European | |||||||||
| Total | 26 | 4.62 | 11 | 0.70 | (0.07) | 0.75 | (0.09) | 5.52 | (2.74) |
| U5a1 | 13 | 2.31 | 1 | … | … | … | … | ||
| U2e | 6 | 1.07 | 4 | 0.87 | (0.13) | 1.47 | (1.03) | ||
| H | 3 | 0.53 | 2 | 0.67 | (0.31) | 0.66 | (0.66) | ||
| T2b | 2 | 0.36 | 2 | 1.00 | (0.50) | 3.00 | (2.45) | ||
| HV | 1 | 0.18 | 1 | … | … | … | … | ||
| K | 1 | 0.18 | 1 | … | … | … | … | ||
| South/southeast Asian | |||||||||
| Total | 92 | 16.34 | 48 | 0.69 | (0.05) | 0.97 | (0.01) | 5.82 | (2.81) |
| M | 49 | 8.70 | 28 | 0.96 | (0.01) | 3.88 | (1.98) | ||
| U2c | 13 | 2.31 | 2 | 0.46 | (0.11) | 0.92 | (0.68) | ||
| U2b | 6 | 1.07 | 3 | 0.73 | (0.15) | 4.13 | (2.39) | ||
| B4 | 5 | 0.89 | 3 | 0.70 | (0.22) | 3.40 | (2.08) | ||
| R6 | 5 | 0.89 | 1 | … | … | … | … | ||
| U7 | 4 | 0.71 | 1 | … | … | … | … | ||
| F1a | 3 | 0.53 | 3 | 1.00 | (0.27) | 1.33 | (1.09) | ||
| R | 4 | 0.71 | 4 | 1.00 | (0.18) | 5.67 | (3.44) | ||
| R5 | 2 | 0.36 | 2 | 1.00 | (0.50) | 5.00 | (3.87) | ||
| B5a | 1 | 0.18 | 1 | … | … | … | … | ||
Note: Table S1 provides the full haplogroup and haplotype (HVS-I) dataset.
Khoisan-specific Hgs are in italics; pan-African Hgs are underlined.
Number of individuals.
Number of observed HVS-I haplotypes.
Gene diversity based on Hg profiles (Hg D) and standard deviation (SD).
Gene diversity based on HVS-I haplotypes (Ht D) and standard deviation (SD).
Mean number of pairwise differences (Pi) and standard deviation (SD).
Figure 1.
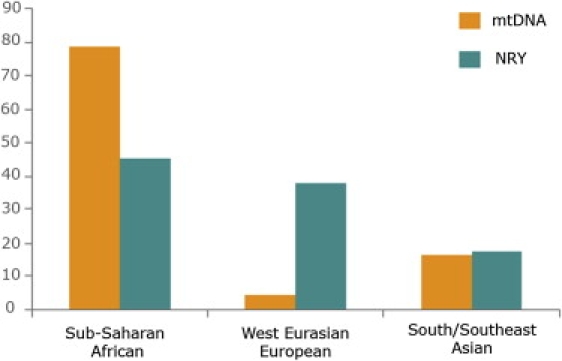
Diverse Continental Origins of Maternal and Paternal Contributions to the South African Coloured
Bar sizes reflect the combined frequencies of all haplogroups, indicated separately for mtDNA and NRY, associated with the sub-Saharan African, west Eurasian/European, and south/southeast Asian genetic components (Table S1, Tables 1 and 2).
The additional 19% of African maternal lineages observed in SAC comprise the various L0a, L1, L2, L3, L4, and L5 clades (Table 1), which are thought to have been introduced to South Africa during the recent Bantu expansion.31,35 Because today these lineages are also observed in the Khoisan (∼40%),29,33,34 they should be seen as lineages of “pan-African” origin. Their presence among SAC reflects either direct gene flow from Bantu peoples or indirect Bantu contribution via admixture with the Khoisan, who have received these lineages through their prior admixture with Bantus.29 In the latter case, the actual maternal contribution of the Khoisan to the SAC population would be up to 79%.
The second most important maternal contribution (16.3%) observed among the SAC is of clear south/southeast Asian origin, as attested by the presence of Hgs B4 and B5a, which are mostly observed among East and Southeast Asians,36 and Hgs M, R, R5, R6, U2b, U2c, and U7, which are instead characteristic of the Indo-Gangetic region37,38 (Figure 1; Table 1). The most prevalent lineage (8.7%) accounting for this component is the macro-Hg M, which largely characterizes the Indian subcontinent.39,40 Despite the extraordinary genetic and geographic variation of macro-Hg M, some inferences can be made from its internal HVS-I haplotype variation. The HVS-I positions 16274–16319, 16126, 16129, 16318T, and 16327–16330 have been suggested to be diagnostic for Hgs M2, M3, M5, M18 and M41, respectively.39,40 These Hgs have been all observed throughout India at varying frequencies depending on the geographic regions.37 For example, the M5 samples found among the SAC, which contain the transversion 16265C, have been previously observed in West Bengal, Gujarat, Maharashtra, and Uttar Pradesh among Brahmin and tribal populations.37 With respect to non-M Hgs, R5 and R6 clearly characterize Indian and Pakistani populations.38 In our dataset (Table S1), we observed five samples belonging to Hg R6 and all sharing the HVS-I haplotype (16129-16266-16318-16320-16362), which has been previously observed in Andhra Pradesh tribal and West Bengal Kurmi populations.37 Likewise, the exact Hg U7 haplotype 16069-16274-16318T, which we found in four SAC samples, has been previously described in Gujarat, Maharashtra, and western India, and one-step derivatives have been described in Andhra Pradesh.37,41 Overall, the Asian maternal component present in the SAC can largely be traced back to the Indo-Gangetic region, although there is anecdotal presence of lineages originating in Southeast Asia. Because historical records suggest Madagascar as a one of the sources of South African slaves,7 the presence of Southeast Asian mtDNA lineages (i.e., B4 and B5a) among the SAC may attest, at least partially, admixture with Malagasy via the prior admixture of Southeast Asians and sub-Saharan Africans in Madagascar.42
Finally, the least dominant maternal component is the West Eurasian one. Only 4.6% of the SAC variation can be attributed to typical European Hgs, including U5a1, U2e, H, T2b, HV, and K (Figure 1; Table 1). Although these Hgs have a wide West Eurasian distribution,43,44 their presence among the SAC indicates that their origin is most probably European, and hence they are referred to herein as such. Indeed, half of the observed SAC mtDNA genomes of European ancestry belong to the same Hg U5a1 haplotype (16145-16189-16192-16256-16270) (Table 1 and Table S1), which has been previously observed at low population frequencies.43,45 This observation might attest to a single female founder's having harbored this Hg, and the lack of internal variation of Hg U5a1 might be explained by the short time period that has elapsed since the founding event when one considers the mutation rate of the mtDNA HVS-I.46 Thus, the actual contribution of European females to the founding of the maternal gene pool of the SAC might be even smaller than the percentage observed among contemporary SAC.
To define the paternal ancestry of the SAC, we analyzed the Y chromosomes by means of 46 binary markers and 14 short tandem repeats (Y-STRs) (Table S1). The binary markers were hierarchically typed (Figure S2) by TaqMan assays or direct sequencing, as previously reported.47 For the microsatellite analysis, the Y-STRs genotyped were DYS19, DYS385a, DYS385b, DYS388, DYS389I, DYS389II, DYS390, DYS391, DYS392, DYS393, DYS426, DYS437, DYS438, and DYS439. PCR products were electrophoresed on a 3730xl Genetic Analyzer (Applied Biosystems), and fragment lengths were converted to repeat number by the use of allelic ladders. Genotyping of binary markers yielded a total of 21 different Hgs (Table 2), and as for mtDNA lineages, all these Hgs are known to coalesce prior to the foundation of the SAC population.47 In contrast with mtDNA results, the sub-Saharan African paternal component of the SAC was almost half (45.2%) that observed on the maternal side (79%, Figure 1). This component was clearly dominated by the pan-African Hg E-M2, which constituted 24.1% of the entire variation. Hg E-M2 is restricted to sub-Saharan African populations; it reaches the highest frequencies (up to 90%) across Bantu-speaking groups48 and varies in its distribution among Khoisan groups (∼40%).33,34,49 Because the multiple Hg E-M2-derived branches do not exhibit a clear population clustering50 and microsatellite networks for paragroup E-M2 are noninformative as a result of the multiple reticulations observed (50 and data not shown), the presence of Hg E-M2 among the SAC, although it could attest to Khoisan contribution, can only be attributed to a component originating south of the Sahara desert. Likewise, the presence of the Hgs E-M35 (xM78, M81, M123, M281) (3.5%) and B-M112 (1.3%), which are shared between Khoisan and Bantu speakers,33,34 reflect a general pan-African component. Actually, this phylogenetically unresolved pan-African component prevents the ability to test for a prior Bantu-to-Khoisan paternal gene flow, as demonstrated for the maternal side.29,34 By contrast, the presence of Hgs E-P68 (5.7%), B-M150 (4.8%), and E-M123 (0.4%), which have never been observed in Khoisan,33,34 most probably indicates admixture with Bantus. Finally, and in strong contrast with mtDNA results, only a minor fraction (5.3%) of the African paternal variation can be firmly attributed to the Khoisan, as attested by the presence of Hg A-M51, which has been observed only among Khoisan-speaking populations from Namibia and South Africa.33,34 Thus, although direct Hg frequencies clearly demonstrate both Khoisan and Bantu-specific signatures in contemporary SAC, most of their Y chromosomes can only be attributed to the large pan-African component (Table 2).
Table 2.
Y Chromosome Haplogroup Frequencies and Diversity Indices Observed in the South African Coloured Population
| Y-Chromosome Hga | nb | Percent | kc | Hg D (SD)d | Ht D (SD)e | Pi (SD)f | |||
|---|---|---|---|---|---|---|---|---|---|
| Sub-Saharan African | |||||||||
| Total | 103 | 45.18 | 78 | 0.68 | (0.04) | 0.99 | (0.00) | 7.43 | (3.50) |
| E-M2 | 55 | 24.12 | 43 | 0.99 | (0.01) | 5.05 | (2.48) | ||
| E-P68∗ | 13 | 5.70 | 9 | 0.92 | (0.06) | 2.83 | (1.59) | ||
| A-M51 | 12 | 5.26 | 8 | 0.94 | (0.05) | 6.97 | (3.52) | ||
| B-M150∗ | 11 | 4.82 | 8 | 0.89 | (0.09) | 2.18 | (1.30) | ||
| E-M35 (xM78, M81, M123, M281) | 8 | 3.51 | 6 | 0.93 | (0.08) | 3.78 | (2.13) | ||
| B-M112 | 3 | 1.32 | 3 | 1.00 | (0.27) | 9.00 | (5.72) | ||
| E-M123∗ | 1 | 0.44 | 1 | … | … | … | … | ||
| West Eurasian/European | |||||||||
| Total | 86 | 37.72 | 67 | 0.70 | (0.04) | 0.99 | (0.00) | 8.44 | (3.94) |
| R-M343 | 41 | 17.98 | 30 | 0.98 | (0.01) | 4.97 | (2.46) | ||
| I-M170 | 20 | 8.77 | 17 | 0.99 | (0.02) | 7.39 | (3.61) | ||
| R-M17g | 12 | 5.26 | 10 | 0.97 | (0.04) | 3.63 | (1.98) | ||
| E-M78 | 5 | 2.19 | 5 | 1.00 | (0.13) | 4.10 | (2.45) | ||
| T-M70 | 4 | 1.75 | 1 | … | … | … | … | ||
| G-M201 | 2 | 0.88 | 2 | 1.00 | (0.50) | 7.00 | (5.29) | ||
| J-M304 | 2 | 0.88 | 2 | 1.00 | (0.50) | 6.00 | (4.58) | ||
| South/southeast Asian | |||||||||
| Total | 39 | 17.11 | 31 | 0.81 | (0.04) | 0.98 | (0.01) | 8.80 | (4.15) |
| F-M89 (xM201, M69, M170, M304, M9) | 14 | 6.14 | 13 | 0.99 | (0.03) | 8.31 | (4.09) | ||
| O-M122 | 8 | 3.51 | 5 | 0.79 | (0.15) | 2.61 | (1.55) | ||
| H-M69 | 5 | 2.19 | 3 | 0.83 | (0.22) | 6.33 | (3.80) | ||
| O-M119 | 4 | 1.75 | 2 | 0.50 | (0.26) | 1.00 | (0.82) | ||
| R-M124 | 3 | 1.32 | 3 | 1.00 | (0.27) | 6.33 | (4.12) | ||
| K-M9 (XM20, M186, LLY22 g, M175, M45, M70) | 3 | 1.32 | 3 | 1.00 | (0.27) | 6.67 | (4.32) | ||
| O-M95 | 2 | 0.88 | 2 | 1.00 | (0.50) | 8.00 | (6.00) | ||
Note: Table S1 provides the full haplogroup and haplotype (STR) dataset.
Khoisan-specific Hg is in italics; pan-African Hgs are underlined; Bantu-specific Hgs are marked with an asterisk. We followed the nomenclature conventions recommended by the Y Chromosome Consortium.47
Number of individuals.
Number of observed STR haplotypes.
Gene diversity based on Hg profiles (Hg D) and standard deviation (SD).
Gene diversity based on STR haplotypes (Ht D) and standard deviation (SD).
Mean number of pairwise differences (Pi) and standard deviation (SD).
Hg R-M17 can also be of Indian origin.
Unlike the negligible European maternal component (<5%), the paternal contribution of West Eurasian lineages51–53 to the SAC turned out to be very important (>32.5%) (Figure 1, Table 2). This is attested by the presence of Hgs R-M343 (18%), I-M170 (8.8%), R-M17 (5.3%), E-M78 (2.2%), T-M70 (1.7%), G-M201 (0.9%), and J-M304 (0.9%). Specifically, the most predominant West Eurasian lineage was Hg R-M343, which is by far the most frequent among Western Europeans, particularly along the Atlantic coast, and is also sporadically observed in the Near East and north and sub-Saharan Africa.54 To further localize the geographic origin of the SAC Hg R-M343 chromosomes, we compared their internal STR haplotype variation (Table S1) with that observed at 52,270 haplotypes from 363 populations worldwide (Y Chromosome Haplotype Reference Database, YHRD) by using the 12 overlapping STRs: DYS19, DYS385a, DYS385b, DYS389-I, DYS389-II, DYS390, DYS391, DYS392, DYS393, DYS437, DYS438, and DYS439. Our matching analyses revealed that 19 out of the 30 STR haplotypes exhibited by our 41 Hg R-M343 samples matched haplotypes from West Europe, suggesting a major Western European origin for our Hg R-M343 samples. Likewise, an important European Y chromosome contribution is indicated by the high prevalence of Hg I-M170 (∼9%), which is virtually restricted to Europe.55 The third most important West Eurasian contribution to the SAC is illustrated by the presence of Hg R-M17, which is observed at high frequencies in Europe, particularly eastern Europe, but also in central and south Asia, including India.53,56,57 To characterize more precisely the geographic source of the 12 Hg R-M17 chromosomes, which account for ten STR haplotypes, we searched again for STR haplotype matches in the YHRD database. Most Hg R-M17 STR variation (seven haplotypes) matched with Western or Eastern Europeans, but a minority (three haplotypes) matched also in Asia, India, or north Africa. Finally, low frequencies of other typical West Eurasian Hgs (e.g., T-M70, G-M201) were observed. Altogether, our Y chromosome data revealed an important paternal West Eurasian component among the SAC, along with a predominant European contribution.
The least dominant paternal component observed in the SAC was that originating from south Asia56,58–61 (17.5%, Figure 1 and Table 2). F-M89 (xM201, M69, M170, M304, M9) (6.1%), H-M69 (2.2), and R-M124 (1.3%) are primarily associated with Indian populations,58,62 and O-M122 (3.5%), O-M119 (1.7%), K-M9 (x M20, M186, LLY22 g, M175, M45, M70) (1.3%) and O-M95 (0.9%) are mainly found in southeast Asian populations, including China.59,61 The STR haplotype profiles associated with each of these Hgs were clearly consistent with Indian and southeast Asian geographic origins, respectively. Similar to the maternal component, the paternal southeast Asian lineages could have been introduced into the SAC population from Madagascar, via their prior existence among Malagasy.42
Taken as a whole, both the mtDNA and NRY Hg profiles observed among the SAC population are concordant with a highly admixed population but also reveal exceedingly unbalanced gender-specific continental and within-continental genetic contributions. Indeed, our analyses indicate sharp and significant gender-related differences in the European and African contributions to the SAC (Figure 1) (χ2 test, p < 10−15). The maternal European contribution turned out to be negligible (∼5%), whereas its paternal counterpart is very high (at least 32.4%) and similar in size to the African component (Figure 1 and Tables 1 and 2). Conversely, the maternal African contribution (79%) was almost two-fold the paternal contribution (45%). It is worth elaborating on this African component observed among the SAC. On the maternal side, at least 76% of the African variation (i.e., 60% of the total variation, namely the presence of the different L0d subclades) directly derives from the Khoisan. On the paternal side, although our phylogeographic data attest to some Khoisan and Bantu-specific contributions, a large nonspecific pan-African component cannot be fully resolved because of limitations of the current NRY phylogeny and of comparative databases. An additional intriguing observation is the lack of the Khoisan Hg L0k among the SAC people. Vigilant et al.32 reported sharp differences in the occurrence of Hg L0k in the !Xun and !Kung populations; it was 26% in the former but only 4% in the latter. Therefore, the possibility that L0d and L0k have a within-Khoisan structure is likely and might suggest that only some of the Khoisan peoples contributed to the SAC population.
To illustrate the gender-biased admixture depicted by our phylogeographic analysis and to understand the position of the SAC in the context of a global set of putative parental populations, we next used multidimensional scaling (MDS) analysis (Figure 2). Using Hg frequencies of mtDNA and NRY in the SAC as well as in five parental metapopulations (Khoisan, Bantu, Europeans, Indians, and southeast Asians; see legend of Figure 2 for details on the specific populations used), we calculated genetic distances by means of the DJ software as previously described63 and visualized them in the form of an MDS plot by using Statistica 6.0 software. On the maternal side, the SAC population clustered with the Khoisan, and its position is clearly separated from the rest of the populations, including the African Bantus (Figure 2A). In contrast, the NRY-based MDS plot positions the SAC in an intermediate location between African, European, and south/southeast Asian populations (Figure 2B). To formally assess the impact of the various continental and within-continental contributions to the SAC, we carried out admixture analysis with the coalescent-based mY estimator, which takes into account allele frequencies and molecular information,64 as implemented in Admix 2.0,65 and treated the SAC as a hybrid of five parental populations. Mean admixture proportions and standard deviations for each component are represented schematically in Figure 3. This analysis found that the highest mean proportion of maternal ancestry of the SAC corresponds to the Khoisan, whereas the highest mean proportion of paternal ancestry corresponds to Europeans, followed by the Khoisan. It is worth noting that our MDS and admixture analyses are in contrast to each other with respect to the African paternal origin of the SAC; the former positions the SAC somehow closer to Bantus (Figure 2B), whereas the latter indicates a Khoisan origin (Figure 3). This apparent contradiction most likely results from the current phylogeographic limitations in discriminating between the Khoisan- and Bantu-specific parts within the more general pan-African paternal component, highlighting the general need for studies aiming to improve the resolution of the NRY pan-African phylogeny.
Figure 2.
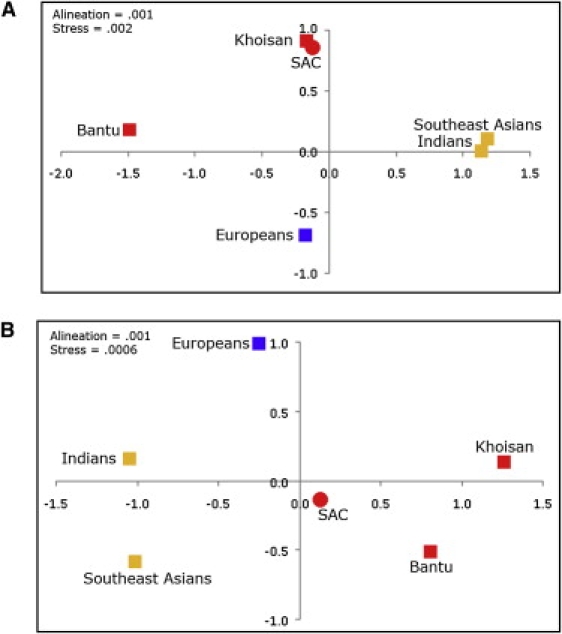
MDS Plots Illustrating the Relationships between the South African Coloured Population and the Five Putative Parental Populations
(A) MDS plot based on mtDNA Hg frequencies.
(B) MDS plot based on NRY Hg frequencies.
The five metapopulations used as putative parental populations include Europeans, Indians, Khoisan, Bantu speakers, and southeast Asians. The European dataset included British, French, Dutch, German, and Austrian populations; the Indian dataset included populations from the Bengal Bay coast (Sri Lanka, Bangladesh, and eastern states of India); the Khoisan dataset included all available Khoisan data; the Bantu dataset included Bantu-speaking populations from South Africa and central Africa; and the southeast Asian dataset included populations from the Malay Peninsula, Sumatra, Java, and neighboring smaller isles. Because different individuals and populations have been analyzed for mtDNA and NRY, sample sizes from these metapopulations differ between the two analyses. Sample sizes of European, Indian, Khoisan, Bantu, and southeast Asian populations were, respectively: n = 6092, n = 1246, n = 298, n = 459, and n = 616 for mtDNA and n = 353, n = 766, n = 122, n = 499, and n = 66 for NRY. The lower population sample sizes for the NRY data result from the nonoverlapping nature of the markers used in the different studies. These comparative data were obtained from the MURKA database, compiled from published sources by O. Balanovsky, V. Zaporozhchenko, R. Sychev, A. Pshenichnov, and E. Balanovska.
Figure 3.
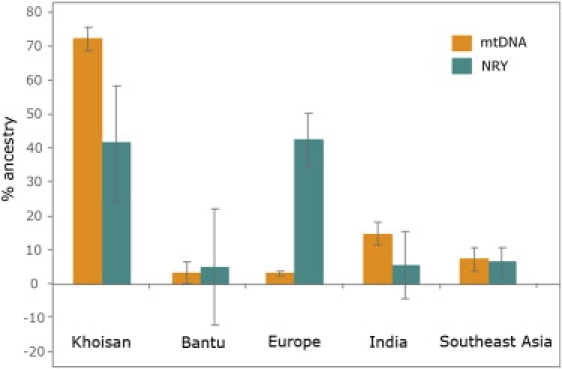
Diverse Continental and within-Continental Admixture Proportions in the South African Coloured Population
Mean Khoisan, Bantu-speaking, European, Indian, and southeast Asian admixture proportions among the SAC, on the basis of the mY estimator, are represented as bars for the mtDNA and NRY data. Error bars indicate standard deviations. The five parental metapopulations used for this analysis, as well as their sample sizes, were the same as those used for the MDS analysis (Figure 2). Time of the initial admixture event was set to 400 years, and standard deviations were calculated on the basis of 10,000 bootstraps.
This study reveals several trends, which shed light on the mode in which this admixed population was recently founded. First, three major continental genetic contributions—African, European and Asian—are clearly visible. Second, more European males and African females than European females and African males were involved in the foundation of the population, whereas the south Asian contribution appears to be similar from both sexes. Third, there is an overwhelming contribution of Khoisan peoples to the gene pool of the SAC. Fourth, although the different continental contributions are more equally distributed within the SAC on the paternal side, the maternal counterpart is strongly skewed toward an African, mainly Khoisan, origin. These conclusions add to current genetic knowledge of the SAC by unequivocally identifying the gender-specific differential contributions to this population and by directly linking the contemporary SAC to the Khoisan. Interestingly, contemporary demographic data from the South African population census, combined with the known Hg L0d frequencies observed among the SAC and Khoisan, suggests that the majority of individuals currently carrying the Khoisan-specific L0d clade actually belong to the SAC rather than to the Khoisan. This demonstrates the successful survival of a globally rare and deep-rooted mtDNA Hg in a recently admixed population.
More generally, our genetic data extend and support current knowledge from historical records describing the common phenomenon of miscegenation due to sexual encounters between European male settlers, mainly from the Netherlands, Britain, Germany, and France, or male slaves and autochthonous Khoisan women.6 This is not surprising in view of the singular shortage of European women and the reports stating that the proportion of adult male slaves to adult females was up to six to one.6 A large number of female slaves were given their freedom, and many subsequently married European men after their manumission.8 Conversely, unions between autochthonous African or southeast Asian slave males and European women were not tolerated.8 Although Khoisan women were frequently incorporated into the settler households as servants, Khoisan men had no role and were marginalized by the society.7 Offspring of mixed unions usually became members of the newly emerging community and continued to blend within it, establishing the basis of the contemporary SAC population.6
In summary, our results indicate that the gene pool of the contemporary SAC is made up of distinct continental and within-continental components, which have participated in the foundation of this recently admixed population in a strong gender-biased fashion. This pattern within the microcosm of the SAC community reflects the plethora of cultures, languages, and religious beliefs practiced in South Africa, which hosts ethnically diverse populations. Anecdotally, it is noteworthy that the three most frequent combinations of paired paternal/maternal lineages observed among contemporary Coloured are R-M343/L0d, E-M2/L0d, and O-M175/L0d, capturing the essence and the outcome of the first European, pan-African, and south Asian encounters with the original Khoisan-speaking peoples of the Cape of Good Hope approximately 350 years ago.
Acknowledgments
We warmly thank all study participants. We are very grateful to Blandine Massonnet for help in genotyping of mtDNA. This work was supported by Institut Pasteur and by the Centre National de la Recherche Scientifique (CNRS). Mitochondrial DNA and Y chromosome databases used for comparative analyses were partly supported by the Russian Fund of Humanities (grant 07-01-12114) and created with the help of Andrey Pshenichnov, Roman Sychev, and Elena Balanovska. P.D.V.H. and E.G.H. are supported by the Department of Science and Technology (DST) and the National Research Foundation (NRF) Centre of Excellence for Biomedical Tuberculosis Research.
Supplemental Data
Web Resources
The URLs for data presented herein are as follows:
Y Chromosome Haplotype Reference Database, YHRD, http://www.yhrd.org/
Fluxus Engineering, http://www.fluxus-technology.com/
Statistics South Africa 2007, http://www.statssa.gov.za/
References
- 1.Smith M.W., O'Brien S.J. Mapping by admixture linkage disequilibrium: Advances, limitations and guidelines. Nat. Rev. Genet. 2005;6:623–632. doi: 10.1038/nrg1657. [DOI] [PubMed] [Google Scholar]
- 2.Smith M.W., Lautenberger J.A., Shin H.D., Chretien J.P., Shrestha S., Gilbert D.A., O'Brien S.J. Markers for mapping by admixture linkage disequilibrium in African American and Hispanic populations. Am. J. Hum. Genet. 2001;69:1080–1094. doi: 10.1086/323922. [DOI] [PMC free article] [PubMed] [Google Scholar]
- 3.Tian C., Hinds D.A., Shigeta R., Kittles R., Ballinger D.G., Seldin M.F. A genomewide single-nucleotide-polymorphism panel with high ancestry information for African American admixture mapping. Am. J. Hum. Genet. 2006;79:640–649. doi: 10.1086/507954. [DOI] [PMC free article] [PubMed] [Google Scholar]
- 4.Mao X., Bigham A.W., Mei R., Gutierrez G., Weiss K.M., Brutsaert T.D., Leon-Velarde F., Moore L.G., Vargas E., McKeigue P.M. A genomewide admixture mapping panel for Hispanic/Latino populations. Am. J. Hum. Genet. 2007;80:1171–1178. doi: 10.1086/518564. [DOI] [PMC free article] [PubMed] [Google Scholar]
- 5.Tian C., Hinds D.A., Shigeta R., Adler S.G., Lee A., Pahl M.V., Silva G., Belmont J.W., Hanson R.L., Knowler W.C. A genomewide single-nucleotide-polymorphism panel for Mexican American admixture mapping. Am. J. Hum. Genet. 2007;80:1014–1023. doi: 10.1086/513522. [DOI] [PMC free article] [PubMed] [Google Scholar]
- 6.Nurse G.T., Weiner S., Jenkins T. Clarendon Press; Oxford: 1985. The Peoples of Southern Africa and Their Affinities. [Google Scholar]
- 7.Mountain A. David Philips Publishers; Claremont, South Africa: 2003. The First People of the Cape. [Google Scholar]
- 8.Shell R. Witwatersrand University Press; Johannesburg, South Africa: 1994. Children of bondage. [Google Scholar]
- 9.Tishkoff S.A., Reed F.A., Friedlaender F.R., Ehret C., Ranciaro A., Froment A., Hirbo J.B., Awomoyi A.A., Bodo J.M., Doumbo O. The genetic structure and history of Africans and African Americans. Science. 2009;324:1035–1044. doi: 10.1126/science.1172257. [DOI] [PMC free article] [PubMed] [Google Scholar]
- 10.Patterson N., Petersen D.C., van der Ross R.E., Sudoyo H., Glashoff R.H., Marzuki S., Reich D., Hayes V.M. Genetic structure of a unique admixed population: Implications for medical research. Hum. Mol. Genet. 2010;19:411–419. doi: 10.1093/hmg/ddp505. [DOI] [PubMed] [Google Scholar]
- 11.Cavalli-Sforza L.L., Feldman M.W. The application of molecular genetic approaches to the study of human evolution. Nat. Genet. 2003;33(Suppl):266–275. doi: 10.1038/ng1113. [DOI] [PubMed] [Google Scholar]
- 12.Jobling M.A., Tyler-Smith C. The human Y chromosome: An evolutionary marker comes of age. Nat. Rev. Genet. 2003;4:598–612. doi: 10.1038/nrg1124. [DOI] [PubMed] [Google Scholar]
- 13.Pakendorf B., Stoneking M. Mitochondrial DNA and human evolution. Annu. Rev. Genomics Hum. Genet. 2005;6:165–183. doi: 10.1146/annurev.genom.6.080604.162249. [DOI] [PubMed] [Google Scholar]
- 14.Underhill P.A., Kivisild T. Use of y chromosome and mitochondrial DNA population structure in tracing human migrations. Annu. Rev. Genet. 2007;41:539–564. doi: 10.1146/annurev.genet.41.110306.130407. [DOI] [PubMed] [Google Scholar]
- 15.Underhill P.A., Passarino G., Lin A.A., Shen P., Mirazon Lahr M., Foley R.A., Oefner P.J., Cavalli-Sforza L.L. The phylogeography of Y chromosome binary haplotypes and the origins of modern human populations. Ann. Hum. Genet. 2001;65:43–62. doi: 10.1046/j.1469-1809.2001.6510043.x. [DOI] [PubMed] [Google Scholar]
- 16.Zhivotovsky L.A., Underhill P.A., Cinnioglu C., Kayser M., Morar B., Kivisild T., Scozzari R., Cruciani F., Destro-Bisol G., Spedini G. The effective mutation rate at Y chromosome short tandem repeats, with application to human population-divergence time. Am. J. Hum. Genet. 2004;74:50–61. doi: 10.1086/380911. [DOI] [PMC free article] [PubMed] [Google Scholar]
- 17.Torroni A., Achilli A., Macaulay V., Richards M., Bandelt H.J. Harvesting the fruit of the human mtDNA tree. Trends Genet. 2006;22:339–345. doi: 10.1016/j.tig.2006.04.001. [DOI] [PubMed] [Google Scholar]
- 18.Bamshad M.J., Watkins W.S., Dixon M.E., Jorde L.B., Rao B.B., Naidu J.M., Prasad B.V., Rasanayagam A., Hammer M.F. Female gene flow stratifies Hindu castes. Nature. 1998;395:651–652. doi: 10.1038/27103. [DOI] [PubMed] [Google Scholar]
- 19.Destro-Bisol G., Donati F., Coia V., Boschi I., Verginelli F., Caglia A., Tofanelli S., Spedini G., Capelli C. Variation of female and male lineages in sub-Saharan populations: the importance of sociocultural factors. Mol. Biol. Evol. 2004;21:1673–1682. doi: 10.1093/molbev/msh186. [DOI] [PubMed] [Google Scholar]
- 20.Dupanloup I., Pereira L., Bertorelle G., Calafell F., Prata M.J., Amorim A., Barbujani G. A recent shift from polygyny to monogamy in humans is suggested by the analysis of worldwide Y-chromosome diversity. J. Mol. Evol. 2003;57:85–97. doi: 10.1007/s00239-003-2458-x. [DOI] [PubMed] [Google Scholar]
- 21.Kayser M., Brauer S., Weiss G., Schiefenhovel W., Underhill P., Shen P., Oefner P., Tommaseo-Ponzetta M., Stoneking M. Reduced Y-chromosome, but not mitochondrial DNA, diversity in human populations from West New Guinea. Am. J. Hum. Genet. 2003;72:281–302. doi: 10.1086/346065. [DOI] [PMC free article] [PubMed] [Google Scholar]
- 22.Oota H., Settheetham-Ishida W., Tiwawech D., Ishida T., Stoneking M. Human mtDNA and Y-chromosome variation is correlated with matrilocal versus patrilocal residence. Nat. Genet. 2001;29:20–21. doi: 10.1038/ng711. [DOI] [PubMed] [Google Scholar]
- 23.Salem A.H., Badr F.M., Gaballah M.F., Paabo S. The genetics of traditional living: Y-chromosomal and mitochondrial lineages in the Sinai Peninsula. Am. J. Hum. Genet. 1996;59:741–743. [PMC free article] [PubMed] [Google Scholar]
- 24.Wilder J.A., Kingan S.B., Mobasher Z., Pilkington M.M., Hammer M.F. Global patterns of human mitochondrial DNA and Y-chromosome structure are not influenced by higher migration rates of females versus males. Nat. Genet. 2004;36:1122–1125. doi: 10.1038/ng1428. [DOI] [PubMed] [Google Scholar]
- 25.Wilder J.A., Mobasher Z., Hammer M.F. Genetic evidence for unequal effective population sizes of human females and males. Mol. Biol. Evol. 2004;21:2047–2057. doi: 10.1093/molbev/msh214. [DOI] [PubMed] [Google Scholar]
- 26.Wooding S., Ostler C., Prasad B.V., Watkins W.S., Sung S., Bamshad M., Jorde L.B. Directional migration in the Hindu castes: inferences from mitochondrial, autosomal and Y-chromosomal data. Hum. Genet. 2004;115:221–229. doi: 10.1007/s00439-004-1130-x. [DOI] [PubMed] [Google Scholar]
- 27.Seielstad M.T., Minch E., Cavalli-Sforza L.L. Genetic evidence for a higher female migration rate in humans. Nat. Genet. 1998;20:278–280. doi: 10.1038/3088. [DOI] [PubMed] [Google Scholar]
- 28.Achilli A., Rengo C., Battaglia V., Pala M., Olivieri A., Fornarino S., Magri C., Scozzari R., Babudri N., Santachiara-Benerecetti A.S. Saami and Berbers–an unexpected mitochondrial DNA link. Am. J. Hum. Genet. 2005;76:883–886. doi: 10.1086/430073. [DOI] [PMC free article] [PubMed] [Google Scholar]
- 29.Behar D.M., Villems R., Soodyall H., Blue-Smith J., Pereira L., Metspalu E., Scozzari R., Makkan H., Tzur S., Comas D. The dawn of human matrilineal diversity. Am. J. Hum. Genet. 2008;82:1130–1140. doi: 10.1016/j.ajhg.2008.04.002. [DOI] [PMC free article] [PubMed] [Google Scholar]
- 30.Palanichamy M.G., Sun C., Agrawal S., Bandelt H.J., Kong Q.P., Khan F., Wang C.Y., Chaudhuri T.K., Palla V., Zhang Y.P. Phylogeny of mitochondrial DNA macrohaplogroup N in India, based on complete sequencing: implications for the peopling of South Asia. Am. J. Hum. Genet. 2004;75:966–978. doi: 10.1086/425871. [DOI] [PMC free article] [PubMed] [Google Scholar]
- 31.Salas A., Richards M., De la Fe T., Lareu M.V., Sobrino B., Sanchez-Diz P., Macaulay V., Carracedo A. The making of the African mtDNA landscape. Am. J. Hum. Genet. 2002;71:1082–1111. doi: 10.1086/344348. [DOI] [PMC free article] [PubMed] [Google Scholar]
- 32.Vigilant L., Stoneking M., Harpending H., Hawkes K., Wilson A.C. African populations and the evolution of human mitochondrial DNA. Science. 1991;253:1503–1507. doi: 10.1126/science.1840702. [DOI] [PubMed] [Google Scholar]
- 33.Knight A., Underhill P.A., Mortensen H.M., Zhivotovsky L.A., Lin A.A., Henn B.M., Louis D., Ruhlen M., Mountain J.L. African Y chromosome and mtDNA divergence provides insight into the history of click languages. Curr. Biol. 2003;13:464–473. doi: 10.1016/s0960-9822(03)00130-1. [DOI] [PubMed] [Google Scholar]
- 34.Tishkoff S.A., Gonder M.K., Henn B.M., Mortensen H., Knight A., Gignoux C., Fernandopulle N., Lema G., Nyambo T.B., Ramakrishnan U. History of click-speaking populations of Africa inferred from mtDNA and Y chromosome genetic variation. Mol. Biol. Evol. 2007;24:2180–2195. doi: 10.1093/molbev/msm155. [DOI] [PubMed] [Google Scholar]
- 35.Pereira L., Macaulay V., Torroni A., Scozzari R., Prata M.J., Amorim A. Prehistoric and historic traces in the mtDNA of Mozambique: Insights into the Bantu expansions and the slave trade. Ann. Hum. Genet. 2001;65:439–458. doi: 10.1017/S0003480001008855. [DOI] [PubMed] [Google Scholar]
- 36.Kong Q.P., Bandelt H.J., Sun C., Yao Y.G., Salas A., Achilli A., Wang C.Y., Zhong L., Zhu C.L., Wu S.F. Updating the East Asian mtDNA phylogeny: A prerequisite for the identification of pathogenic mutations. Hum. Mol. Genet. 2006;15:2076–2086. doi: 10.1093/hmg/ddl130. [DOI] [PubMed] [Google Scholar]
- 37.Metspalu M., Kivisild T., Metspalu E., Parik J., Hudjashov G., Kaldma K., Serk P., Karmin M., Behar D.M., Gilbert M.T. Most of the extant mtDNA boundaries in south and southwest Asia were likely shaped during the initial settlement of Eurasia by anatomically modern humans. BMC Genet. 2004;5:26. doi: 10.1186/1471-2156-5-26. [DOI] [PMC free article] [PubMed] [Google Scholar]
- 38.Quintana-Murci L., Chaix R., Wells R.S., Behar D.M., Sayar H., Scozzari R., Rengo C., Al-Zahery N., Semino O., Santachiara-Benerecetti A.S. Where west meets east: The complex mtDNA landscape of the southwest and Central Asian corridor. Am. J. Hum. Genet. 2004;74:827–845. doi: 10.1086/383236. [DOI] [PMC free article] [PubMed] [Google Scholar]
- 39.Thangaraj K., Chaubey G., Singh V.K., Vanniarajan A., Thanseem I., Reddy A.G., Singh L. In situ origin of deep rooting lineages of mitochondrial Macrohaplogroup ‘M’ in India. BMC Genomics. 2006;7:151. doi: 10.1186/1471-2164-7-151. [DOI] [PMC free article] [PubMed] [Google Scholar]
- 40.Sun C., Kong Q.P., Palanichamy M.G., Agrawal S., Bandelt H.J., Yao Y.G., Khan F., Zhu C.L., Chaudhuri T.K., Zhang Y.P. The dazzling array of basal branches in the mtDNA macrohaplogroup M from India as inferred from complete genomes. Mol. Biol. Evol. 2006;23:683–690. doi: 10.1093/molbev/msj078. [DOI] [PubMed] [Google Scholar]
- 41.Baig M.M., Khan A.A., Kulkarni K.M. Mitochondrial DNA diversity in tribal and caste groups of Maharashtra (India) and its implication on their genetic origins. Ann. Hum. Genet. 2004;68:453–460. doi: 10.1046/j.1529-8817.2004.00108.x. [DOI] [PubMed] [Google Scholar]
- 42.Tofanelli S., Bertoncini S., Castri L., Luiselli D., Calafell F., Donati G., Paoli G. On the origins and admixture of Malagasy: New evidence from high-resolution analyses of paternal and maternal lineages. Mol. Biol. Evol. 2009;26:2109–2124. doi: 10.1093/molbev/msp120. [DOI] [PubMed] [Google Scholar]
- 43.Richards M., Macaulay V., Hickey E., Vega E., Sykes B., Guida V., Rengo C., Sellitto D., Cruciani F., Kivisild T. Tracing European founder lineages in the Near Eastern mtDNA pool. Am. J. Hum. Genet. 2000;67:1251–1276. [PMC free article] [PubMed] [Google Scholar]
- 44.Torroni A., Richards M., Macaulay V., Forster P., Villems R., Norby S., Savontaus M.L., Huoponen K., Scozzari R., Bandelt H.J. mtDNA haplogroups and frequency patterns in Europe. Am. J. Hum. Genet. 2000;66:1173–1177. doi: 10.1086/302789. [DOI] [PMC free article] [PubMed] [Google Scholar]
- 45.Behar D.M., Rosset S., Blue-Smith J., Balanovsky O., Tzur S., Comas D., Mitchell R.J., Quintana-Murci L., Tyler-Smith C., Wells R.S. The Genographic Project public participation mitochondrial DNA database. PLoS Genet. 2007;3:e104. doi: 10.1371/journal.pgen.0030104. [DOI] [PMC free article] [PubMed] [Google Scholar]
- 46.Forster P., Harding R., Torroni A., Bandelt H.J. Origin and evolution of Native American mtDNA variation: a reappraisal. Am. J. Hum. Genet. 1996;59:935–945. [PMC free article] [PubMed] [Google Scholar]
- 47.Karafet T.M., Mendez F.L., Meilerman M.B., Underhill P.A., Zegura S.L., Hammer M.F. New binary polymorphisms reshape and increase resolution of the human Y chromosomal haplogroup tree. Genome Res. 2008;18:830–838. doi: 10.1101/gr.7172008. [DOI] [PMC free article] [PubMed] [Google Scholar]
- 48.Sims L.M., Garvey D., Ballantyne J. Sub-populations within the major European and African derived haplogroups R1b3 and E3a are differentiated by previously phylogenetically undefined Y-SNPs. Hum. Mutat. 2007;28:97. doi: 10.1002/humu.9469. [DOI] [PubMed] [Google Scholar]
- 49.Semino O., Santachiara-Benerecetti A.S., Falaschi F., Cavalli-Sforza L.L., Underhill P.A. Ethiopians and Khoisan share the deepest clades of the human Y-chromosome phylogeny. Am. J. Hum. Genet. 2002;70:265–268. doi: 10.1086/338306. [DOI] [PMC free article] [PubMed] [Google Scholar]
- 50.Rosa A., Brehm A., Kivisild T., Metspalu E., Villems R. MtDNA profile of West Africa Guineans: Towards a better understanding of the Senegambia region. Ann. Hum. Genet. 2004;68:340–352. doi: 10.1046/j.1529-8817.2004.00100.x. [DOI] [PubMed] [Google Scholar]
- 51.Zerjal T., Beckman L., Beckman G., Mikelsaar A.V., Krumina A., Kucinskas V., Hurles M.E., Tyler-Smith C. Geographical, linguistic, and cultural influences on genetic diversity: Y-chromosomal distribution in Northern European populations. Mol. Biol. Evol. 2001;18:1077–1087. doi: 10.1093/oxfordjournals.molbev.a003879. [DOI] [PubMed] [Google Scholar]
- 52.Semino O., Passarino G., Oefner P.J., Lin A.A., Arbuzova S., Beckman L.E., De Benedictis G., Francalacci P., Kouvatsi A., Limborska S. The genetic legacy of Paleolithic Homo sapiens sapiens in extant Europeans: A Y chromosome perspective. Science. 2000;290:1155–1159. doi: 10.1126/science.290.5494.1155. [DOI] [PubMed] [Google Scholar]
- 53.Wells R.S., Yuldasheva N., Ruzibakiev R., Underhill P.A., Evseeva I., Blue-Smith J., Jin L., Su B., Pitchappan R., Shanmugalakshmi S. The Eurasian heartland: a continental perspective on Y-chromosome diversity. Proc. Natl. Acad. Sci. USA. 2001;98:10244–10249. doi: 10.1073/pnas.171305098. [DOI] [PMC free article] [PubMed] [Google Scholar]
- 54.Bosch E., Calafell F., Comas D., Oefner P.J., Underhill P.A., Bertranpetit J. High-resolution analysis of human Y-chromosome variation shows a sharp discontinuity and limited gene flow between northwestern Africa and the Iberian Peninsula. Am. J. Hum. Genet. 2001;68:1019–1029. doi: 10.1086/319521. [DOI] [PMC free article] [PubMed] [Google Scholar]
- 55.Rootsi S., Magri C., Kivisild T., Benuzzi G., Help H., Bermisheva M., Kutuev I., Barac L., Pericic M., Balanovsky O. Phylogeography of Y-chromosome haplogroup I reveals distinct domains of prehistoric gene flow in europe. Am. J. Hum. Genet. 2004;75:128–137. doi: 10.1086/422196. [DOI] [PMC free article] [PubMed] [Google Scholar]
- 56.Quintana-Murci L., Krausz C., Zerjal T., Sayar S.H., Hammer M.F., Mehdi S.Q., Ayub Q., Qamar R., Mohyuddin A., Radhakrishna U. Y-chromosome lineages trace diffusion of people and languages in southwestern Asia. Am. J. Hum. Genet. 2001;68:537–542. doi: 10.1086/318200. [DOI] [PMC free article] [PubMed] [Google Scholar]
- 57.Underhill P.A., Myres N.M., Rootsi S., Metspalu M., Zhivotovsky L.A., King R.J., Lin A.A., Chow C.E., Semino O., Battaglia V. Separating the post-Glacial coancestry of European and Asian Y chromosomes within haplogroup R1a. Eur. J. Hum. Genet. 2009 doi: 10.1038/ejhg.2009.194. Published online November 4, 2009. [DOI] [PMC free article] [PubMed] [Google Scholar]
- 58.Kivisild T., Rootsi S., Metspalu M., Mastana S., Kaldma K., Parik J., Metspalu E., Adojaan M., Tolk H.V., Stepanov V. The genetic heritage of the earliest settlers persists both in Indian tribal and caste populations. Am. J. Hum. Genet. 2003;72:313–332. doi: 10.1086/346068. [DOI] [PMC free article] [PubMed] [Google Scholar]
- 59.Xue Y., Zerjal T., Bao W., Zhu S., Shu Q., Xu J., Du R., Fu S., Li P., Hurles M.E. Male demography in East Asia: A north-south contrast in human population expansion times. Genetics. 2006;172:2431–2439. doi: 10.1534/genetics.105.054270. [DOI] [PMC free article] [PubMed] [Google Scholar]
- 60.Deng W., Shi B., He X., Zhang Z., Xu J., Li B., Yang J., Ling L., Dai C., Qiang B. Evolution and migration history of the Chinese population inferred from Chinese Y-chromosome evidence. J. Hum. Genet. 2004;49:339–348. doi: 10.1007/s10038-004-0154-3. [DOI] [PubMed] [Google Scholar]
- 61.Karafet T., Xu L., Du R., Wang W., Feng S., Wells R.S., Redd A.J., Zegura S.L., Hammer M.F. Paternal population history of East Asia: Sources, patterns, and microevolutionary processes. Am. J. Hum. Genet. 2001;69:615–628. doi: 10.1086/323299. [DOI] [PMC free article] [PubMed] [Google Scholar]
- 62.Watkins W.S., Thara R., Mowry B.J., Zhang Y., Witherspoon D.J., Tolpinrud W., Bamshad M.J., Tirupati S., Padmavati R., Smith H. Genetic variation in South Indian castes: Evidence from Y-chromosome, mitochondrial, and autosomal polymorphisms. BMC Genet. 2008;9:86. doi: 10.1186/1471-2156-9-86. [DOI] [PMC free article] [PubMed] [Google Scholar]
- 63.Balanovsky O., Rootsi S., Pshenichnov A., Kivisild T., Churnosov M., Evseeva I., Pocheshkhova E., Boldyreva M., Yankovsky N., Balanovska E. Two sources of the Russian patrilineal heritage in their Eurasian context. Am. J. Hum. Genet. 2008;82:236–250. doi: 10.1016/j.ajhg.2007.09.019. [DOI] [PMC free article] [PubMed] [Google Scholar]
- 64.Bertorelle G., Excoffier L. Inferring admixture proportions from molecular data. Mol. Biol. Evol. 1998;15:1298–1311. doi: 10.1093/oxfordjournals.molbev.a025858. [DOI] [PubMed] [Google Scholar]
- 65.Dupanloup I., Bertorelle G. Inferring admixture proportions from molecular data: Extension to any number of parental populations. Mol. Biol. Evol. 2001;18:672–675. doi: 10.1093/oxfordjournals.molbev.a003847. [DOI] [PubMed] [Google Scholar]
- 66.Richards M.B., Macaulay V.A., Bandelt H.J., Sykes B.C. Phylogeography of mitochondrial DNA in western Europe. Ann. Hum. Genet. 1998;62:241–260. doi: 10.1046/j.1469-1809.1998.6230241.x. [DOI] [PubMed] [Google Scholar]
Associated Data
This section collects any data citations, data availability statements, or supplementary materials included in this article.