The use of a single exponential function for analysis and variably sampled diffusion weighting plays a substantial role in causing the variability in apparent diffusion coefficient of healthy kidneys.
Abstract
Purpose:
To investigate whether variability in reported renal apparent diffusion coefficient (ADC) values in literature can be explained by the use of different diffusion weightings (b values) and the use of a monoexponential model to calculate ADC.
Materials and Methods:
This prospective study was approved by institutional review board and was HIPAA-compliant, and all subjects gave written informed consent. Diffusion-weighted (DW) imaging of the kidneys was performed in three healthy volunteers to generate reference diffusion decay curves. In a literature meta-analysis, the authors resampled the reference curves at the various b values used in 19 published studies of normal kidneys (reported ADC = [2.0–4.1] × 10−3 mm2 / sec for cortex and [1.9–5.1] × 10−3 mm2 / sec for medulla) and then fitted the resampled signals by monoexponential model to produce “predicted” ADC. Correlation plots were used to compare the predicted ADC values with the published values obtained with the same b values.
Results:
Significant correlation was found between the reported and predicted ADC values for whole renal parenchyma (R2 = 0.50, P = .002), cortex (R2 = 0.87, P = .0002), and medulla (R2 = 0.61, P = .0129), indicating that most of the variability in reported ADC values arises from limitations of a monoexponential model and use of different b values.
Conclusion:
The use of a monoexponential function for DW imaging analysis and variably sampled diffusion weighting plays a substantial role in causing the variability in ADC of healthy kidneys. For maximum reliability in renal apparent diffusion coefficient quantification, data for monoexponential analysis should be acquired at a fixed set of b values or a biexponential model should be used.
© RSNA, 2010
Introduction
Diffusion-weighted (DW) magnetic resonance (MR) imaging (1–3) can be used to probe the structure of biologic tissue noninvasively by measuring the diffusion of water molecules. The main quantitative parameter used to interpret DW imaging is apparent diffusion coefficient (ADC). This parameter is estimated by fitting a series of images acquired with different diffusion weightings (b values) using a simple monoexponential model. Recently, the widespread availability of DW sequences for abdominal imaging has led to a proliferation of reports describing potential clinical utility of ADC across a range of applications, including cancer (4), liver fibrosis/cirrhosis (5,6), and renal diseases (2,7–9). While early publications from individual laboratories have found promising results defining cutoffs in ADC values for normal states and different states of disease, differences in these reported values in different laboratories have seriously hampered the field.
For example, in the kidney, ADC has been found to be a sensitive indicator of renal dysfunction. Thoeny et al (2) found that corticomedullary difference in ADC values was diminished in transplanted kidney, compared with normal native kidneys. Muller et al (1) reported increased renal ADC due to rehydration. Yildirim et al (7) reported that ADC decreased in kidneys with renal artery stenosis. Xu et al (8) observed a positive correlation between glomerular filtration rate and ADC. And yet, despite these promising findings, wider use of renal DW imaging has been limited by the considerable variation in the renal ADC that has been reported. In healthy kidneys, published ADC values vary from 2.0 × 10⁻³ to 4.1 × 10⁻³ mm2/sec in the cortex and 1.9 × 10⁻³ to 5.1 × 10⁻³ mm2/sec in the medulla (1,2,7,8,10–25) (Table 1).
Table 1.
Previous Studies with Renal ADC Estimates
Note.—NA = not available.
Data are × 10 ⁻ 3 mm 2/sec.
BH = breath hold, EPI = echo-planar imaging, FB = free breathing, MS = multishot, SE = spin echo, SS = single shot, STEAM = stimulated-echo acquisition mode.
It is well-known from in vivo brain DW imaging that the simple monoexponential model for DW imaging has measurable limitations. In the low b value regimen (less than 200 sec/mm2), factors other than passive diffusion, such as capillary perfusion, contribute measurably to the signal intensity decay, a phenomenon known as intravoxel incoherent motion (IVIM) (26). When analyzed with a biexponential model, IVIM effects provide useful sensitivity to perfusion that is modified in disease states. Extensive human (27,28) and animal (29,30) IVIM imaging has been devoted to assessing cerebral microcirculation, and animal model tumors, with pathologically abundant vascularity, have also provided an ideal target for the technique (31). However, if ignored because of the use of a monoexponential model, IVIM effects can distort the measurement of the ADC. Furthermore, IVIM effects in abdominal organs, especially the kidneys, should be more pronounced than in the brain. In kidney, the fractional vascular volume is 25%–40% (32), much higher than that found in the brain (approximately 5%). Besides the high vascularity, tubular flow and water reabsorption might further enhance the IVIM effect in renal tissue.
We hypothesize that the IVIM, driven by multiple active flow processes, makes the monoexponential model insufficient for completely describing abdominal DW imaging and leads to increased variability in ADC. Additionally, an important consequence of the inadequacy of the monoexponential model for renal DW imaging is a resultant dependence of ADC results on the choice of diffusion weighting factors (b values).
The purpose of the study was thus to investigate whether variability in reported ADC values in literature can be explained by the use of different b values and the use of a monoexponential model to calculate ADC.
Materials and Methods
This prospective study was approved by institutional review board and was compliant with the Health Insurance Portability and Accountability Act, and all subjects gave written informed consent.
A literature review was performed by using PubMed to search for studies published between January 1990 and December 2008 that measured ADC in the kidneys of healthy volunteers (Table 1). On the basis of the various b value sets and the resulting ADC in these studies, a simulation study was performed to evaluate the variability of ADC associated with the use of monoexponential model and different b value sets. To aid in performing the simulation, “ideal” signal decay curves were constructed based on highly sampled DW data from healthy kidney acquisitions. Details of the study are as follows.
Following written informed consent, three healthy volunteers (two male and one female; mean age, 30 years; age range, 20–39 years; nonfasting conditions) were included in this study. Each volunteer was imaged in a clinical 3-T MR imager (TIM Trio; Siemens, Erlangen, Germany) by using a combination of eight-channel spine array and four-channel body array coils. Single-shot echo-planar free-breathing DW images were acquired with the following parameters: five coronal sections with a thickness of 6 mm, no intersection gap; field of view, 345 × 410 mm; acquisition matrix, 162 × 192; repetition time, 2000 msec; echo time, 80 msec; three diffusion directions; and parallel imaging factor of two. For the first volunteer, 27 b values between 0 and 1300 sec/mm2, in steps of 50 sec/mm2, were applied. To achieve high signal-to-noise ratio for subsequent simulation studies we took nine signal averages for each b value for each diffusion-encoding direction, each during shallow breathing. A preliminary study for this case showed that signals of high b values had low signal-to-noise ratio, so for the other two volunteers, only the 16 b values up to 750 sec/mm2 were used for acquisition. The total duration of 16–b value DW imaging with nine repetitions was 14 minutes. DW images were coregistered by using the normalized cross-correlation method to correct for any respiratory motion (33). The nine repetitions of the registered images were averaged prior to analysis. Coronal T2-weighted half-Fourier acquisition single-shot turbo spin-echo images and T1-weighted fast low-angle shot images, which showed good corticomedullary differentiation, were acquired in each subject to assist in the manual segmentation of the diffusion images.
On the images in each volunteer, ROIs were delineated manually with the assistance of an experienced radiologist (P.H.V., 6 years of experience) on the b = 0 sec/mm2 images to measure signal intensity of renal cortex across 3 volunteers (mean number of ROIs, 19 ± 6 [standard deviation]; volume, 50.0 mL ± 27.7) and medulla (mean number of ROIs, 33 ± 11; volume, 13.5 mL ± 4.5) for each volunteer. In one volunteer, an incidental benign cyst (2.9 mL) was also analyzed. An ROI for the entire renal parenchyma (19.1 mL ± 4.3) was drawn in one central section for each volunteer. The averaged signal intensity versus b value curves, or diffusion decay curves, were obtained for each of these tissues, and were then fitted to a biexponential model, as has been described by other investigators in renal tissue (2,26):
where S is the averaged signal intensity from ROIs, S0 is the signal acquired without diffusion weighting, and the three model parameters are fast-component fraction (FP), tissue diffusion coefficient (Dt), and pseudo-diffusion coefficient (Dp) due to perfusion and other flow effects. The fitting was performed over the range 0 ≤ b ≤ 750 sec/mm2 to ensure sufficient signal-to-noise ratio (minimum value of 4 on all b values, with noise defined by the standard deviation of background signals). Goodness of fit was evaluated by a root mean square residual (σRMS), expressed as a percentage of S0. A low relative σRMS on the order of the random image noise indicates that the model curve represents the data well. For comparison, the same data were also fitted by the conventional monoexponential model,
to estimate a single diffusion coefficient, ADC.
For the simulation, the parameter estimates from the biexponential fitting of each type of tissue (cortex, medulla, or whole parenchyma) were averaged across the three volunteers, and the averaged values, which we assume were representative of that tissue, were then substituted back into Equation (1) to generate an ideal diffusion decay curve (continuous and noise-free).
To simulate the effects of different b values on the ADC estimates, the ideal curves were resampled at a number of different sets of b values that have been used in published studies (1,2,7,8,10–25) of healthy subjects (Table 1). For our simulation, the data points resampled at each set of b values were then fitted by the single exponential function in Equation (2), resulting in the “predicted” ADC values. For example, from the volunteer data, one resampling was performed by using b = 0, 500, and 1000 sec/mm2. From these three data points, a single exponential fit resulted in a predicted ADC. Another resampling was performed by using b = 0 and 500 sec/mm2. A single exponential fit from these two data points resulted in a different predicted ADC. The variability of these predicted ADC values would solely depend on the degree of insufficiency of the monoexponential function for characterizing the simulated diffusion decay curves.
By using the specific b values reported in the studies cited in Table 1, we compared the predicted ADC values on the basis of those b values with the ADC values reported in that study. This process was performed separately for each study. Comparisons were made where possible for renal cortex, medulla, and whole parenchyma, using different correlation plots for each group.
For a visual depiction of the relationship between b values selected and the resulted ADC estimates, ADC maps were generated by fitting the monoexponential model to the image data of the first volunteer at three different sets of b values: (a) 0 and 400 sec/mm2; (b) 0 and 800 sec/mm2; and (c) 17 b values from 0 to 800 sec/mm2, with an interval of 50 sec/mm2. A Dt map was also generated by fitting biexponential model to the voxel signals at the b values in set (c) whose monoexponential fit residuals exceeded the standard deviation of background noise, and using a monoexponential fit for the remaining voxels.
Statistical Analysis
Using different sets of b values, the studies in the literature reported different ADC values. Correlation coefficient (R) between the averaged b values used in the studies and the reported ADC values was calculated. In our simulation, the correlation coefficient (or coefficient of determination, R2) between predicted and reported ADC was calculated to quantify the fraction of the variability in the reported ADC values that was due to the variability in the predicted ADC or the insufficiency of the monoexponential model. The correlations were statistically significant if the associated P value was less than .05. All calculation was performed with Matlab (MathWorks, Natick, Mass).
Results
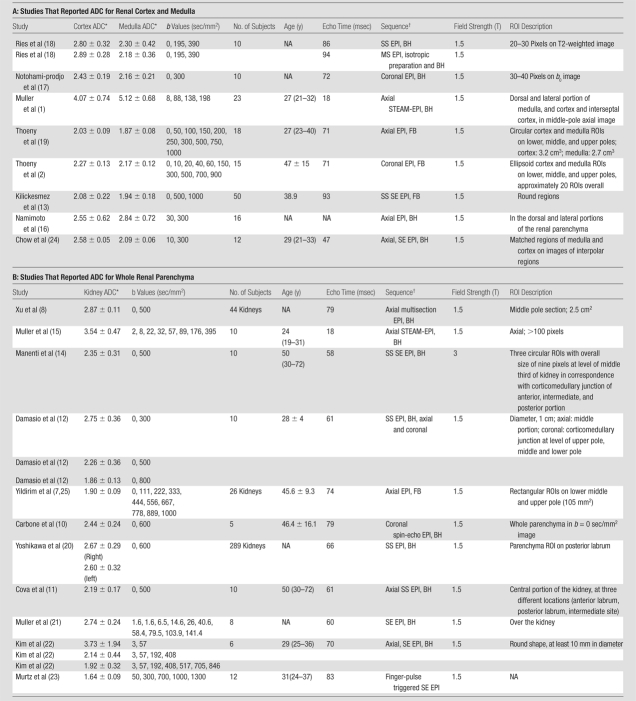
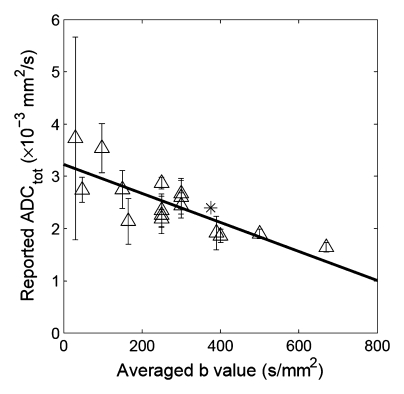
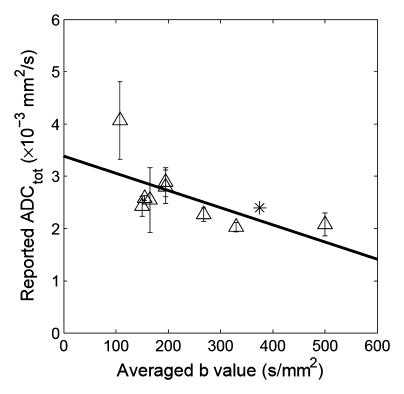
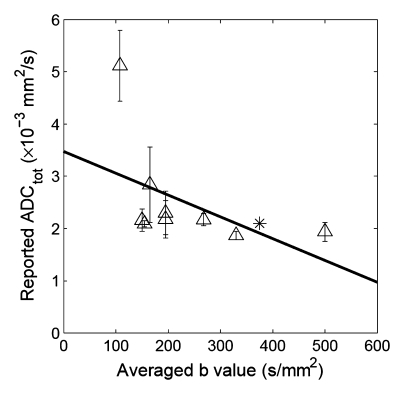
We found 19 studies in the literature that reported ADC for healthy kidneys (Table 1). Among these 19 studies there were nine with reported measurements of ADC for renal cortex and medulla and 10 with reported measurements for the entire renal parenchyma (without separating cortex and medulla). In these studies, the reported ADC values for renal cortex, medulla, and whole parenchyma varied within large ranges. The b value sets used in these studies varied widely: maximal b values used in these studies ranged from 57 to 1300 sec/mm2, and the averaged b (ie, the average of all b values used in the study) values ranged from 30 to 670 sec/mm2; the number of b values varied from two to 10. Figure 1 shows the correlation plots between the averaged b values used and the resulted ADC for the various renal tissues in these previous studies. It is noted that the higher the average b value in the acquisitions, the lower the estimated ADC values. This correlation, independent of any standard response curve, is an indication of the insufficiency of the monoexponential model as a source of potential systematic error. It is also observed that the reported ADC values measured with low b values showed high standard deviation (or variation).
Figure 1a:
Correlation between reported ADC (ADCtot) values from published literature (Table 1) and averaged b values used for exponential fitting in each publication. (a) Renal parenchyma: R = 0.79, P = .0002; (b) renal cortex: R = 0.65, P = .0575; and (c) renal medulla: R = 0.50, P = .171. ∗ = ADC estimate from simulated diffusion decay curves sampled at b from 0 to 750 sec/mm2 with intervals of 50 sec/mm2. The range of b values sampled from published DW imaging studies in healthy volunteers varied considerably. The higher the averaged b value, the lower the estimated ADC values, suggesting an intrinsic limitation of the monoexponential model to derive ADC.
Figure 1b:
Correlation between reported ADC (ADCtot) values from published literature (Table 1) and averaged b values used for exponential fitting in each publication. (a) Renal parenchyma: R = 0.79, P = .0002; (b) renal cortex: R = 0.65, P = .0575; and (c) renal medulla: R = 0.50, P = .171. ∗ = ADC estimate from simulated diffusion decay curves sampled at b from 0 to 750 sec/mm2 with intervals of 50 sec/mm2. The range of b values sampled from published DW imaging studies in healthy volunteers varied considerably. The higher the averaged b value, the lower the estimated ADC values, suggesting an intrinsic limitation of the monoexponential model to derive ADC.
Figure 1c:
Correlation between reported ADC (ADCtot) values from published literature (Table 1) and averaged b values used for exponential fitting in each publication. (a) Renal parenchyma: R = 0.79, P = .0002; (b) renal cortex: R = 0.65, P = .0575; and (c) renal medulla: R = 0.50, P = .171. ∗ = ADC estimate from simulated diffusion decay curves sampled at b from 0 to 750 sec/mm2 with intervals of 50 sec/mm2. The range of b values sampled from published DW imaging studies in healthy volunteers varied considerably. The higher the averaged b value, the lower the estimated ADC values, suggesting an intrinsic limitation of the monoexponential model to derive ADC.
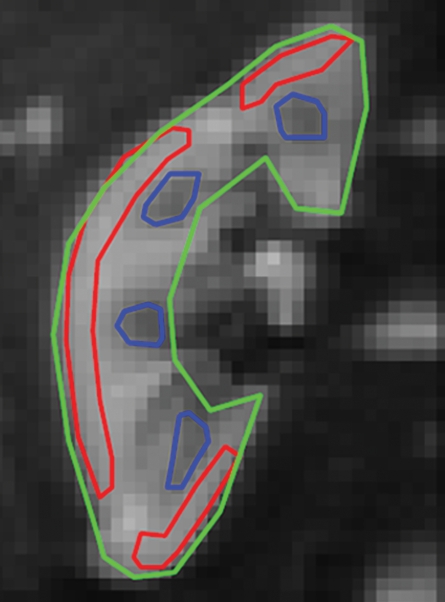
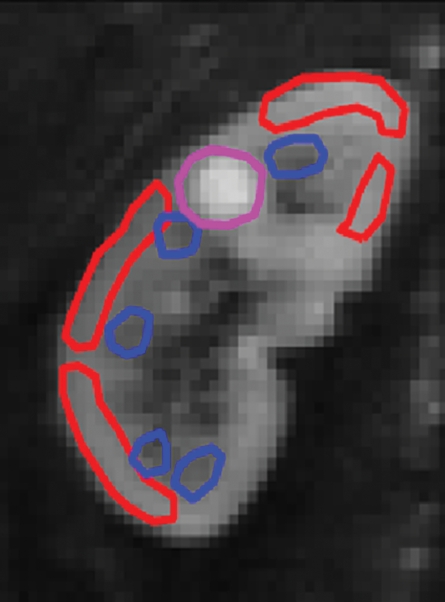
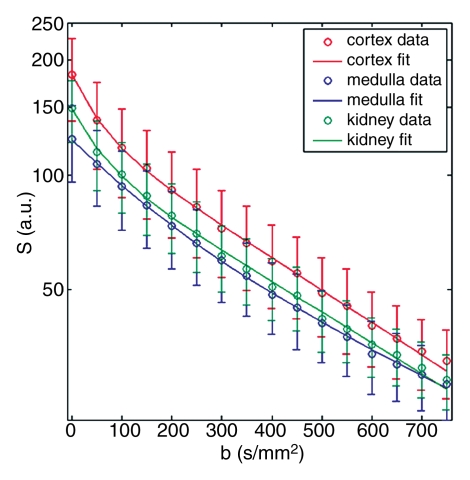
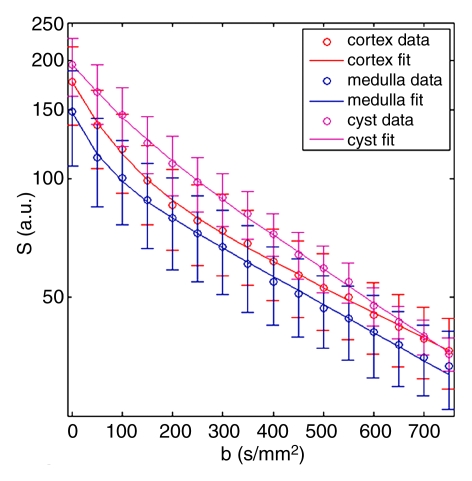
Representative ROIs from two volunteers used for the calculations are shown in figure 2a and 2c. The diffusion decay curves from these two volunteers and their biexponential fits are given in figure 2b and 2d. The error bars for the diffusion decay curves reflect intra-ROI heterogeneity due to factors such as physiology and radiofrequency shading and do not represent the level of random noise. For all the volunteer data, the signals from different tissues (renal cortex, medulla, whole parenchyma, and cyst) were fitted well with a biexponential function, with relative σRMS of 0.6%–1.2%, as compared with higher values of 2.1%–5.6% from the monoexponential model. Parameter estimates derived from both fitting processes are listed in Table 2. For each type of renal tissue, ADC from monoexponential fitting was higher than the Dt from biexponential fitting by about 30%. Biexponential fitting showed that in normal renal parenchyma, FP was on the order of 0.3, while for a renal cyst, FP was 0.22.
Figure 2a:
Examples of ROI selection and biexponential fitting. Green = whole parenchyma, red = cortex, and blue = medulla. (a) ROIs selected in one section (averaged over nine repeats) of b = 0 sec/mm2 image. (b) The diffusion decay signals (S) in the volunteer in a, who was measured with 16 b values from 0 to 750 sec/mm2, and the biexponential fits are shown. Error bars = total intra-ROI heterogeneity due to physiology and radiofrequency shading, among others. (c) ROIs in one section in another volunteer who had a right upper pole cyst (magenta). The generated signals (S) and fits are shown in d. For this volunteer, the whole-kidney ROI was drawn in the other kidney without cyst, and the whole-kidney signal is not shown in d. All curves were well fitted using the biexponential equation (Eq [1]).
Figure 2c:
Examples of ROI selection and biexponential fitting. Green = whole parenchyma, red = cortex, and blue = medulla. (a) ROIs selected in one section (averaged over nine repeats) of b = 0 sec/mm2 image. (b) The diffusion decay signals (S) in the volunteer in a, who was measured with 16 b values from 0 to 750 sec/mm2, and the biexponential fits are shown. Error bars = total intra-ROI heterogeneity due to physiology and radiofrequency shading, among others. (c) ROIs in one section in another volunteer who had a right upper pole cyst (magenta). The generated signals (S) and fits are shown in d. For this volunteer, the whole-kidney ROI was drawn in the other kidney without cyst, and the whole-kidney signal is not shown in d. All curves were well fitted using the biexponential equation (Eq [1]).
Figure 2b:
Examples of ROI selection and biexponential fitting. Green = whole parenchyma, red = cortex, and blue = medulla. (a) ROIs selected in one section (averaged over nine repeats) of b = 0 sec/mm2 image. (b) The diffusion decay signals (S) in the volunteer in a, who was measured with 16 b values from 0 to 750 sec/mm2, and the biexponential fits are shown. Error bars = total intra-ROI heterogeneity due to physiology and radiofrequency shading, among others. (c) ROIs in one section in another volunteer who had a right upper pole cyst (magenta). The generated signals (S) and fits are shown in d. For this volunteer, the whole-kidney ROI was drawn in the other kidney without cyst, and the whole-kidney signal is not shown in d. All curves were well fitted using the biexponential equation (Eq [1]).
Figure 2d:
Examples of ROI selection and biexponential fitting. Green = whole parenchyma, red = cortex, and blue = medulla. (a) ROIs selected in one section (averaged over nine repeats) of b = 0 sec/mm2 image. (b) The diffusion decay signals (S) in the volunteer in a, who was measured with 16 b values from 0 to 750 sec/mm2, and the biexponential fits are shown. Error bars = total intra-ROI heterogeneity due to physiology and radiofrequency shading, among others. (c) ROIs in one section in another volunteer who had a right upper pole cyst (magenta). The generated signals (S) and fits are shown in d. For this volunteer, the whole-kidney ROI was drawn in the other kidney without cyst, and the whole-kidney signal is not shown in d. All curves were well fitted using the biexponential equation (Eq [1]).
Table 2.
Estimates of Diffusion Parameters for Healthy Kidneys

Note.—Data are average of parameter estimates ± fitting error across three volunteers. Parameter σRMS is expressed as a percentage of S0. Numbers in parentheses are intersubject standard deviation for the estimates. Cyst was found in only one volunteer.
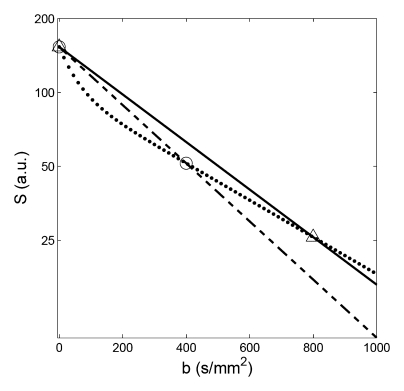
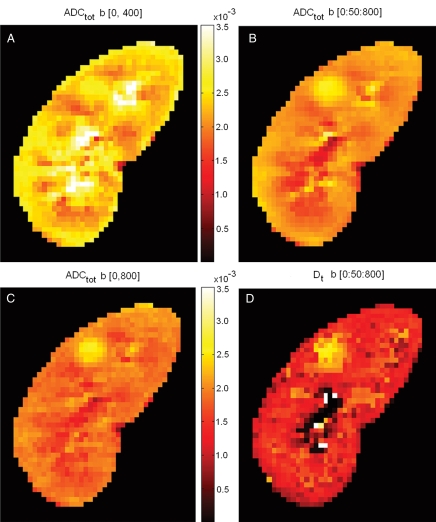
To examine the effect of use of a monoexponential model with varying b values on the resultant ADC values, ADC measurements for renal tissues were simulated by resampling the ideal diffusion decay curves at the different combinations of b values used in the previously published studies (Table 1). Figure 3 shows examples of resampling the simulated whole-parenchyma diffusion decay curve at two sets of b values (at 0 and 400 sec/mm2 and at 0 and 800 sec/mm2), whose exponential fitting resulted in predicted ADC of 2.7 × 10⁻³ and 2.2 × 10⁻³ mm2/sec, respectively. The results of these simulated ADC values based on three different sets of b values are shown in Figure 4, together with a Dt map from biexponential fitting for comparison. ADC values obtained at b = 0 and 400 sec/mm2 were markedly higher than those at 0 and 800 sec/mm2, and higher corticomedullary contrast is seen for the lower b value case. These ADC values all exceeded those produced with a biexponential model for Dt, which was generated using a biexponential fit, where flow component is separated from the diffusion component of the ADC estimation. Dt showed clear contrast between the renal parenchyma and the benign cyst, the latter showing a high value due to unrestricted fluid diffusion. However, there was little difference between Dt for renal cortex and medulla. On the other hand, there was a clear corticomedullary contrast for ADC maps shown in figure 4 (A-C).
Figure 3:
Examples of resampling and then monoexponential fitting in simulation. Resamplings were performed from the whole-parenchyma diffusion decay curve (dotted line) at b values of 0 and 400 sec/mm2 (circles, dashed line: monoexponential fit, resulting ADC = 2.7 × 10⁻³ mm2/sec), and at 0 and 800 sec/mm2 (triangles, solid line: monoexponential fit, resulting ADC = 2.2 × 10⁻³ mm2/sec).
Figure 4:
Comparison of ADC (ADCtot) computed using different sets of b values and of Dt derived from a biexponential fit. A, ADC values obtained with b = 0 and 400 sec/mm2 were markedly higher than when computed from, C, b = 0 and 800 sec/mm2. B, By using 17 b values between 0 and 800 sec/mm2 with interval of 50 sec/mm2, the obtained ADC values fell between those in A and C. It is seen that ADC values depend heavily on the sets of b values being used. D, Image shows Dt determined by using a biexponential model (Eq [1]) that separates out the IVIM contribution to diffusion. ADC values calculated using a monoexponential model (A–C) were all considerably higher than Dt. High Dt values in upper pole cyst are likely due to unrestricted diffusion.
For all the tested combinations of b values (Table 1), the predicted ADC values varied from 2.1 × 10⁻³ to 5.6 × 10⁻³ mm2/sec for whole parenchyma, from 2.4 × 10⁻³ to 3.5 × 10⁻³ mm2/sec for renal cortex, and from 2.2 × 10⁻³ to 3.3 × 10⁻³ mm2/sec for medulla.
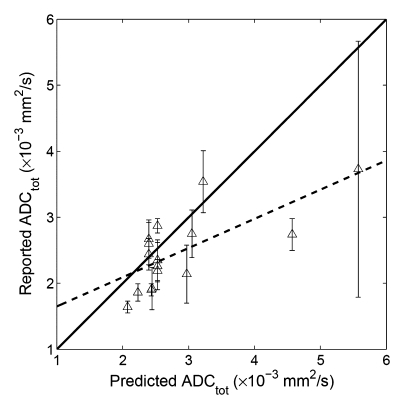
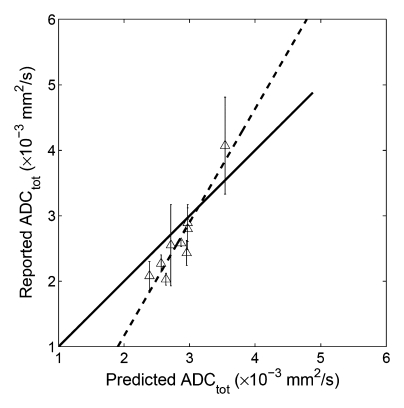
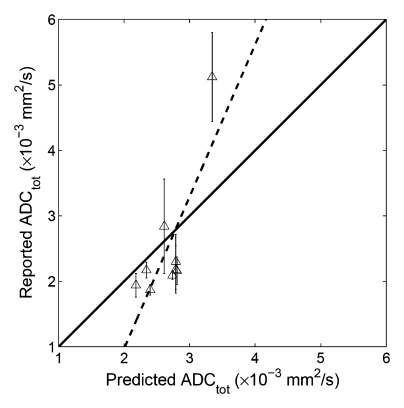
When our simulated ADC values were compared with the original published results (Table 1), significant correlation was found between the predicted and the reported values for whole parenchyma (R2 = 0.50, P = .002, y = 0.44x + 1.21), cortex (R2 = 0.87, P = .0002, y = 1.73x − 2.30), and medulla (R2 = 0.61, P = .0129, y =0.60x + 0.83) (Fig 5). These results indicated that at least 50% of the variability of the whole parenchymal ADC values (and 87% of the cortical and 61% of the medullary ADC) can be attributable to the errors arising from using a monoexponential fit to DW imaging measurements of ADC.
Figure 5a:
Correlation plots between predicted ADC (ADCtot) and reported values. (a) Whole parenchyma: y = 0.44x + 1.21, R2 = 0.50, P = .002; (b) renal cortex: y = 1.73x−2.30, R2 = 0.87, P = .0002; (c) renal medulla: y = 2.32x−3.68, R2 = 0.61, P = .0129. Solid line = line of identity, dashed line = line of regression. The majority of the variability in published values of ADC can be attributed to the application of a monoexponential fit to limited b value data.
Figure 5b:
Correlation plots between predicted ADC (ADCtot) and reported values. (a) Whole parenchyma: y = 0.44x + 1.21, R2 = 0.50, P = .002; (b) renal cortex: y = 1.73x−2.30, R2 = 0.87, P = .0002; (c) renal medulla: y = 2.32x−3.68, R2 = 0.61, P = .0129. Solid line = line of identity, dashed line = line of regression. The majority of the variability in published values of ADC can be attributed to the application of a monoexponential fit to limited b value data.
Figure 5c:
Correlation plots between predicted ADC (ADCtot) and reported values. (a) Whole parenchyma: y = 0.44x + 1.21, R2 = 0.50, P = .002; (b) renal cortex: y = 1.73x−2.30, R2 = 0.87, P = .0002; (c) renal medulla: y = 2.32x−3.68, R2 = 0.61, P = .0129. Solid line = line of identity, dashed line = line of regression. The majority of the variability in published values of ADC can be attributed to the application of a monoexponential fit to limited b value data.
Discussion
In this study, DW imaging volunteer data of multiple b values and signal averages were acquired to generate reference diffusion decay curves of healthy kidneys. A simulation was performed by resampling these reference curves at the various b value sets used in published studies and then fitting the resampled data with monoexponential model to get ADC values. We found that monoexponential fitting of diffusion decay data from healthy renal tissue resulted in as much as a twofold difference in whole-kidney ADC values (2.1 × 10⁻³ to 5.6 × 10⁻³ mm2/sec). Monoexponential fitting error was significantly higher than that of biexponential fittings, indicating that the monoexponential model is insufficient for these tissues. High correlation coefficients were found between these predicted ADC values and the published ones. In general, the variability among reported values of ADC in the literature can be partially attributed to the difference in multiple factors among these studies, such as patient population (13), hydration status (19), imaging sequence and/or parameters (11,12,18), breath hold versus free breathing, and field strength. However, our simulation results indicated that among all the possible factors, the use of single exponential function for analysis and variability sampled diffusion weighting played a substantial role in causing the resultant variability in ADC of healthy kidneys.
Our study suggests that, if one wants to compare any longitudinal or intercenter ADC results, one must appreciate the limitations of monoexponential function for fitting renal DW imaging data. In future studies of renal DW imaging, we suggest a few solutions to avoid the variability induced by the use of monoexponential model. First, a consistent set of b values should be used for monoexponential fitting, so that the multiple physiologic processes (eg, pure diffusion of water molecules, perfusion, or tubular flow in kidney) will affect the estimation of ADC in a consistent way. For example, using the same set of b values, Braithwaite et al (34) repeated ADC measurements for abdominal organs of healthy volunteers on two separate days (approximately 5 months apart) and found that ADC thus obtained was highly reproducible. Alternatively, and preferably, a biexponential model based on multiple b value measurements might be used to separate water diffusion and active flow effects from the DW imaging data. This latter solution would not only produce more consistent estimates for ADC (Dt of 1.5 × 10⁻³ to 1.8 × 10⁻³ mm2/sec in our study) but would also give estimates for parameters FP and Dp, which are believed to reflect vascular perfusion and tubular flow in kidney (2). For the purpose of reliable biexponential fitting, we acquired DW images at 16 b values and with nine repetitions to get high-quality DW imaging data, but we recognize that this acquisition protocol is not practical for clinical use. However, a preliminary study (35) suggests that it is feasible to acquire multi–b value data to fit FP, Dp, and Dt by using a breath-hold DW imaging sequence. We are currently further optimizing the sampling and analysis for IVIM in kidney.
This study had the limitation that only the results from three volunteers were used for the simulations, and these may not be completely representative of all cases of healthy kidneys. For example, in one volunteer, findings showed minimal corticomedullary differentiation in the parameter Dt, while the group average Dt showed some corticomedullary contrast. Such inconsistency might be due to the difference in the volunteers’ ages, hydration status, or other factors that contribute to the intersubject variation (10% for Dt, as compared with 5% fitting precision). We may speculate based on this finding alone that the commonly observed ADC corticomedullary differentiation is at least in part due to perfusion effects; higher subject statistics would be helpful to resolve the issue in the future. Second, based on this preliminary study, we are not yet able to separately determine the contributions of vascular, tubular, or other active flow processes to the fast component in diffusion decay. Finally, our study was conducted at 3 T, while most studies in the literature on kidney DW imaging to date have been performed at 1.5 T. We find good consistency between our results and the reported lower field strength data (see Fig 1); this is consistent with our expectation that biologic diffusion processes have little or no intrinsic field dependence.
In conclusion, substantial variability among reported values of ADC in healthy subjects in the literature is due in large part to the application of a monoexponential model to data that are better fitted biexponentially. When only limited b values can be sampled, studies that use ADC measurements fitted monoexponentially should use the same diffusion weighting values (same b values) to ensure comparability across clinical populations and to avoid systematic error. A consensus is needed as to what these values should be. Alternatively, development of DW imaging with multiple b values may permit accurate biexponential fits that provide both diffusion and IVIM measurements.
Advance in Knowledge.
At least 50% of the variability of the renal parenchymal apparent diffusion coefficient (ADC) values (and 87% of cortical and 61% of medullary ADC values) can be attributable to the errors arising from using a monoexponential fit to diffusion-weighted MR imaging measurements of ADC.
Acknowledgments
We thank Pippa Storey, PhD, and Hua Guo, PhD, for helpful discussion.
Received May 21, 2009; revision requested July 20; revision received August 19; final version accepted September 28.
Authors stated no financial relationship to disclose.
Abbreviations:
- ADC
- apparent diffusion coefficient
- Dp
- pseudo-diffusion coefficient
- Dt
- tissue diffusion coefficient
- DW
- diffusion weighted
- Fp
- fast-component fraction
- IVIM
- intravoxel incoherent motion
- σRMS
- root mean square residual
- ROI
- region of interest
References
- 1.Muller MF, Prasad PV, Bimmler D, Kaiser A, Edelman RR. Functional imaging of the kidney by means of measurement of the apparent diffusion coefficient. Radiology 1994;193:711–715 [DOI] [PubMed] [Google Scholar]
- 2.Thoeny HC, Zumstein D, Simon-Zoula S, et al. Functional evaluation of transplanted kidneys with diffusion-weighted and BOLD MR imaging: initial experience. Radiology 2006;241:812–821 [DOI] [PubMed] [Google Scholar]
- 3.Prasad PV. Functional MRI of the kidney: tools for translational studies of pathophysiology of renal disease. Am J Physiol Renal Physiol 2006;290:F958–F974 [DOI] [PMC free article] [PubMed] [Google Scholar]
- 4.Koh DM, Collins DJ. Diffusion-weighted MRI in the body: applications and challenges in oncology. AJR Am J Roentgenol 2007;188:1622–1635 [DOI] [PubMed] [Google Scholar]
- 5.Taouli B, Tolia AJ, Losada M, et al. Diffusion-weighted MRI for quantification of liver fibrosis: preliminary experience. AJR Am J Roentgenol 2007;189:799–806 [DOI] [PubMed] [Google Scholar]
- 6.Luciani A, Vignaud A, Cavet M, et al. Liver cirrhosis: intravoxel incoherent motion MR imaging–pilot study. Radiology 2008;249:891–899 [DOI] [PubMed] [Google Scholar]
- 7.Yildirim E, Kirbas I, Teksam M, Karadeli E, Gullu H, Ozer I. Diffusion-weighted MR imaging of kidneys in renal artery stenosis. Eur J Radiol 2008;65:148–153 [DOI] [PubMed] [Google Scholar]
- 8.Xu Y, Wang X, Jiang X. Relationship between the renal apparent diffusion coefficient and glomerular filtration rate: preliminary experience. J Magn Reson Imaging 2007;26:678–681 [DOI] [PubMed] [Google Scholar]
- 9.Taouli B, Thakur RK, Mannelli L, et al. Renal lesions: characterization with diffusion-weighted imaging versus contrast-enhanced MR imaging. Radiology 2009;251:398–407 [DOI] [PubMed] [Google Scholar]
- 10.Carbone SF, Gaggioli E, Ricci V, Mazzei F, Mazzei MA, Volterrani L. Diffusion-weighted magnetic resonance imaging in the evaluation of renal function: a preliminary study. Radiol Med 2007;112:1201–1210 [DOI] [PubMed] [Google Scholar]
- 11.Cova M, Squillaci E, Stacul F, et al. Diffusion-weighted MRI in the evaluation of renal lesions: preliminary results. Br J Radiol 2004;77:851–857 [DOI] [PubMed] [Google Scholar]
- 12.Damasio MB, Tagliafico A, Capaccio E, et al. Diffusion-weighted MRI sequences (DW-MRI) of the kidney: normal findings, influence of hydration state and repeatability of results. Radiol Med 2008;113:214–224 [DOI] [PubMed] [Google Scholar]
- 13.Kilickesmez O, Yirik G, Bayramoglu S, Cimilli T, Aydin S. Non-breath-hold high b-value diffusion-weighted MRI with parallel imaging technique: apparent diffusion coefficient determination in normal abdominal organs. Diagn Interv Radiol 2008;14:83–87 [PubMed] [Google Scholar]
- 14.Manenti G, Di Roma M, Mancino S, et al. Malignant renal neoplasms: correlation between ADC values and cellularity in diffusion weighted magnetic resonance imaging at 3 T. Radiol Med 2008;113:199–213 [DOI] [PubMed] [Google Scholar]
- 15.Muller MF, Prasad P, Siewert B, Nissenbaum MA, Raptopoulos V, Edelman RR. Abdominal diffusion mapping with use of a whole-body echo-planar system. Radiology 1994;190:475–478 [DOI] [PubMed] [Google Scholar]
- 16.Namimoto T, Yamashita Y, Mitsuzaki K, Nakayama Y, Tang Y, Takahashi M. Measurement of the apparent diffusion coefficient in diffuse renal disease by diffusion-weighted echo-planar MR imaging. J Magn Reson Imaging 1999;9:832–837 [DOI] [PubMed] [Google Scholar]
- 17.Notohamiprodjo M, Glaser C, Herrmann KA, et al. Diffusion tensor imaging of the kidney with parallel imaging: initial clinical experience. Invest Radiol 2008;43:677–685 [DOI] [PubMed] [Google Scholar]
- 18.Ries M, Jones RA, Basseau F, Moonen CT, Grenier N. Diffusion tensor MRI of the human kidney. J Magn Reson Imaging 2001;14:42–49 [DOI] [PubMed] [Google Scholar]
- 19.Thoeny HC, De Keyzer F, Oyen RH, Peeters RR. Diffusion-weighted MR imaging of kidneys in healthy volunteers and patients with parenchymal diseases: initial experience. Radiology 2005;235:911–91715845792 [Google Scholar]
- 20.Yoshikawa T, Kawamitsu H, Mitchell DG, et al. ADC measurement of abdominal organs and lesions using parallel imaging technique. AJR Am J Roentgenol 2006;187:1521–1530 [DOI] [PubMed] [Google Scholar]
- 21.Muller MF, Prasad PV, Edelman RR. Can the IVIM model be used for renal perfusion imaging?. Eur J Radiol 1998;26:297–303 [DOI] [PubMed] [Google Scholar]
- 22.Kim T, Murakami T, Takahashi S, Hori M, Tsuda K, Nakamura H. Diffusion-weighted single-shot echoplanar MR imaging for liver disease. AJR Am J Roentgenol 1999;173:393–398 [DOI] [PubMed] [Google Scholar]
- 23.Murtz P, Flacke S, Traber F, van den Brink JS, Gieseke J, Schild HH. Abdomen: diffusion-weighted MR imaging with pulse-triggered single-shot sequences. Radiology 2002;224:258–264 [DOI] [PubMed] [Google Scholar]
- 24.Chow LC, Bammer R, Moseley ME, Sommer FG. Single breath-hold diffusion-weighted imaging of the abdomen. J Magn Reson Imaging 2003;18:377–382 [DOI] [PubMed] [Google Scholar]
- 25.Yildirim E, Gullu H, Caliskan M, Karadeli E, Kirbas I, Muderrisoglu H. The effect of hypertension on the apparent diffusion coefficient values of kidneys. Diagn Interv Radiol 2008;14:9–13 [PubMed] [Google Scholar]
- 26.Le Bihan D, Breton E, Lallemand D, Aubin ML, Vignaud J, Laval-Jeantet M. Separation of diffusion and perfusion in intravoxel incoherent motion MR imaging. Radiology 1988;168:497–505 [DOI] [PubMed] [Google Scholar]
- 27.Le Bihan D, Turner R. The capillary network: a link between IVIM and classical perfusion. Magn Reson Med 1992;27:171–178 [DOI] [PubMed] [Google Scholar]
- 28.Wang J, Fernández-Seara MA, Wang S, St Lawrence KS. When perfusion meets diffusion: in vivo measurement of water permeability in human brain. J Cereb Blood Flow Metab 2007;27:839–849 [DOI] [PubMed] [Google Scholar]
- 29.Neil JJ, Bosch CS, Ackerman JJH. An evaluation of the sensitivity of the intravoxel incoherent motion (IVIM) method of blood flow measurement to changes in cerebral blood flow. Magn Reson Med 1994;32:60–65 [DOI] [PubMed] [Google Scholar]
- 30.Duong TQ, Kim SG. In vivo MR measurements of regional arterial and venous blood volume fractions in intact rat brain. Magn Reson Med 2000;43:393–402 [DOI] [PubMed] [Google Scholar]
- 31.Wang Z, Su MY, Nalcioglu O. Measurement of tumor vascular volume and mean microvascular random flow velocity magnitude by dynamic Gd-DTPA-albumin enhanced and diffusion-weighted MRI. Magn Reson Med 1998;40:397–404 [DOI] [PubMed] [Google Scholar]
- 32.Krier JD, Ritman EL, Bajzer Z, Romero JC, Lerman A, Lerman LO. Noninvasive measurement of concurrent single-kidney perfusion, glomerular filtration, and tubular function. Am J Physiol Renal Physiol 2001;281:F630–F638 [DOI] [PubMed] [Google Scholar]
- 33.Takao M, Sugano N, Nishii T, et al. Application of 3D-MR image registration to monitor diseases around the knee joint. J Magn Reson Imaging 2005;22:656–660 [DOI] [PubMed] [Google Scholar]
- 34.Braithwaite AC, Dale BM, Boll DT, Merkle EM. Short- and midterm reproducibility of apparent diffusion coefficient measurements at 3.0-T diffusion-weighted imaging of the abdomen. Radiology 2009;250:459–465 [DOI] [PubMed] [Google Scholar]
- 35.Chandarana H, Lee VS, Hecht E, Taouli B, Babb J, Sigmund EE. Assessment of renal mass perfusion using Intravoxel Incoherent Motion (IVIM) diffusion weighted imaging: preliminary experience. Presented at the 32nd annual meeting of the Society of Computed Body Tomography and Magnetic Resonance, Miami, Fla, March 1–6, 2009 [Google Scholar]


