

Abstract
The alkaline-induced structural transitions of ferricytochrome c have been studied intensively as a model for how changes in metal ligation contribute to protein function and folding. Previous studies have demonstrated that multiple non-native species accumulate with increasing pH. Here, we used a combination of experiments and simulations to provide a high-resolution view of the changes associated with increasing alkaline conditions. Alkaline-induced transitions were characterized under equilibrium conditions by following changes in the IR absorptions of carbon–deuterium chromophores incorporated at Leu68, Lys72, Lys73, Lys79, and Met80. The data suggest that at least four intermediates are formed as the pH is increased prior to complete unfolding of the protein. The first alkaline transition observed appears to be driven by a single deprotonation and occurs with a midpoint of pH 8.8, but surprisingly, the intermediate formed does not appear to be one of the well-characterized lysine misligates. At higher pH, second and third deprotonations, with a combined apparent midpoint pH of 10.2, induce transitions to Lys73- or Lys79-misligated species. Interestingly, the lysine misligates appear to undergo iron reduction by the coordinated amine. A transition from the lysine misligates to another intermediate, likely a hydroxide-misligated species, is associated with a fourth deprotonation and a midpoint of pH 10.7. Finally, the protein loses tertiary structure with a fifth deprotonation that occurs with a midpoint of pH 12.7. Native topology-based models with enforced misligation are employed to help understand the structures of the observed intermediates.
The energy landscape underlying the folding and function of ferricytochrome c (cyt c)1 is dominated by the covalently attached heme cofactor and its coordination chemistry (2, 3). In fact, misligation of the heme center with different protein ligands was one of the first examples of frustration on an energy landscape (4). Ligation and misligation of cyt c have been intensively studied since 1941, when Theorell and Åkesson first reported that the oxidized protein populates at least five distinct states between pH 1 and pH 13, denoted I to V (5). State III is the native form of the protein with Met80 bound to the heme center, and it dominates under neutral conditions. At higher pH, multiple misligated species accumulate, including a lysine-misligated state IV and a hydroxide-misligated state V,2 before the protein eventually unfolds (3, 6, 7). The transitions between the various states have served as models of how metal ligation and misligation contribute to protein structure and function. In particular, the lowest pH alkaline transition, whereby the native state III disappears, has been of great interest as a model for how cyt c may be regulated for biological function (3, 8). For clarity, we refer to the transition that quenches state III as the alkaline transition and all of the changes induced with increasing pH, including the alkaline transition, as alkaline-induced transitions.
The alkaline transition has traditionally been studied using an absorption band at 695 nm, which is known to be associated with the Met80–iron bond in the native protein (9-11). Under equilibrium conditions, these studies have shown that the 695 nm absorption is quenched with an apparent pKa between 8.5 and 9.4, depending on the particular species of cyt c. At higher pH, misligated intermediates have been detected via optical (12, 13), resonance Raman (7), FT IR (14, 15), 2D IR (16), NMR (13, 17-19), EPR (13, 18, 20), and single molecule fluorescence spectroscopy (21). Work with horse heart (17, 22) and yeast iso-1 (13, 18) cyt c shows that the extensively studied lysine-misligated state IV is not a single species but rather a mixture of two lysine-misligated forms, denoted as IVa and IVb. Studies with the yeast protein involving mutation of individual lysine residues (for example to alanine) have convincingly demonstrated that the specific lysines involved in misligation are Lys73 and Lys79 (13, 17-19, 22). Misligation by Lys72 in the yeast protein is precluded by trimethylation; however, when the protein is prepared in Escherichia coli, where trimethylation does not occur, Lys72 was also suggested to contribute to misligation, perhaps even forming the most stable misligate (23). In contrast, recent mutational studies of the horse heart protein suggest that Lys79 forms the most stable misligate, followed by Lys73, and that Lys72 does not contribute to misligation despite its unmodified side chain (22). Thus, while it is generally accepted that lysine misligates form under alkaline conditions, the stability and details of the misligates still remain to be unambiguously determined.
It is generally assumed that the lysine misligates are the first species formed as the pH is increased from neutrality. However, quenching of the 695 nm absorption band in the fully aminated and fully maleylated proteins, neither of which have lysines available for heme coordination, shows a midpoint that is virtually identical to the wild-type protein (24). Quenching of the 695 nm absorption of fully lysine guanidinated cyt c is also virtually identical to the wild-type protein, although in this case the heme in the quenched state appears to be in a thermal equilibrium between low-spin and high-spin states (25), whereas the alkaline transition in the wild-type protein preserves the low-spin state. In addition, careful analysis of the 695 nm absorption as a function of pH suggests that the dissociation of Met80 and the deprotonation involved in the appearance of IV are unique events (9). These results suggest that lysine misligation may not be required for the alkaline transition and that another intermediate may accumulate prior to the lysine misligates. Interestingly, such an intermediate is observed when the alkaline-induced transitions are time-resolved (26, 27); however, no such intermediate has been observed under equilibrium conditions, suggesting either that it does not accumulate or that the experimental techniques employed lack sufficient structural resolution and/or sensitivity for its detection.
Here we report the characterization of pH-induced changes in horse heart cyt c using a technique based on the site-selective incorporation of carbon–deuterium (C–D) bonds throughout the protein that are monitored under equilibrium conditions using IR spectroscopy (28-32). Introducing C–D bonds is nonperturbative and provides stretching absorptions that are well resolved from other protein absorptions and that are sensitive to their local environment. Importantly, in addition to its inherently high structural resolution, the technique has the high time resolution inherent to IR spectroscopy so that folding intermediates can be detected even if they interconvert on an extremely fast (i.e., picosecond) time scale. The technique has already been used to study the ligation (28), dynamics (29, 31), and urea- or guanidine hydrochloride-induced unfolding (30) of cyt c. Using cyt c selectively deuterated at Leu68, Lys72, Lys73, Lys79, and Met80 (Figure 1), we observe under equilibrium conditions that the alkaline transition produces an intermediate that does not involve lysine misligation. Only with a further increase in pH are the lysine misligates observed. We find that the Lys73 misligate is more stable than the Lys79 misligate and that no Lys72 misligate is formed at a detectable level. At even higher pH, a fourth intermediate is formed, which likely corresponds to the previously observed hydroxide-misligate state V (7), and then the protein is observed to lose tertiary structure.
Figure 1.
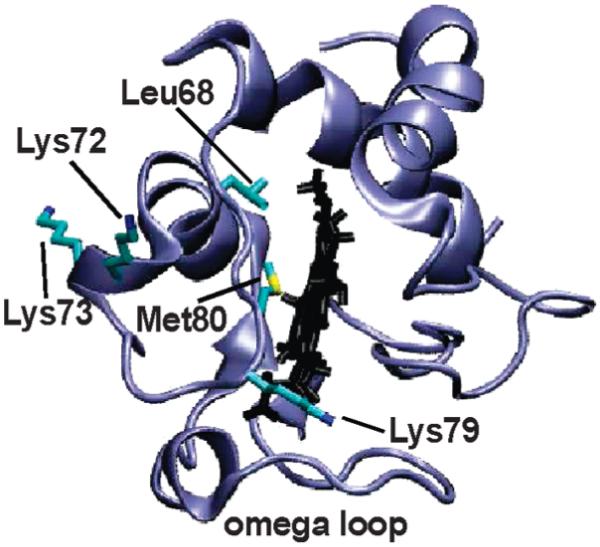
Structure of cyt c (43) showing residues characterized.
To gain further insight into the intermediate structures and the origins of the transitions induced with increasing pH, we have employed simulations using minimalist models based on funneled energy landscapes with specific sources of frustration (33). By averaging over side chain fluctuations and small local motions, minimalist models allow a rather complete characterization of energy landscapes without the computational sampling limitations currently inherent to many all-atom models. Approaches based on these concepts, having originally been introduced in the context of lattice models (34), are known to successfully describe folding events for both monomeric (35-37) and dimeric proteins (38). We have already used this approach to correctly predict the folding sequence of cyt c as inferred by hydrogen exchange experiments (2). The combination of experimental and computational approaches allows a more comprehensive description of the transitions associated with increasing pH.
MATERIALS AND METHODS
Sample Preparation
Site-selectively deuterated cyt c was prepared using a semisynthetic approach, as described previously (31). Briefly, the homoserine lactone peptide corresponding to residues 1–65 of horse heart cyt c, with a covalently bound heme, was generated using cyanogen bromide cleavage of commercially available cyt c (Sigma). The peptide was purified by HPLC and then refolded at pH 7 in the presence of 1 equiv of the chemically synthesized peptide corresponding to residues 66–104. This synthesized peptide was either fully proteo or contained one specifically deuterated residue. Boc-protected, deuterated amino acids were purchased from Cambridge Isotope Laboratories (Boston, MA), except for N-tert-butyloxycarbonyl-Nε-(2-chlorobenzyloxycarbonyl)-d8-l-lysine, which was prepared by protection of the free amino acid (Supporting Information). Fragment association and aminolysis of the homoserine lactone resulted in high yields of semisynthetic cyt c with the wild-type sequence, except at residue 65, which is homoserine instead of methionine (39). The homoserine substitution has been shown to be inconsequential to the biological function of cyt c (39). The final condensation product was purified over Sephadex G50 fine to remove the fragments, oxidized with bis(dipicolinato)cobaltate(III), and desalted over Sephadex G25. All proteins were characterized by analytical HPLC, ES MS, and UV/vis spectroscopy.
pH Titrations
For each data set collected, deuterated cyt c and nondeuterated (proteo) cyt c were synthesized and handled in parallel. The samples were lyophilized in phosphate buffer (NaPO4, pH 6) such that the final concentration of buffer in the samples was 50 mM and the final concentration of protein was 6 mM. For each data point, 18 μL of a solution containing varying concentrations of NaOH in 200 mM NaCl was added to 1.2 mg of lyophilized protein. The salt concentration was chosen because the alkaline transition midpoint is independent of ionic strength above 150 mM (13). A Mettler Toledo InLab 423 electrode was used to directly measure the pH of each sample, and the pH values were corrected using the intensity of the 695 nm absorption (see Supporting Information for details). FT IR measurements were acquired using a Bruker Equinox 55 spectrometer continuously flushed with nitrogen gas and equipped with a liquid nitrogen cooled MCT detector. Samples were allowed to equilibrate at least 10 min prior to measurement. Spectra were collected at 4 cm−1 resolution and constructed from 8192 scans. A FT IR transmission cell with a 50 μm Teflon spacer was used. The spectrum of the proteo sample was taken under identical conditions directly after the measurement of each deuterated sample. FT IR measurements were performed in at least triplicate, culminating in greater than 60 points per titration curve. The UV/vis absorption spectrum of each sample was also recorded in the FT IR cell using an 8452a Hewlett-Packard UV/vis spectrophotometer.
Data Evaluation
Due to the low intensity of absorptions from single C–D bonds (~1–5 mOD), a careful baseline correction of the FT IR spectra was needed to minimize possible spectral distortion by baseline variations (Figure S1). The FT IR absorption spectrum of the proteo sample was subtracted from that of the deuterated sample using subtraction factors close to unity. The resulting difference spectrum was fit to the sum of a fifth order polynomial and a Gaussian over a 150 cm−1 window around the peak of interest. After visual inspection to confirm the smoothness of the fifth order polynomial, it was subtracted from the difference spectrum. Varying the spectral window or the order of the polynomial did not significantly change the results, provided that the subtracted polynomial remained smooth. The baseline-corrected spectra (Figure S2) were then deconvoluted into contributions from folded, high pH, solvent-exposed, and any intermediate signals. First, the spectra for the folded and high pH, solvent-exposed states of cyt c for each residue were obtained by averaging several baseline-corrected spectra obtained at pH 7 or 13.5, respectively. Both averaged spectra were fit by a minimal number of Gaussians as determined by an F-test at the 95% confidence level (Figure S3 and Table S1). Subsequently, all spectra at intermediate pH were fit by a linear combination of the folded and high pH, solvent-exposed signals using the Gaussian lineshapes and relative amplitudes determined for the spectra at pH 7 and 13.5, respectively, and varying only two parameters, the total amplitude of the folded and of the high pH, solvent-exposed signals. In cases where this fit did not provide uniform fit quality over the entire pH range examined, the spectra were carefully inspected for spectroscopic evidence of additional absorptions due to folding intermediate(s). In cases where such a feature was found, an extra Gaussian was added to represent the intermediate species. The spectra were refit as a superposition of the spectra of folded, high pH/solvent-exposed, and intermediate signals, again by varying only the total amplitude of each signal. The absolute amplitudes of folded, unfolded, and any intermediate spectra obtained from the data fits were then normalized by their relative extinction coefficients to obtain the true fractional concentrations for each state. Finally, the fractional amplitudes for each state were averaged by binning the data points in 0.5 pH intervals with error bars displaying root mean squared deviation.
We fit distribution functions to the averaged fractional concentrations for each residue using a linearized version of the Yang and Honig model for pH-induced protein unfolding (40). The pH-dependent free energy differences ΔG°S1→S2(pH) between two states, S1 and S2 (i.e., folded, intermediate, or unfolded states), are given as
| (1) |
where ΔG°neutral,S1→S2 is the free energy difference between the states in the fully neutral state of the protein, pKai(S) and αi(S) are the pKa and the Hill cooperativity coefficient of the ith titratable group in state S, and γ(i) = 1 for basic groups and −1 for acidic groups (41). Only titratable groups that have a different pKa in states S1 and S2 contribute to ΔG°S1→S2(pH). The experimentally observed midpoint for the protein transition due to protonation/deprotonation of the ith group, pHi,m, is located between the pKa’s of S1 and S2. For basic groups and pKai(S1) ≪ pHi,m ≪ pKai(S2), ΔG°S1→S2(pH) can be approximated around the transition midpoint, pHm,S1→S2 (i.e., ΔG°S1→S2 = 0), by
| (2) |
where nS1→S2 is the apparent number of titratable groups that triggers an observed transition and is affected by the inherent cooperativity, which is represented by a Hill coefficient in eq 1. The pH-dependent fractional concentration of an experimentally observed state Si is then given by
| (3) |
where ΔG°Sj→A(pH) is the free energy difference between the jth state of the system and the high pH state, and the sum in the denominator runs over all states of the system (folded, intermediate, high pH).
UV/vis spectra were also acquired and deconvoluted in order to determine the absorbance spectrum for each intermediate observed. The pH-dependent UV/vis spectra were fit to the equation
| (4) |
where εi(λ) is the extinction coefficient of the ith state and ci(pH) is its fractional concentration. Fractional populations of each state were determined using the parameters derived from the linearized Yang and Honig model applied to the C–D data (see Supporting Information).
Single Memory AMH Simulations
Simulations were carried out in a manner similar to previous work (2) and were based on the Associative Memory Hamiltonian (AMH) (42). A perfect folding funnel was ensured by using only a single “memory” protein conforming to the native NMR solution structure (PDB ID 1akk (43)). However, unlike the previous model, the current heme model had a fifth heme pseudoatom placed in the center of the heme to provide an anchoring point for misligation. Harmonic constraints were used to ensure a realistic size and shape of the heme and its planarity. Heme-contact potentials were represented by Gaussian well potentials of depth γij = 0.290 similar to the protein–protein contacts described previously (44). Simulations were performed at a temperature such that the ΔG (pH 7) between the folded and unfolded states was about 8kBT as observed experimentally. On a perfectly funneled energy landscape the native state is electrostatically optimized, and therefore deprotonation will decrease the energy of pairwise contacts which was approximated as γijdeprotonated = 0.9γij. The factor of 0.9 was determined by calculating the total electrostatic destabilization energy caused by deprotonation of all tyrosine and lysine residues using several reasonable dielectric constants. The total electrostatic destabilization energy distributed among all contacts involving deprotonated residues was about 5–15% of γij depending on the choice of dielectric constant. Neither the nature of the intermediate ensembles nor their relative stabilities changed significantly within this range when variations were made. Heme ligation was enforced by adding a harmonic potential k(r − r0)2 between the heme center pseudoatom and the Cα of the ligating residue with r0 = 7 Å for lysine residues. Ligated simulations were run for all 19 Lys residues in cyt c while assigning deprotonated contact energies γijdeprotonated to all tyrosine and lysine contacts and protonated contact energies γij to all other contacts.
Isodensity surface plots were generated by calculating the probability for each backbone atom to exist in 1 Å3 cubes of Cartesian space after using a rmsd minimization procedure3 to align 100 structures randomly selected from the free energy minimum of the misligated ensemble. The plots show the isosurface under which backbone atoms exist with a probability greater than a specified cutoff of 0.09, which was chosen to best visualize the differences between the misligated structures. The protein was divided into six segments of approximately 18 residues, and each segment was aligned onto the native structure by rmsd minimization. In contrast to a global structure alignment, this procedure results in isodensity plots that are more readily visualized due to less ambiguity in rmsd minimization.
RESULTS
To characterize the alkaline transition of cyt c, as well as the other transitions induced by increased alkalinity, we synthesized five different isotopically labeled proteins with either (C∊-d3) methionine incorporated at Met80 ((d3)Met80); (Cβ,γδ∊-d8) lysine incorporated at Lys72 ((d8)Lys72), Lys73 ((d8)Lys73), or Lys79 ((d8)Lys79); or a 1:1 mixture of (Cδ1-d3) and (Cδ2-d3) labeled leucine isotopomers incorporated at Leu68 ((d3)Leu68) (Figure 1). The FT IR spectrum of each deuterated residue is comprised of symmetric and asymmetric stretching absorptions centered around 2100 and 2200 cm−1, respectively, which are superimposed on a broad water absorption band. We followed the alkaline-induced changes in the protein by characterizing the strongest absorption of each residue as a function of pH. This included the symmetric stretches for (d8)Lys72, (d8)Lys73, (d8)Lys79, and (d3)Met80, and the asymmetric stretches for (d3)Leu68. The absorptions at pH 7 are assigned to state III (the native protein). In each case, the high pH absorptions are identical to those of the corresponding free amino acid under identical conditions and thus are assigned as the high pH, solvent-exposed signals.
Alkaline-Induced Loss of Tertiary Protein Structure
The 60’s helix (residues 60–68) is known to lose structure at pH values higher than those that induce misligation (12), and thus it serves as a marker for the loss of tertiary protein structure. To follow the alkaline-induced changes in tertiary structure, we characterized the absorptions of (d3)Leu68. The asymmetric stretching absorptions of (d3)Leu68 at neutral pH are well fit by two Gaussians (Figure S3) and are assigned to the folded protein where the side chain is positioned in a hydrophobic environment (30, 31, 43). At high pH, the spectra are also well fit by two Gaussians (Figure S3), which, as mentioned above, are assigned as the analogous absorptions of a high pH, solvent-exposed (d3)Leu68 (30, 31). All of the spectra at intermediate pH are well fit by a superposition of the folded and high pH, solvent-exposed signals (Figure 2), and the fractional amplitudes as a function of pH show a single sigmoidal transition with a midpoint of pH 12.7 (Figure 3). Based on literature precedent (45), this high pH transition is assumed to reflect the loss of protein tertiary structure and the formation of state U. It should be noted that state U is defined here by the loss of tertiary structure in the 60’s helix and not necessarily by complete unfolding.
Figure 2.

Absorption spectra for each deuterated residue at several representative pH values (thick black lines). Also shown are the deconvolutions into folded, high pH/solvent-exposed, any intermediate signals (thin black lines), and resulting fits (red lines).
Figure 3.

Fractional concentrations corresponding to folded (red), high pH, solvent-exposed (green), and any intermediate (blue) signals observed at each residue. Also shown are fractional concentrations derived from the intensity of the 695 nm absorption band (lower right panel). Data points (>60 per plot) have been binned into 0.5 pH intervals; error bars represent standard deviations. The curves obtained from model fitting are shown as lines (for details see text).
Lysine Misligation
From the structure of cyt c (43), as well as from previous studies (13, 17-19, 22), there are three candidate lysines for misligation under alkaline conditions, Lys72, Lys73, and Lys79. The symmetric stretching absorptions of (d8)Lys72, (d8)Lys73, and (d8)Lys79 at both neutral and strongly alkaline pH are all well fit by two Gaussians (Figure S3) and are assigned to side chain absorptions in folded/protonated and solvent-exposed/deprotonated environments, respectively. In the case of (d8)Lys72, the spectra across the entire pH range examined are well fit by a superposition of the folded/protonated and solvent-exposed/deprotonated signals (Figure 2), and the fractional amplitudes as a function of pH show a single sigmoidal transition with a midpoint at pH 10.6 (Figure 3). The crystal structure of cyt c (43) suggests that Lys72 is solvent-exposed; thus, the observed transition likely corresponds to side chain deprotonation. Indeed, a virtually identical pH-dependent transition is observed for the free amino acid (Figure S4).
In contrast, fitting the spectra of (d8)Lys73 and (d8)Lys79 as a superposition of the high and low pH spectra yielded low-quality fits at intermediate pH values (Figure S5). The residuals of the best fits for the spectra of (d8)Lys79 at intermediate pH show a pattern on the red side of the absorption bands (Figure S5) which suggests that an additional Gaussian is required to accurately fit the spectra. The addition of a Gaussian with a center frequency of 2100 cm−1 to account for this intermediate absorption significantly increased the quality of the fits (at pH 10.4, F value 8.2, critical F value 1.2 at the 95% confidence level; see also Figure S5). (d8)Lys73 shows virtually identical behavior (Figure 2). Based on literature precedent (13, 18, 19) and a similar red shift for (d3)Met80 upon heme ligation, attributed to inductive through-bond effects (29), the red-shifted absorptions are assigned to folding intermediates IVa (Lys73 misligated) and IVb (Lys79 misligated), which reach maximal concentration around pH 10.5 (Figure 3). Based on the work of Mauk and co-workers (7), the transition associated with the loss of IVa and IVb at high pH is assumed to produce state V.
Met80 Ligation and Displacement
The disappearance of the native state, typically as measured by the quenching of the 695 nm absorption band, defines the alkaline transition. To first confirm the literature result, we measured the quenching of the 695 nm absorption with increasing pH (Figure 3). In agreement with previous studies (7, 13, 46), we found that the 695 nm absorption is sigmoidally quenched with a midpoint pH of 8.8. To characterize the alkaline transition using IR spectroscopy, we examined (d3)Met80. The symmetric stretching absorptions of (d3)Met80 at both neutral and strongly alkaline pH are well fit by single Gaussians (Figure S3), again assigned to side chain absorptions in a folded and high pH, solvent-exposed environment. However, fitting the spectra at intermediate pH values to a superposition of folded and high pH, solvent-exposed signals yielded low quality fits (Figure S6), nonsigmoidal behavior of the fractional concentrations (Figure 4A), and behavior that contradicts that of the 695 nm absorption. We therefore fit the data at intermediate pH by including an additional Gaussian to account for an intermediate signal, which improved the fit quality significantly (at pH 10.8, F value 1.7, critical F value 1.4 at the 95% confidence level; see also Figure S6). The additional Gaussian assumes a frequency similar to that of the folded signal, but with a significantly increased line width, and it reduces the amplitude of the folded signal to zero above pH 10. To reduce fit ambiguity, we refit the data, this time fixing the frequency of the additional Gaussian to the folded frequency and its line width to the average value observed in the unrestricted fit for pH >9 (Figure 4B). The pH-dependent amplitudes of the three signals (Figure 3) reveal that the folded signal now parallels the behavior of the 695 nm absorption, decreasing sigmoidally with a midpoint of pH 8.7. The high pH, solvent-exposed signal increases concomitantly with the decreasing folded signal but then plateaus around pH 10 as the intensity of the intermediate signal increases. At even higher pH, the intermediate signal decreases and the solvent-exposed signal increases to 100% amplitude. Interestingly, the sigmoidal disappearance of the folded signal (or the 695 nm absorption), which reflects a change in heme ligation, is clearly separated in pH from where the intermediate signal first appears. The intermediate signal reaches a maximum at pH ~10.5, concomitant with the appearance of the (d8)Lys73 and (d8)Lys79 signals that correspond to states IVa and IVb, respectively. This suggests that Met80 populates at least two conformations in two distinct intermediates, one which grows in at pH 8.7 and directly quenches state III and one which grows in at pH 10 and is associated with IVa and/or IVb. The lower pH intermediate has not been observed previously, and we refer to it as state 3.5 (i.e., the first equilibrium intermediate formed with the addition of base). In agreement with this interpretation of the (d3)Met80 data, the summation of the signals corresponding to states III, IVa, IVb, V, and U, shows that amplitude is clearly missing between pH 9 and pH 10 (Figure 5B). This further supports the population of the additional intermediate 3.5 in this pH range.
Figure 4.

(A) Fractional concentrations corresponding to the folded and high pH, solvent-exposed signals resulting from a two-state fit of the (d3)Met80 data. (B) Line width (full width at half-maximum) of the (d3)Met80 folded signal resulting from a two-state fit in which the frequencies were fixed but the line widths were allowed to vary (for details see text).
Figure 5.

(A) The fractional concentrations (also shown in Figure 3) of the folded signals for Met80 (lower pH transition) and Lys73/Lys79 (higher pH transitions). (B) Total fractional concentration for heme ligation by Met80, Lys73, Lys79, and lysine replacing ligand(s) calculated by summation of the fractional concentrations of the folded signal at Met80 and the intermediate signals and high pH, solvent-exposed signals at Lys73 and Lys79.
Thermodynamic Parameters of the Alkaline-Induced Transitions
The pH-dependent fractional concentrations corresponding to the signals observed at each residue were fit using a linearized version of the Yang and Honig model (see Materials and Methods). The data were fit to two-state ((d3)Leu68 and (d8)Lys72) or three-state ((d8)Lys73 and (d8)Lys79) models based on the number of intermediate species observed. Although only three distinct (d3)Met80 signals were observed, a three-state model was unable to provide a reasonable fit to the data, due to the multisigmoidal behavior observed for the high pH, solvent-exposed signal (see above). It appears that the side chain of (d3)Met80 occupies a similar solvent-exposed environment in at least two states. Therefore, a four-state model was employed which was sufficient to fit the data, where the high pH signal was fit to the sum of an intermediate species and the unfolded species (Figure 3). The resulting midpoints and n values for each transition clearly demonstrate that the alkaline-induced unfolding of cyt c is a very heterogeneous process, with transition midpoints ranging over four pH units and n values ranging between 0.35 and 2.3 (Table 1).
Table 1.
Site-Specific Equilibrium Parameters
| absorption | observed transitiona |
pHm | n | equilibrium transitionb |
|---|---|---|---|---|
| Met80 | N ⇌ I1 | 8.7 ± 0.4 | 1.0 ± 0.2 | III ⇌ (3.5 + IVa) |
| I1 ⇌ I2 | 11.6 ± 0.3 | 0.37 ± 0.07 | (3.5 + IVa) ⇌ IVb | |
| I2 ⇌ A’ | 10.9 ± 0.8 | 1.0 ± 0.4 | IVb ⇌ (V + U) | |
| Lys72 | N ⇌ A | 10.5 ± 0.1 | 0.7 ± 0.2 | deprotonation |
| Lys73 | N ⇌ I | 10.5 ± 0.2 | 0.51 ± 0.06 | (III + 3.5) ⇌ IVa |
| I ⇌ A | 10.0 ± 0.9 | 0.4 ± 0.2 | IVa ⇌ (V + U) | |
| Lys79 | N ⇌ I | 12 ± 1 | 0.35 ± 0.07 | (III + 3.5) ⇌ IVb |
| I ⇌ A | 9 ± 3 | 0.4 ± 0.5 | IVb ⇌ (V + U) | |
| Leu68 | N ⇌ A | 12.7 ± 0.1 | 1.3 ± 0.4 | V ⇌ U |
| 695 nm | N ⇌ A | 8.84 ± 0.01 | 1.18 ± 0.07 | III ⇌ 3.5 |
Equilibrium parameters obtained from fits of the fractional concentrations corresponding to the folded (N), high pH, solvent-exposed (A), and any intermediate (I) signal using the linearized Yang and Honig model. For Met80, a four-state fit was applied corresponding to signals N, two intermediary signals I1 and I2, and the high pH, solvent-exposed signal was fit to the sum of two components, A = I1 + A’ (see text).
Approximate assignments; see text and Supporting Information for details.
UV/Vis Absorption Spectra
UV/vis spectra of cyt c were also collected as a function of pH (Figure 6A). All of the spectra are consistent with the presence of a low-spin heme as evidenced by the absence of an ~620 nm absorption (3). As reported previously, the Soret band shifts slightly, and changes are observed in the Q-band structure between 500 and 600 nm with increasing pH (5, 20, 47). At neutral pH, the Q-bands appear as a featureless broad absorption. At roughly pH 9.5, significant band structure appears around 520 and 550 nm, which peaks in amplitude near pH 10 and then recedes near pH 12. The signals between pH 9.5 and 12 are reminiscent of the reduced protein, suggesting that, in this pH range, the heme center undergoes at least partial autoreduction. Consistent with this interpretation, addition of the oxidant bis(dipicolinoato)Co(III) eliminated the band structure, and it spontaneously reappeared upon dialysis and reequilibration of the protein (Supporting Information). Between pH 12 and pH 13, the spectra again become broad and, above pH 13, shift to higher wavelength. Thus, in agreement with previous reports, the UV/vis spectra also suggest that multiple intermediates are populated as the pH is increased (3, 5, 6, 9), and several apparent transitions are observed (Figure 6B). While it is unclear whether these transitions represent single or several overlapping processes, it is interesting that their midpoints generally group into pH ranges that are coincident with the more structurally resolved C–D IR transitions, with midpoints around pH 9 (III ⇆ 3.5), 10 (3.5 ⇆ IVa/IVb), and 11.5 and 12 (IVa/IVb ⇆ V). The coincidence of the UV/vis and IR transition midpoints supports the interpretation of the IR transitions in terms of structural and/or ligation state changes involving or proximal to the heme.
Figure 6.

(A) UV/vis absorption spectra (solid lines) and their second derivatives (dashed lines) in the Q-band region at different pH values. (B) UV/vis absorption as a function of pH for several wavelengths. Midpoints are indicated with arrows and were obtained from three-state fits.
Minimalist Model Simulations
We next employed minimalist model simulations based on funneled energy landscapes to predict the structure and relative stability of potential lysine-misligated intermediates. Simulations were carried out with individual lysines anchored to the heme center, and a grand canonical formalism was used to calculate free energies. Alkaline conditions were modeled by decreasing the energies of all pairwise contacts involving lysine and tyrosine residues that are deprotonated around pH 10 (see Materials and Methods). This minor perturbation is deemed sufficient to describe the pH-induced changes of the energy landscape based on the results of hydrogen exchange experiments, which have shown that the alkaline transition involves only the unfolding of the two least stable of the five folding subunits (12, 46). Similar types of perturbations have been introduced in minimalist models to account for the structural effects of phosphorylation (48); however, we are not aware of other minimalist studies that treat the effects of pH changes in this fashion. The free energy of each lysine-misligated intermediate was plotted as a function of a reaction coordinate Q, defined as the fraction of contacts that are within 1 Å of their native distance as determined from the crystal structure (Figure 7A). Free energy basins corresponding to the most stable folded structural ensemble for the respective misligated state are observed between Q = 0.5 and 0.8, suggesting that the lysine-misligated species are partly unfolded. The most stable basins for the Lys73- and Lys79-misligated species occur near Q = 0.6. Lys72-, Lys53-, and Lys55-misligated species show the most stable free energy basins around Q = 0.1, which are significantly less stable and essentially unfolded. The predicted relative stability of Lys73- and Lys79-misligated intermediates agrees well with our experimental results and with previously published data (7). The structures at the stable free energy basins of the Lys73- and Lys79-misligated species are collapsed and relatively similar to the folded state as would be expected given the 60% native contacts predicted for these species.
Figure 7.

Results of the minimalist model simulations. (A) Free energy curves as a function of the reaction coordinate Q (related to the fraction of native contacts) obtained from simulation with enforced heme ligation of Lys53 (■), Lys55 (*), Lys72 (+), Lys73 (□), and Lys79 (×). (B–D) Isodensity surface plots determined using structures from the stable free energy basins calculated from simulations for (B) the native state, (C) the Lys73-misligated state, and (D) the Lys79-misligated state. The crystal structure of cyt c (black) is superimposed for comparison (see text for details).
DISCUSSION
Analysis of the IR signals observed for the Met, Leu, and three Lys residues provides a detailed picture of the alkaline-induced transitions in cyt c (Figure 3). Qualitative analysis of the titration data reveals the existence of at least four folding intermediates between pH 7, where the protein assumes its well-characterized folded state (state III), and pH 13, where the protein is unfolded (U), which may be represented as III ⇆ 3.5 ⇆ (IVa ⇆ IVb) ⇆ V ⇆ U. With increasing alkalinity, both the IR and UV/vis signals associated with Met80 ligation in the native state III first disappear in a sigmoidal transition with a midpoint of pH 8.8. Importantly, the native-like signals observed at Lys72, Lys73, and Lys79 in this pH range, where the native Met80 signals are clearly gone (Figure 5A), suggest that the heme center is not misligated by a lysine residue, as misligation is expected to induce a significant red shift in the frequency of the C–D absorption line (28). Moreover, titrations of the free amino acid (Figure S4) show that deprotonation significantly shifts the IR absorption of the C–D probes; therefore, the native-like signals imply that the lysines remain protonated and thus unable to participate in misligation. Only at higher pH do the lysines examined show the absorption changes associated with deprotonation, which for Lys73 and Lys79 is also associated with the appearance of intermediate signals consistent with misligation. The apparent pKa for the deprotonation of each lysine is 10.5, which is close to the pKa expected for a surface-exposed lysine (49). Because the transitions that quench the native Met80 signals and those that introduce lysine misligation have very different midpoints (pH 8.8 and 10.2, respectively), we conclude that while the heme ligation state in 3.5 is not the same as in the native state III, it does not involve lysine misligation. This conclusion contradicts the common assumption that quenching of the 695 nm band is caused by lysine misligation, which is mostly based on the observation that lysine mutation or modification causes the midpoint of the alkaline transition to shift to higher values (Supporting Information) (7, 12, 13). However, this is not observed with all types of lysine modifications; for example, complete amination or maleylation of cyt c, which precludes lysine misligation, does not perturb the alkaline transition at all (24). The simplest conclusion consistent with all of the data is that lysine residues are not directly involved in the alkaline transition (i.e., disappearance of native state III) and that lysine modifications that alter the alkaline transition do so not by preventing ligation but rather by perturbing the stability of state III and/or 3.5.
Of the potential lysine ligands examined, only Lys73 and Lys79 contribute to misligation and are thus associated with states IVa and IVb, respectively, while Lys72 does not appear to contribute to misligation under any conditions. The increased amplitude of IVa, relative to that of IVb, suggests that the Lys73 misligate is more stable than the Lys79 misligate, but neither misligate is ever the dominant species present as their maximal fractional concentrations never exceed 0.4 and 0.15, respectively. The formation of IVa and IVb observed at Lys73 and Lys79 is coincident with a second transition at Met80 (the first being the alkaline transition at pH 8.8, described above), as evidenced by the appearance of a red-shifted absorption, suggesting that the Met80 side chain of this intermediate experiences a relatively more hydrophobic environment. The amplitude of the Met80 intermediate signal is significantly less than the sum of the lysine-misligate signals, suggesting that Met80 is positioned in a more hydrophobic environment in only one of the two lysine misligates and remains solvent-exposed in the other. While the data do not allow an assignment of the Met80 environments to a specific misligate, minimalist model simulations (see below) suggest that the Met80 is buried in IVb and solvent-exposed in IVa.
At pH ~10.7, both Lys73 and Lys79 show a transition to the solvent-exposed/deprotonated state and Met80 shows a third transition. The transition midpoint agrees well with that reported by Mauk and co-workers for the formation of state V (7). The observation of this transition at each lysine as well as at Met80 suggests that the associated conformational change involves the entire Met80 loop. Finally, the transition observed at Leu68, with a midpoint of pH 12.7, marks the conversion of state V into the unfolded state, U. The minimalist model simulations support the conclusion that Leu68 remains in a folded environment in both IVa and IVb and adopts a solvent-exposed environment only at higher pH.
Selective misligation by Lys73 (IVa) and to a lesser extent Lys79 (IVb), but not by any other lysine residues, is also supported by the results of the minimalist model simulations, which predict that they correspond to the most stable free energy basins. To visualize the structural changes associated with misligation, we generated isodensity surface plots for both species as well as for the native protein. These plots show density in segments of the protein that are predicted to be more structured (Figure 7B–D), analogous to electron density maps generated from X-ray crystallographic data. The simulations predict that the Met80 side chain is buried in IVb and solvent-exposed in IVa. Relative to the folded state, the simulations also predict increased heterogeneity in the Met80 loop (residues 70–88), as well as in the Ω loop (residues 40–56), in both IVa and IVb. The increased heterogeneity in these loops is consistent with the increased line width observed for the intermediate IR absorption at Met80, the previously reported NMR structure of the Lys73-misligated Lys79Ala species (19), and hydrogen exchange experiments which demonstrated that the Met80 loop and the Ω loop (residues 40 to 56) are the least stable structural units and that they are induced to unfold upon formation of the lysine misligates (12). The minimalist model simulations reported here suggest that the relative stability of the lysine misligates is related to how much the structural core is disrupted. Misligation by Lys72 is predicted to require partial unfolding the 60’s helix, which, along with the N- and C-terminal helices, contributes to the stable core of cyt c. In contrast, misligation by Lys73 requires local unfolding of only the Met80 loop but not of the core of the protein, while misligation by Lys79 induces rotation of the loop and compensating adjustments within the core.
To generate a global picture of the alkaline-induced transitions, we combined all of the data to approximate the fractional concentrations of each state (Figure 8 and Table S2). The fractional concentrations of states III, IVa, IVb, and U were directly approximated from signals associated with Met80, Lys73, Lys79, and Leu68. No signal is uniquely related to state 3.5; however, the solvent-exposed intermediate signal at Met80 results from the absorptions of both 3.5 and IVa. Therefore, the fractional concentration of state 3.5 was approximated by subtracting the fractional concentration of IVa from the fractional concentration of the solvent-exposed Met80 intermediate signal. Similarly, the fractional concentration of state V, where lysine is displaced from the heme, but the protein is not yet unfolded, was determined from the difference of the high pH signals at Lys73 or Lys79 and Leu68. The fact that the fractional concentrations sum to unity across the entire pH range examined, despite being determined through the characterization of different deuterated residues, supports the proposed model of alkaline-induced unfolding.
Figure 8.

Fractional concentrations derived by combining signals from Figure 3 to represent states III (+, native), 3.5 (×, neither methionine nor lysine ligated), IVa (*, Lys73 ligated), IVb(□, Lys79 ligated), V (■, hydroxide ligated), and U (○, unfolded). The total concentration (Ctot) obtained by summing over the fractional concentrations of the six states is shown in the upper box. See text for details.
While the conclusions of the preceding discussion are based directly on the analysis of the data and do not depend on any model, it is interesting to further analyze the data using a linearized version of the Yang and Honig model for pH-induced protein unfolding (40). This model describes the pH-dependent free energy difference between protein states with two fit parameters, the apparent transition midpoint pHm and the apparent number of titratable groups n whose deprotonation drives the transition, weighted by any inherent cooperativity of the observed transition. Table 1 shows how the observed transitions between native, intermediate, and high pH, solvent-exposed signals are related to the conformational equilibria of cyt c, based on the assignments described above, and Scheme 1 summarizes apparent midpoints and n values. The midpoints of transition III ⇆ 3.5 (Met80 dissociation), IVa/IVb ⇆ V (loss of lysine misligation), and V ⇆ U (loss of tertiary structure) agree well with previously reported data (7-9, 11, 12). The III ⇆ 3.5 transition is observed only at Met80, and its midpoint is lower than any other transition midpoint, suggesting that this transition is somewhat localized. In contrast, the similar midpoints for the 3.5 ⇆ IVa/IVb and IVa/IVb ⇆ V transitions observed at Met80, Lys73, and Lys79 suggest that these transitions are part of a more delocalized and cooperative conformational change involving most of the Met80 loop (22). Interestingly, these results provide an explanation for the results of pH-jump hydrogen exchange experiments, which suggest that the exchange rate observed at Met80 increases significantly around pH 9, while the exchange rates for most residues of the Met80 loop increase only for pH values greater than 10 (12).
Scheme 1.

a
a The observed transitions are shown with the apparent midpoint and n values (in parentheses) above each arrow.
An analysis of the apparent n values (Table 1) suggests that the transitions of cyt c induced with increased alkalinity are driven by five independent deprotonation events. For the alkaline transition (III ⇆ 3.5), n = 1.0 ± 0.2 (measured at Met80); thus the classical alkaline transition is driven by a single deprotonation. Two additional deprotonations drive the formation of the two lysine misligates. The apparent n value for 3.5 – IVa is 0.51 ± 0.06 (measured at Lys73) and for 3.5 – IVb it is 0.35 ± 0.07 (measured at Lys79). That the individual n values for the formation of the two lysine misligates are each less than unity reflects the negative cooperativity, i.e., Hill coefficients less than unity (50), that exists in this case because only a single lysine may misligate at a time. Interestingly, the apparent n values sum to unity, supporting the suggestion that only Lys73 and Lys79 participate in lysine misligation. Similarly, the n values for IVa ⇆ V (n = 0.4 ± 0.2) and for IVb ⇆ V (n = 0.4 ± 0.5) sum to approximately 1, suggesting that a fourth deprotonation, with an apparent midpoint of pH ~10.7, drives the transition from the equilibrium between the two lysine misligates to state V. Finally, the loss of tertiary structure (V ⇆ U) is driven by a fifth deprotonation (n = 1.3 ± 0.4) with an apparent midpoint of pH 12.7.
Using the fractional amplitudes of each species determined from the IR spectra as constraints, we deconvoluted the UV/vis spectra into the absorptions of each intermediate, 3.5, IVa, IVb, and V (Figure 9 and Supporting Information). Interestingly, only the spectra corresponding to IVa and IVb show the unique Q-band structure, with absorption peaks at 520 and 550 nm. The deconvoluted spectra of IVa and IVb resemble the spectrum of the ferrous protein. The unique association of these bands with the lysine misligates is also consistent with the known ability of amine ligands to reduce iron(III) porphyrins (51, 52), and similar observations have been reported for the alkaline form of Pseudomonas aeruginosa cyt c (53). Independent of the fit, these spectral features grow in concomitantly with the IR signals associated with the lysine misligates and significantly after the native Met80 signals have disappeared, further supporting the population of 3.5, in which the ligation state of the heme has changed, but it is not yet ligated by a lysine side chain.
Figure 9.

Absorption spectra for states III, 3.5, IVa, IVb, V, and U determined by a deconvolution of the UV/vis data using the fractional concentrations determined from the IR data (see text and Supporting Information for details).
In summary, the FT IR data support a model wherein with increasing alkalinity four intermediates are populated in addition to the folded and unfolded states. Three of these alkaline-induced intermediates, IVa, IVb, and V, have been observed previously using different techniques (7, 13, 17-19, 22). The fourth, 3.5, has not been detected previously, but its presence is consistent with the well-documented observation that fully lysine blocked cyt c can still undergo a native-like alkaline transition (24). One reason that other experiments may have failed to detect 3.5 is that they focused on proteins from other species, where elevated pKa’s for the alkaline transition may result in overlapping transitions and the presence of multiple species.
The observation that lysine misligation is not involved in the classical alkaline transition raises two obvious questions: what is the deprotonation responsible for the alkaline transition and what is the nature of the intermediate produced. One hypothesis is that Met80 remains bound to the heme center and that the alkaline transition involves a localized change in conformation and/or electrostatics that quenches the 695 nm absorption and shifts the absorptions of the deuterated Met80 methyl group. Indeed, while it is known that the presence of the 695 nm absorption is diagnostic of axial methionine ligation, its absence does not necessarily imply Met80 dissociation (6). Indeed, UV/vis and NMR characterization of the thermal denaturation of cyt c suggests that the 695 nm absorption is quenched before Met80 dissociates (54). If this is the case, candidate residues for deprotonation include His18 (which via the trans influence might weaken of the Met80–Fe bond (55)) or some other internal residue whose deprotonation may induce relaxation of the heme crevice and be rate limited by fluctuations of the Ω loop (residues 40–56) (12). A second hypothesis is based on the observation that, in the crystal structure of ferricytochrome c, the hydroxyl group of Tyr67 simultaneously H-bonds with Met80 and a well-ordered water molecule (56). Suggestively, removal of the Tyr67 hydroxyl group by mutation to phenylalanine stabilizes the Met80 ligand, both to increased temperature and to the alkaline transition (53, 56). Thus it is possible that removing a proton from the Met80–Tyr67–H2O H-bonding network induces a conformational change that includes the replacement of the native ligand with a partially protonated hydroxide ligand (3, 20, 57). While both of these mechanisms for the alkaline transition remain speculative, and their relationship to the intermediate observed under time-resolved pH-jump experiments (25-27) is unclear, the C–D based IR approach described here is well suited for their further study, both under stated-state and time-resolved conditions.
Supplementary Material
ACKNOWLEDGMENT
We thank Professor Grant Mauk (University of British Columbia) and Professor Peter Hildebrandt (Technische Universität Berlin) for helpful discussions.
Footnotes
This work was supported by the National Science Foundation under Grant MCB 0346967. Any opinions, findings, and conclusions expressed here are those of the author(s) and do not necessarily reflect the views of the National Science Foundation.
- cyt c
- ferricytochrome c
- C–D
- carbon–deuterium
- FT IR
- Fourier-transform infrared.
Note that while Theorell and Åkesson originally used V to denote the unfolded state, Mauk and co-workers later identified a hydroxide-ligated intermediate that they designated as state V. We adopt Mauk’s nomenclature and designate the unfolded state as U.
Fitting was performed using the McLachlan algorithm (1) as implemented in the program ProFit (A. C. R. Martin, http://www.bioinf.org/uk/software/profit/).
REFERENCES
- 1.McLachlan AD. Rapid comparison of protein structures. Acta Crystallogr. 1982;A38:871–873. [Google Scholar]
- 2.Weinkam P, Zong C, Wolynes PG. A funneled energy landscape for cytochrome c directly predicts the sequential folding route inferred from hydrogen exchange experiments. Proc. Natl. Acad. Sci. U.S.A. 2005;102:12401–12406. doi: 10.1073/pnas.0505274102. [DOI] [PMC free article] [PubMed] [Google Scholar]
- 3.Scott RA, Mauk AG. University Science Books; Sausalito, CA: 1996. pp. 611–634. [Google Scholar]
- 4.Jones CM, Henry ER, Hu Y, Chan C, Luck SD, Bhuyan A, Roder H, Hofrichter J, Eaton WA. Fast events in protein folding initiated by nanosecond laser photolysis. Proc. Natl. Acad. Sci. U.S.A. 1993;90:11860–11864. doi: 10.1073/pnas.90.24.11860. [DOI] [PMC free article] [PubMed] [Google Scholar]
- 5.Theorell H, Akesson AJ. Studies on cytochrome c. II. The optical properties of pure cytochrome c and some of its derivatives. J. Am. Chem. Soc. 1941;63:1812–1818. [Google Scholar]
- 6.Moore GR, Pettigrew GW. Cytochromes c. Evolutionary, Structural and Physiochemical Aspects. Springer-Verlag; Berlin: 1990. [Google Scholar]
- 7.Dopner S, Hildebrandt P, Rosell FI, Mauk AG. Alkaline conformational transitions of ferricytochrome c studied by resonance Raman spectroscopy. J. Am. Chem. Soc. 1998;120:11246–11255. [Google Scholar]
- 8.Gray HB, Winkler JR. Electron transfer in proteins. Annu. Rev. Biochem. 1996;65:537–561. doi: 10.1146/annurev.bi.65.070196.002541. [DOI] [PubMed] [Google Scholar]
- 9.Blouin C, Guillemette JG, Wallace CJ. Resolving the individual components of a pH-induced conformational change. Biophys. J. 2001;81:2331–2338. doi: 10.1016/S0006-3495(01)75879-1. [DOI] [PMC free article] [PubMed] [Google Scholar]
- 10.Eaton WA, Hochstrasser RM. Electronic spectrum of single crystals of ferricytochrome-c. J. Chem. Phys. 1967;46:2533–2539. doi: 10.1063/1.1841081. [DOI] [PubMed] [Google Scholar]
- 11.Smith DW, Williams RJP. The spectra of ferric haems and haemoproteins. Struct. Bonding (Berlin) 1970;7:1–45. [Google Scholar]
- 12.Hoang L, Maity H, Krishna MM, Lin Y, Englander SW. Folding units govern the cytochrome c alkaline transition. J. Mol. Biol. 2003;331:37–43. doi: 10.1016/s0022-2836(03)00698-3. [DOI] [PubMed] [Google Scholar]
- 13.Rosell FI, Ferrer JC, Mauk AG. Protein-linked protein conformational switching: definition of the alkaline conformational transition of yeast iso-1-ferricytochrome c. J. Am. Chem. Soc. 1998;120:11234–11245. [Google Scholar]
- 14.Tonge P, Moore GR, Wharton CW. Fourier-transform infra-red studies of the alkaline isomerization of mito-chondrial cytochrome c and the ionization of carboxylic acids. Biochem. J. 1989;258:599–605. doi: 10.1042/bj2580599. [DOI] [PMC free article] [PubMed] [Google Scholar]
- 15.Filosa A, Ismail AA, English AM. FTIR-monitored thermal titration reveals different mechanisms for the alkaline isomerization of tuna compared to horse and bovine cytochromes c. J. Biol. Inorg. Chem. 1999;4:717–726. doi: 10.1007/pl00010652. [DOI] [PubMed] [Google Scholar]
- 16.Filosa A, Wang Y, Ismail AA, English AM. Two-dimensional infrared correlation spectroscopy as a probe of sequential events in the thermal unfolding of cytochromes c. Biochemistry. 2001;40:8256–8263. doi: 10.1021/bi002710n. [DOI] [PubMed] [Google Scholar]
- 17.Hong XL, Dixon DW. NMR study of the alkaline isomerization of ferricytochrome c. FEBS Lett. 1989;246:105–108. doi: 10.1016/0014-5793(89)80262-5. [DOI] [PubMed] [Google Scholar]
- 18.Ferrer JC, Guillemette JG, Bogumil R, Inglis SC, Smith M, Mauk AG. Identification of Lys79 as an iron ligand in one form of alkaline yeast iso-1-ferricytochrome-c. J. Am. Chem. Soc. 1993;115:7507–7508. [Google Scholar]
- 19.Assfalg M, Bertini I, Dolfi A, Turano P, Mauk AG, Rosell FI, Gray HB. Structural model for an alkaline form of ferricytochrome c. J. Am. Chem. Soc. 2003;125:2913–2922. doi: 10.1021/ja027180s. [DOI] [PubMed] [Google Scholar]
- 20.Silkstone GG, Cooper CE, Svistunenko D, Wilson MT. EPR and optical spectroscopic studies of Met80X mutants of yeast ferricytochrome c: models for intermediates in the alkaline transition. J. Am. Chem. Soc. 2005;127:92–99. doi: 10.1021/ja045719b. [DOI] [PubMed] [Google Scholar]
- 21.Perroud TD, Bokoch MP, Zare RN. Cytochrome c conformations resolved by the photon counting histogram: Watching the alkaline transition with single-molecule sensitivity. Proc. Natl. Acad. Sci. U.S.A. 2005;102:17570–17575. doi: 10.1073/pnas.0508975102. [DOI] [PMC free article] [PubMed] [Google Scholar]
- 22.Maity H, Rumbley JN, Englander SW. Functional role of a protein foldons—An omega-loop foldon controls the alkaline transition in ferricytochrome c. Proteins. 2006;63:349–355. doi: 10.1002/prot.20757. [DOI] [PubMed] [Google Scholar]
- 23.Pollock WB, Rosell FI, Twitchett MB, Dumont ME, Mauk AG. Bacterial expression of a mitochondrial cytochrome c. Trimethylation of lys72 in yeast iso-1-cytochrome c and the alkaline conformational transition. Biochemistry. 1998;37:6124–6131. doi: 10.1021/bi972188d. [DOI] [PubMed] [Google Scholar]
- 24.Pettigrew GW, Aviram I, Schejter A. The role of the lysines in the alkaline heme-linked ionization of ferric cytochrome c. Biochem. Biophys. Res. Commun. 1976;68:807–813. doi: 10.1016/0006-291x(76)91217-1. [DOI] [PubMed] [Google Scholar]
- 25.Uno T, Nishimura Y, Masamichi T. Time-resolved resonance Raman study of alkaline isomerization of ferricytochrome c. Biochemistry. 1984;23:6802–6808. [Google Scholar]
- 26.Hasumi H. Kinetic studies on isomerization of ferricytochrome c in alkaline and acid pH ranges by the circular dichroism stopped-flow method. Biochim. Biophys. Acta. 1980;626:265–276. doi: 10.1016/0005-2795(80)90120-8. [DOI] [PubMed] [Google Scholar]
- 27.Kihara H, Saigo S, Nakatani H, Hiromi K, Ikeda-Saito M, Iizuka T. Kinetic study of isomerization of ferricytochrome c at alkaline pH. Biochim. Biophys. Acta. 1976;430:225–243. doi: 10.1016/0005-2728(76)90081-5. [DOI] [PubMed] [Google Scholar]
- 28.Chin JK, Jimenez R, Romesberg FE. Protein dynamics and cytochrome c: Correlations between ligand vibrations and redox activity. J. Am. Chem. Soc. 2002;124:1846–1847. doi: 10.1021/ja012312n. [DOI] [PubMed] [Google Scholar]
- 29.Chin JK, Jimenez R, Romesberg FE. Direct observation of protein vibrations by selective incorporation of spectroscopically observable carbon-deuterium bonds in cytochrome c. J. Am. Chem. Soc. 2001;123:2426–2427. doi: 10.1021/ja0033741. [DOI] [PubMed] [Google Scholar]
- 30.Sagle LB, Zimmermann J, Dawson PE, Romesberg F. Direct and high resolution characterization of cytochrome c equilibrium folding. J. Am. Chem. Soc. 2006;128:14232–14233. doi: 10.1021/ja065179d. [DOI] [PubMed] [Google Scholar]
- 31.Sagle LB, Zimmermann J, Matsuda S, Dawson PE, Romesberg FE. Redox-coupled dynamics and folding in cytochrome c. J. Am. Chem. Soc. 2006;128:7909–7915. doi: 10.1021/ja060851s. [DOI] [PubMed] [Google Scholar]
- 32.Thielges MC, Case DA, Romesberg FE. Carbon-deuterium bonds as probes of dihydrofolate reductase. J. Am. Chem. Soc. 2008 doi: 10.1021/ja0779607. Web release date: April 16, 2008. [DOI] [PMC free article] [PubMed] [Google Scholar]
- 33.Onuchic JN, Wolynes PG, Luthey-Schulten Z, Socci ND. Toward an outline of the topography of a realistic protein-folding funnel. Proc. Natl. Acad. Sci. U.S.A. 1995;92:3626–3630. doi: 10.1073/pnas.92.8.3626. [DOI] [PMC free article] [PubMed] [Google Scholar]
- 34.Ueda Y, Taketomi H, Go N. Studies on protein folding, unfolding, and fluctuations by computer simulation. II. A. Three-dimensional lattice model of lysozyme. Biopolymers. 1978;17:1531–1548. [Google Scholar]
- 35.Alm E, Baker D. Prediction of protein-folding mechanisms from free-energy landscapes derived from native structures. Proc. Natl. Acad. Sci. U.S.A. 1999;96:11305–11310. doi: 10.1073/pnas.96.20.11305. [DOI] [PMC free article] [PubMed] [Google Scholar]
- 36.Clementi C, Jennings PA, Onuchic JN. How native-state topology affects the folding of dihydrofolate reductase and interleukin-1β. Proc. Natl. Acad. Sci. U.S.A. 2000;97:5871–5876. doi: 10.1073/pnas.100547897. [DOI] [PMC free article] [PubMed] [Google Scholar]
- 37.Koga N, Takeda S. Roles of native topology and chain-length scaling in protein folding: a simulation study with a Go-like model. J. Mol. Biol. 2001;313:171–180. doi: 10.1006/jmbi.2001.5037. [DOI] [PubMed] [Google Scholar]
- 38.Levy Y, Cho S, Shen T, Onuchic JN, Wolynes PG. Symmetry and frustration in protein energy landscapes: a near degeneracy resolves the Rop dimer-folding mystery. Proc. Natl. Acad. Sci. U.S.A. 2005;102:2373–2378. doi: 10.1073/pnas.0409572102. [DOI] [PMC free article] [PubMed] [Google Scholar]
- 39.Wallace CJ, Clark-Lewis I. Functional role of heme ligation in cytochrome c. Effects of replacement of methionine 80 with natural and non-natural residues by semisynthesis. J. Biol. Chem. 1992;267:3852–3861. [PubMed] [Google Scholar]
- 40.Yang A, Honig B. On the pH dependence of protein stability. J. Mol. Biol. 1993;231:459–474. doi: 10.1006/jmbi.1993.1294. [DOI] [PubMed] [Google Scholar]
- 41.Aune KC, Tanford C. Thermodynamics of the denaturation of lysozyme by guanidine hydrochloride. I. Depdendence on pH at 25 degrees. Biochemistry. 1969;8:4579–4585. doi: 10.1021/bi00839a052. [DOI] [PubMed] [Google Scholar]
- 42.Friedrichs MS, Wolynes PG. Toward protein tertiary structure recognition by means of associative memory Hamiltonians. Science. 1989;246:371–373. doi: 10.1126/science.246.4928.371. [DOI] [PubMed] [Google Scholar]
- 43.Banci L, Bertini I, Gray HB, Luchinat C, Reddig T, Rosato A, Turano P. Solution structure of oxidized horse heart cytochrome c. Biochemistry. 1997;36:9867–9877. doi: 10.1021/bi970724w. [DOI] [PubMed] [Google Scholar]
- 44.Eastwood M, Wolynes PG. Role of explicitly cooperative interactions in protein folding funnels: a simulation study. J. Chem. Phys. 2001;114:4702–4716. [Google Scholar]
- 45.Morishima I, Ogawa S, Yonezawa T, Iizuka T. Nuclear magnetic resonance studies in hemoproteins. IX. pH dependent features of horse heart ferric cytochrome c. Biochim. Biophys. Acta. 1977;495:287–298. doi: 10.1016/0005-2795(77)90385-3. [DOI] [PubMed] [Google Scholar]
- 46.Maity H, Maity M, Englander SW. How cytochrome c folds, and why: submolecular foldon units and their stepwise sequential stabilization. J. Mol. Biol. 2004;343:223–233. doi: 10.1016/j.jmb.2004.08.005. [DOI] [PubMed] [Google Scholar]
- 47.Rosell FI, Harris TR, Hildebrand DP, Dopner S, Hildebrandt P, Mauk AG. Characterization of an alkaline transition intermediate stabilized in the Phe82Trp variant of yeast iso-1-cytochrome c. Biochemistry. 2000;39:9047–9054. doi: 10.1021/bi001095k. [DOI] [PubMed] [Google Scholar]
- 48.Shen T, Zong C, Hamelberg D, McCammon JA, Wolynes PG. The folding energy landscape and phosphorylation: modeling the conformational switch of the NFAT regulatory domain. FASEB J. 2005;19:1389–1395. doi: 10.1096/fj.04-3590hyp. [DOI] [PubMed] [Google Scholar]
- 49.Kyte J. Structure in Protein Chemistry. Garland Science; New York: 1995. [Google Scholar]
- 50.Schaller W, Robertson AD. pH, ionic strength, and temperature dependences of ionization equilibria for the carboxyl groups in turkey ovomucoid third domain. Biochemistry. 1995;34:4714–4723. doi: 10.1021/bi00014a028. [DOI] [PubMed] [Google Scholar]
- 51.Castro C, Jamin M, Yokoyama W, Wade R. Ligation and reduction of iron(III) porphyrines by amines. A model for cytochrome P-450 monoamine oxidase. J. Am. Chem. Soc. 1986;108:4179–4187. [Google Scholar]
- 52.Marques H, Munro O, Munro T, deWet M, Vashi P. Coordination of N-donor ligands by the monomeric ferric porphyrin N-acetylmicroperoxidase-8. Inorg. Chem. 1999;38:2312–2319. [Google Scholar]
- 53.Li Y, Imaeda K, Inokuchi H. pH and temperature effect on the absorption spectra of Pseudomonas aeruginosa cytochrome c-551 solution. J. Phys. Chem. 1994;98:4726–4728. [Google Scholar]
- 54.Ångström J, Moore GR, Williams RJP. The magnetic susceptibility of ferricytochrome c. Biochim. Biophys. Acta. 1982;703:87–94. [Google Scholar]
- 55.Gadsby PM, Peterson J, Foote N, Greenwood C, Thomson AJ. Identification of the ligand-exchange process in the alkaline transition of horse heart cytochrome c. Biochem. J. 1987;246:43–54. doi: 10.1042/bj2460043. [DOI] [PMC free article] [PubMed] [Google Scholar]
- 56.Luntz TL, Schejter A, Garber EA, Margoliash E. Structural significance of an internal water molecule studied by site-directed mutagenesis of tyrosine-67 in rat cytochrome c. Proc. Natl. Acad. Sci. U.S.A. 1989;86:3524–3528. doi: 10.1073/pnas.86.10.3524. [DOI] [PMC free article] [PubMed] [Google Scholar]
- 57.Oellerich S, Wackbarth H, Hildebrandt P. Spectroscopic characterization of nonnative conformational states of cytochrome c. J. Phys. Chem. B. 2002;106:6566–6580. [Google Scholar]
Associated Data
This section collects any data citations, data availability statements, or supplementary materials included in this article.