

Abstract
Single-molecule techniques have advanced our understanding of transcription by RNA polymerase. A new arsenal of approaches, including single-molecule fluorescence, atomic-force microscopy, magnetic tweezers, and optical traps have been employed to probe the many facets of the transcription cycle. These approaches supply fresh insights into the means by which RNA polymerase identifies a promoter; initiates transcription, translocates and pauses along the DNA template, proofreads errors, and ultimately terminates transcription. Results from single-molecule experiments complement knowledge gained from biochemical and genetic assays by facilitating the observation of states that are otherwise obscured by ensemble averaging, such as those resulting from heterogeneity in molecular structure, elongation rate, or pause propensity. Most studies to date have been performed with bacterial RNA polymerase, but work is also being carried out with eukaryotic polymerase (Pol II) and single-subunit polymerases from bacteriophages. We discuss recent progress achieved by single-molecule studies, highlighting some of the unresolved questions and ongoing debates.
Keywords: transcription, initiation, elongation, termination, optical traps, fluorescence
INTRODUCTION
The information needed to create and sustain life is encoded within the DNA of every cell. The nanoscale machine that serves as the molecular gatekeeper to this repository of information is the enzyme RNA polymerase (RNAP). RNAP moves along the DNA template while transcribing selected portions into messenger RNA, thereby initiating the process of gene expression. From a biophysical perspective, the motion of RNAP along DNA is reminiscent of the action of motor proteins, such as kinesin and myosin, which translocate along microtubule or actin filament substrates, respectively. The activities of RNAP are vastly more complex, however, befitting an enzyme that sits at the nexus of pathways controlling cellular fate. The process of transcription can be divided broadly into three phases—initiation, elongation, and termination—each characterized by distinct chemomechanical activities and levels of regulation.
To initiate transcription, RNAP must first recognize and bind to an appropriate promoter sequence. A variety of initiation factors influence RNAP specificity for different promoters. Some of these factors also aid the polymerase in forming an open promoter complex (OPC), in which the DNA is locally melted to form a transcription bubble, exposing the bases of the template-strand DNA. From here, RNAP typically undergoes a process termed “abortive initiation”, which involves the synthesis of a series of short RNA transcripts, followed by their release and the return of RNAP to the initial promoter site. Eventually, after a number of such fits and starts, RNAP escapes the promoter region, forming a stable, processive transcription elongation complex (TEC) capable of transcribing the entire gene (1).
Elongation, during which individual nucleotides are added to the 3′ end of the growing RNA chain, involves the coordination of translocation along DNA with NTP binding, nucleotide condensation, and the release of inorganic pyrophosphate (PPi). As RNAP carries out elongation, the fundamental nucleotide addition cycle competes with a variety of off-pathway states, many of which have regulatory importance. For example, upon encountering sites of DNA damage, RNAP is thought to stop and backtrack along the template, triggering the process of transcription-coupled repair. Moreover, the misincorporation of an incorrect nucleotide into the nascent RNA may activate nucleolytic activities inside the polymerase or recruit additional cofactors that to help excise the base and correct the error. Finally, transcriptional pausing and arrest, i.e., the transient or permanent entry into catalytically inactive states, also interrupt elongation; such states are targets of regulation by certain transcription factors (2).
Despite all these possibilities for interruption, RNAP can successfully generate transcripts up to 106 nucleotides long (3). However, this prodigious processivity must halt efficiently and precisely at the end of a gene. Transcriptional termination is induced by specific structural elements that form in the nascent RNA, or by active termination factors that can act directly upon the TEC. The effect of these mechanisms is to release the newly-minted RNA and dissociate the otherwise-stable elongation complex, allowing the transcription cycle to begin anew (4).
The repertoire of biomechanical processes displayed during transcription makes RNAP particularly intriguing for study. Bulk biochemical studies have previously identified and characterized many of the essential activities of RNAP, but certain details are obscured by ensemble averaging, or by the comparatively limited time resolution available. Single-molecule techniques offer a means to pick apart the some of the catalytic states and complex behaviors of individual macromolecules with improved spatial and temporal resolution.
The physical mechanism of abortive initiation has recently been characterized using innovative single-molecule fluorescence and magnetic tweezers-based techniques. Those experiments suggest that the template DNA becomes “scrunched” within the footprint of RNAP during the initiation phase of transcription (5, 6). Results from high-resolution optical trapping assays indicate that during elongation, RNAP likely moves as a rigid body along DNA in single-base increments, maintaining a tight coupling between movements along the DNA and the lengths of RNA transcripts (7). The ability to apply controlled loads during active transcription has supplied new information about chemomechanical coupling, suggesting that RNAP motion may be a consequence of the rectification of random thermal motion brought about by the binding and hydrolysis of NTPs (7–9). Detailed measurements of single-molecule elongation rates have identified a class of short-lifetime pauses that frequently interrupt transcription, even in genes previously thought to be devoid of strong regulatory pauses (10–13), adding another layer of complexity to the kinetics of elongation. Finally, single-molecule studies have indicated that the release of template DNA during the transcriptional termination process is preceded by entry into an elongation-incompetent state (14).
This review will discuss these and other recent findings from single-molecule work, with an eye towards future applications.
SINGLE-MOLECULE TECHNIQUES
Single-molecule techniques for investigating the transcription cycle fall into three classes: Atomic force microscopy (AFM), single-molecule fluorescence, and methods that track the motions of tiny particles to which molecules of interest are attached, such as magnetic tweezers, optical traps (OT) and the tethered particle motion assay (TPM) (15).
Scanning-mode AFM has been used successfully to image ultrastructural alterations in the TEC, such as changes in the bend angles of the template DNA induced by RNAP (16). To visualize transcription, active TECs are generally deposited onto an atomically flat surface, such as mica, then scanned with the tip of an AFM cantilever (Figure 1) as minute deflections are detected by a laser that reflects off the cantilever surface. Scanning-mode AFM techniques have allowed the reconstruction of two-dimensional images of transcriptional complexes to ~2 nm accuracy; however, artifacts produced by the process of sample deposition onto the surface, as well as the projection of the three-dimensional molecular structure into two dimensions, can complicate the interpretation of images (17).
Figure 1.

Atomic force microscopy. TECs are deposited onto an atomically flat surface (lower right panel). A microfabricated cantilever with a sharp tip is scanned over the sample. Deflections of the cantilever are registered by means of laser light reflected onto a position-sensitive detector (left panel). Detector signals are used to reconstruct a two-dimensional image (simulated image shown in the upper right panel)
Single-molecule fluorescence tracking has been used to monitor the binding and residence time of fluorescently-tagged transcription factors that influence the catalytic properties of RNAP (18) (Figure 2). By tracking a tagged RNAP itself, or by monitoring the incorporation of fluorescent nucleotides into an RNA chain, the processes of promoter search or elongation can be studied with minimal perturbation (19–23). Structural rearrangements of the TEC that occur during the transcription cycle can also be monitored using fluorescence (Förster) resonance energy transfer (FRET) (Figure 2) (6, 24, 25). FRET can be used to follow the distance between two appropriately selected fluorophores by means of the non-radiative coupling of fluorescence energy from one to another, which leads to a change in the emission properties. This technique requires both a donor and an acceptor dye, which are each covalently attached to the molecule(s) of interest in close proximity, typically within 2–10 nm. When the donor fluorophore is exposed to excitation light, it can transfer some of its excited-state energy to the acceptor fluorophore in a process that depends on the inverse sixth power of the distance between fluorophores. By measuring the intensity change in acceptor fluorescence, distances on the order of nanometers can currently be measured in single molecules with millisecond time resolution (26).
Figure 2.

Single-molecule fluorescence methods. Fluorescence may be used to track binding and residence times of accessory factors (upper panel) or the position of the RNAP holoenzyme by covalently attaching a fluorescent dye (yellow star) and exciting it with an appropriate wavelength (wavy blue arrows). FRET (lower panel) allows the determination of intramolecular distances through fluorescent coupling between a donor (yellow star) and an acceptor (red star) dye. In the lower left panel, the donor (yellow) is excited (blue arrows) and emits light. When the donor fluorophore moves sufficiently close to the acceptor (lower right), resonance energy transfer results in emission of a longer wavelength by the acceptor. The degree of acceptor emission relative to donor excitation is sensitive to the distance between the attached dyes.
The final class of single-molecule techniques typically employs micrometer-sized beads attached to single RNAP molecules or to associated nucleic acids. Records of the positions of these beads report on the locations or rotational states of the enzyme (27–29). Such beads can also be used as “handles” through which forces may be applied to molecules (28, 30). The position of a bead-tagged RNAP can be determined sensitively by measuring the light scattered from the bead, either by centroid tracking in video images (31) or, more precisely, through laser-based light scattering (28).
By tethering the polymerase and the end of the DNA template between a polystyrene bead and the coverglass surface, the changing length of the DNA, and therefore the progress of the enzyme, can be determined from the averaged amplitude of the Brownian motion of the tethered bead. This is the TPM assay (Figure 3a) (32). Improved resolution in the length of the DNA tether may be obtained by applying external force to the bead, thereby straightening the tether and allowing for a more direct measurement of displacement. Apart from improving the positional resolution of the measurement, application of such a force can be used to energetically bias steps in the transcription cycle that involve motion along the tether. Just as changes in substrate concentration bias chemical reactions through mass action, variations in applied force bias translocation, providing further insights into mechanisms of motor motion (sidebar).
Figure 3.

Bead-based, single-molecule transcription assays. DNA is shown in blue, RNA in red, beads in light blue, optical traps in pink, fluorescent beads in yellow, magnets and magnetic beads in orange/blue. Directions of applied forces are shown by straight black arrows. The coverglass surface is indicated by a blue horizontal line.
A) TPM assay. This method tracks transcriptional progress by averaging the Brownian excursions of a bead tethered by a changing length of DNA to a molecule of RNAP immobilized on the coverglass surface.
B) Surface-based DNA-pulling OT assay. RNA polymerase is bound to a bead, and the distal end the DNA template is anchored to the coverglass. Force is exerted on the bead by an optical trap. Here, the force is shown assisting polymerase motion; reversal of the template direction allows the application of hindering loads.
C) Surface-based RNA-pulling OT assay. A molecular handle comprised of dsDNA with a complementary ssDNA overhang is annealed to the 5′ end of the nascent RNA. As in (B), the RNAP is bound to a bead, and the DNA is anchored to the coverglass. Forces applied to the bead produce tension on the transcript.
D) Pipette-based DNA-pulling assay. An RNAP molecule is bound to a bead held by a suction micropipette, and the distal end of the DNA template is attached to a second, free bead. Fluid flow exerts viscous forces on the free bead (right), placing tension on the tether.
E) Dumbbell OT assay. Two beads, one attached to an RNAP molecule and the other to the distal end of the DNA template, are levitated above the surface by twin optical traps. Transcriptional progress of RNAP can be measured free of drift caused by motion of the coverglass surface.
F) Fluorescent particle rotation assay. A larger bead is decorated with smaller fluorescent reporter beads, which can be used to determine its angle about a vertical axis. Similar to (A), the larger bead is tethered to a molecule of RNAP on the coverglass surface through the template DNA. Rotations of RNAP around the DNA template axis during elongation or promoter search lead to rotations of the larger bead that can be directly visualized.
G) Magnetic tweezers assay. A superparamagnetic bead is tethered to one end of a DNA molecule whose distal end is attached to the coverglass surface. External magnets are used to impart both twist and small amounts of tension to the DNA. Rotations of these magnets underwind the DNA and induce the formation of plectonemes. Melting of the transcription bubble during initiation adds positive twist to the template, removing plectonemes and causing a large change in the height of the tethered bead that can be measured directly.
One way to apply force to the bead is with an optical trap. Optical traps consist of tightly focused beams of infrared laser light that exert controlled forces on small dielectric particles, such as polystyrene beads, by means of radiation pressure (28). Depending on the geometry of the assay, up to ~30 pN of tension can be applied either to the upstream DNA (Figure 3b) (an assisting load), to the downstream DNA (a hindering load) (12, 33), or to the nascent RNA (Figure 3c) (11). This surface-based assay offers nanometer-scale positional resolution.
Alternately, force can be applied to the bead by means of laminar fluid flow. The distal end of the template DNA is attached to a second bead (rather then the coverglass surface), which is held by a micropipette, so that fluid flow exerts force on the free bead, placing tension on the DNA template (Figure 3d) (30).
In both optical trap-based and fluid-flow assays, the DNA tether is attached to a nominally fixed reference point, i.e., to the coverglass surface or to a micropipette. However, any residual motions of these points can result in significant drift and signal noise. To circumvent such sources of noise, the assay components may be levitated by using an additional optical trap (Figure 3e) (34), thereby decoupling motions of the surface. Such a “dumbbell” assay can achieve single basepair positional resolution, allowing transcription to be followed at the level of individual catalytic turnovers (7, 35).
Rotational motions are produced as RNAP tracks along the helical pitch of DNA. Such rotations can be observed directly by tethering a large bead decorated with smaller fluorescent beads to the TEC (Figure 3f) (27, 29).
The local melting of DNA that occurs during initiation can be detected using magnetic tweezers, which can exert both tension and torque on a DNA template attached to superparamagnetic beads (36). When such a DNA molecule is placed under small amounts of tension and then twisted, large loops (plectonemes) are formed (Figure 3g). The number of plectonemes formed is related to the total amount of excess twist in the DNA. Processes that change the degree of twist, such as melting of the promoter region that occurs during abortive initiation cycles, change the number of plectonemes. This produces a large distance change in the height of the magnetic bead over the coverglass. A mere 1–2 bases of melting induces 5–10 nm changes in the axial bead position, which can be detected by optical techniques.
Together, these diverse single-molecule approaches supply an ample toolbox of techniques, each suited to measuring different aspects of transcription.
INITIATION
Promoter search
The initiation of transcription requires specific binding of the holoenzyme to DNA promoter sequences scattered throughout a vast excess of genomic DNA, a search problem that is common to all sequence-specific DNA-binding proteins. In 1970, LacI was reported to bind to the lac operator site at rates 1000-fold faster than could be explained by random, diffusional encounters with the DNA in three dimensions (37), and an analogous phenomenon has also been reported for RNAP (38). Two independent mechanisms, sliding and intersegment transfer, have been proposed to account for the enhanced binding rates. These mechanisms both serve to reduce the effective dimensionality of the search process, increasing its efficiency by orders of magnitude (39, 40). Sliding results when RNAP associates weakly with non-target DNA, allowing it to diffuse in a one-dimensional random walk until it reaches the target site. Intersegment transfer involves the polymerase crossing from one place on the template to a distant position by means of an intermediate state where the protein is bound simultaneously to DNA containing both segments. Multiple transfer events occur until the promoter site is eventually reached (Figure 4).
Figure 4.

Promoter search and initiation. RNAP holoenzyme (core polymerase in green; σ-factor in purple) is postulated to find promoter target sequences through two mechanisms. Intersegment transfer involves the polymerase loosely binding to a position on the DNA, then making bridging contacts to a second position on the DNA before transferring from one position to the other. The sliding mechanism involves the diffusion of weakly-bound RNAP along the DNA. Once a promoter is found, the holoenzyme binds tightly to the DNA and bends it, forming the closed promoter complex. With the help of σ-factor, a portion of the DNA is melted, exposing bases of the template strand and forming the OPC. Subsequently, during abortive initiation, RNAP repeatedly synthesizes short RNA fragments before eventually clearing the promoter to form a stable TEC, and σ-factor is likely released.
A number of biochemical assays have developed indirect evidence that lends support to the sliding mechanism (41–43). However, only single-molecule experiments permit direct observation of the trajectories of individual RNAP molecules during the promoter-search process, providing a unique window into this phase of initiation. Using a fluorescently labeled antibody for RNAP, Shimamoto and colleagues imaged the motions of holoenzymes along nonspecific sequences of DNA molecules oriented in the presence of laminar fluid flow, and observed stable binding only to specific promoter sites. The fluid flow used in the assay converts what would otherwise be bidirectional Brownian motion of polymerase into largely unidirectional motion that can be observed via fluorescence tracking (Figure 2) (20). In follow-up experiments designed to determine if groove-tracking along the DNA helix occurred concomitant with polymerase sliding, small, fluorescently decorated beads were attached to the DNA, which was then dragged over RNAP holoenzymes immobilized on the surface (Figure 3f). The authors observed small rotational motions of the beads that were consistent with polymerase groove-tracking during linear diffusion along DNA (29).
Using TIRF microscopy (in this case, in the absence of any fluid flow or stage movements that might perturb diffusion), Harada et al. (19) observed the binding and dissociation of Cy3-labeled RNAP from λ DNA molecules that were stretched between twin optical traps. In rare instances, individual RNAP molecules moved randomly along the DNA template over distances greater than 200 nm. These events supplied evidence for RNAP sliding along non-specific DNA. However, based on such events, Harada et al. estimated the linear diffusion coefficient of RNAP to be 104 nm2/s, which is 1–3 orders of magnitude smaller than (model-dependent) values implied by rates of promoter binding measured in solution studies (44). This discrepancy may be attributable to the rarity of measurable events, to the perturbing effects of tension on the system, or to the validity of bulk estimates of diffusion rates. Other estimates of diffusion rates have been obtained using time-resolved AFM to acquire sequential images every 100 seconds for RNAP diffusing along λ DNA. The position of RNAP on the DNA varied from one image to the next, consistent with a random walk in one dimension with a diffusion rate of 101 nm2/s (45, 46), which is again too low to explain bulk search data.
Despite the troubling differences in the estimated diffusion coefficients between single-molecule and bulk experiments, both provide convincing evidence for sliding as a possible mechanism. In addition, time-resolved AFM imaging has provided some support for the intersegment transfer mechanism. A single RNAP molecule was observed contacting two positions along DNA, then transferring from one position to the other. In another image series, RNAP dissociated and rebound at a different template position (45, 46). On a cautionary note, AFM measures molecular interactions in only two dimensions that occur near the surface, leading to the possibility that surface effects may restrict diffusion, or that the reduced dimensionality of the measurement may promote intersegment transfer or rebinding.
Open-complex formation
Upon locating a specific promoter site, RNAP undergoes a structural transition from the closed promoter complex to the OPC (Figure 4). During this transition, RNAP bends and unwinds a local segment of DNA with the help of initiation factors such as σ, forming the transcription bubble. The “housekeeping” factor, σ70, requires no additional factors to unwind a promoter sequence and directs RNAP to recognize the vast majority of promoters in enteric bacteria. AFM images of E. coli RNAP-σ70 OPCs formed at the λPR or λPL promoters show that the DNA is bent between 55–88° (by convention, this angle refers to the deviation from a straight line, not to the included angle of bend) (47, 48). These measurements are consistent with bend angles inferred from gel mobility assays that compared bent A-tract DNA to OPCs (47). RNAP with σ54, a factor that requires NtrC to unwind DNA, was imaged on the glnA promoter DNA in both the presence and absence of the NtrC activator, allowing comparison of closed and open complexes. The closed promoter complex yielded a DNA bend angle of 49 ± 24°, while the open complex bent the template DNA 114 ± 18° (49). Experimental differences in the DNA bend angles produced by OPCs carrying either σ70 and σ54 might be attributable, in principle, to the different sigma factors or to different promoter sequences. A more detailed study of DNA bend angles induced by static OPCs on various promoters might therefore be revealing, and could be complemented by bulk studies comparing the gel mobility of these complexes to A-tract DNA. To observe the dynamics of OPC formation, however, additional single-molecule techniques must be employed.
Single-molecule magnetic tweezers experiments allow the observation of OPC formation in real time (36), a process that produces conformational changes but no RNA transcript, and is therefore difficult to measure in bulk. Strick, Ebright and coworkers (50) created torsionally constrained tethers of DNA, containing either a strong lacCONS promoter or a weaker rrnB P1 promoter, by attaching one end of the DNA template to the coverglass and the other to a magnetic bead. By rotating external magnets, torque was applied to the bead, introducing either positive or negative supercoils into the DNA (Figure 3g). Topology constrains the linking number of the DNA (defined as total number of right-handed plectonemes formed plus the number of right-handed turns of the DNA helix) to remain fixed. For every helical turn of DNA unwound by RNAP during OPC formation, one full positive plectoneme is created (or negative plectoneme destroyed). This change in the number of plectonemes, results in an axial movement (up or down) of the magnetic bead of roughly 50 nm for every 10 bp unwound, depending on the initial tension applied. However, any compaction of the DNA results in an axial reduction in the height of the bead, regardless of the handedness of the supercoils, permitting unwinding signals to be distinguished from compaction. The unwinding of as little as 1 bp and compaction as small as 5 nm can be observed.
Using this sensitive technique, differences in the amplitudes of transitions between positively and negatively supercoiled DNA were used to infer that the opening of the promoter region unwinds 1.2 ± 0.1 turns and compacts (due to wrapping or bending the DNA) 15 ± 5 nm of DNA (50). This unwinding amount is consistent with that inferred by previous biochemical footprinting assays (51), and the level of DNA compaction is consistent with AFM imaging experiments of the λPR promoter (47).
Negative supercoiling of DNA energetically favors melting of the transcription bubble, whereas positive supercoiling makes it less favorable. Consistent with these effects of torque, OPCs were observed to form irreversibly on under-wound DNA carrying the strong lacCONS promoter, whereas over-wound DNA displayed transitions from the closed to open promoter complexes and vice versa. In contrast, on DNA carrying the weak rrnB P1 promoter, reversible transitions were found on negatively supercoiled DNA only, suggesting that strong promoters may be easier to melt than weak promoters. In the presence of initiating nucleotides or the transcription effecter ppGpp, the stability of the OPC was dramatically increased or decreased, respectively (50).
Plectonemes can form in the DNA template only under specific conditions of torque and tension. Because the change in plectoneme number constitutes the signal used for the detection of initiation, torque and tension are interdependent and cannot be varied at will in magnetic tweezer assays. Newer forms of sensitive optical instrumentation are being developed that may permit a wider range of torques and tensions to be explored at high bandwidth (52).
Abortive initiation
After forming the OPC, RNAP begins synthesis of an RNA oligonucleotide complementary to the DNA template strand. Although RNAP forms a highly stable, processive complex during the elongation phase, the initially transcribing complex (ITC) is comparatively unstable, spontaneously releasing short RNA chains and restarting synthesis, a process known as “abortive initiation” (Figure 4). The ability to synthesize many short transcripts coupled with the capacity to reinitiate quickly once a transcript has been aborted implies that the active site of RNAP is able to move forward along DNA while simultaneously maintaining promoter contact. How can this occur?
One model postulates that the RNAP molecule makes transient downstream excursions on the template, briefly breaking its bonds with the promoter, until the short RNA is released, at which point the enzyme diffuses back to the promoter (53) (Figure 5). Such a model is not easily reconciled with bulk footprinting data which suggest that the abortive initiation process results from an inability of RNAP to break its promoter contacts (54–56). These observations led Straney and Crothers to propose that the energy required to break free of the promoter might be somehow stored in a “stressed intermediate,” and that abortive initiation was a consequence of this energy not being used productively (55). One particular instance of this concept, the “inchworming” model, postulates that flexible elements inside RNAP might allow the active center to move forward transiently with respect to the upstream face during synthesis, storing up energy like a stretched spring that retracts upon aborted synthesis (Figure 5).
Figure 5.

Abortive initiation models. The ITC is shown with RNA polymerase in green, DNA in blue, RNA in red, and the enzyme active-site in yellow. Three mechanisms have been proposed to explain abortive initiation. In the transient excursions model (top), RNAP briefly breaks its contacts with the promoter region (horizontal green arrows) and transcribes a short segment of RNA. Upon release of the aborted product, RNAP diffuses back to restart the cycle. In the inchworming model (middle), flexible elements within the enzyme allow the footprint of RNAP to grow as RNA is synthesized, and promoter contacts at the upstream face are maintained (vertical green arrow). Upon release of the abortive RNA, the polymerase relaxes to its normal footprint. In the scrunching model (bottom), RNAP maintains its shape while increasing its effective footprint by pulling in some of the downstream DNA. Abortive loss of the RNA transcript then results in the release of this scrunched DNA, resetting the enzyme.
In a third model, the flexible element that stores the energy ultimately used for promoter escape lies not in RNAP, but in the single-stranded DNA of the transcription bubble and its interactions with the enzyme. In this “scrunching” model, RNAP functions more-or-less as a rigid body. The downstream DNA is pulled progressively into the enzyme with each nucleotide addition cycle, producing a “scrunched” form within the enzyme footprint (Figure 5). Abortive RNA transcripts lead to the release of the scrunched DNA, which is then extruded out the downstream face of RNAP (1, 56–58), only to be reeled in again upon further RNA synthesis.
To distinguish among these three possibilities, single-molecule FRET was used to monitor the relative motions of components of the transcriptional complex during the isomerization from the OPC to the ITC. The following quantities were measured: 1) the distance between the RNAP leading edge and a point on the downstream DNA; 2) the distance between the RNAP trailing edge and a point on the upstream DNA; 3) any expansion or contraction within RNAP itself; and 4) any expansion or contraction between points on the upstream and downstream DNA (6). Freely diffusing complexes were observed by confocal microscopy, using the technique of alternating-laser excitation (ALEX). This dual-laser method facilitates measurements of FRET efficiency selectively for molecules carrying both an active donor and active acceptor dye, eliminating the background of singly-labeled molecules (59, 60). For the lacCONS promoter, distance changes were only observed between FRET pairs located on the RNAP leading edge and the downstream DNA (~7 Å contraction), as well as pairs located on the upstream DNA and downstream DNA (~4 Å contraction), consistent with scrunching of the DNA during abortive initiation (6, 61).
In parallel work, magnetic tweezers were employed to monitor the winding and unwinding of the DNA bubble during initial transcription (Figure 3g). These single-molecule experiments supplied complementary data in support of the scrunching model (5). The scrunching model uniquely predicts that the extent of DNA unwinding should increase proportionally for longer RNA transcripts. Because the formation of plectonemes in pre-twisted DNA makes the axial position of a tethered bead sensitive to small amounts of additional twist, even the unwinding of a single base can be observed. Abortive initiation was halted after varying amounts of transcript had been synthesized by supplying the polymerase with a subset of the four NTPs. For transcript lengths beyond 2 bp, unwinding was observed equivalent to slightly less than the number of bases in the nascent RNA. Furthermore, complexes spent the majority of time in an unwound state, suggesting that abortive product synthesis was fast compared to transcript release, consistent with an independent single-molecule FRET experiment (62). With all four NTPs present, transcription cycles were observed with four distinct transitions: 1) unwinding of the promoter DNA corresponding to the closed-to-open promoter transition; 2) further unwinding, corresponding to the ITC with scrunched DNA; 3) rewinding to a state consistent with a transcription bubble (identical to the size expected for the TEC, with no scrunched DNA); and 4) further rewinding, back to the initial state upon transcription termination (5). These results, coupled with the FRET observations, provide strong evidence that promoter escape involves DNA scrunching during the initial phase of transcription.
Sigma release
To initiate transcription, core RNAP must bind to a dissociable σ-factor, forming the holoenzyme. It had been widely believed that σ-factor was released upon the transition into the TEC (Figure 4), permitting individual RNAP molecules to bind different σ factors during successive rounds of transcription, and thereby to respond quickly to changes in cell cycle or growth conditions (63).
Alternative pictures explain the timing and mechanism of σ release. In the obligate release model, σ dissociation is mechanistically coupled to promoter escape, and occurs as the growing RNA transcript reaches 8 or 9 nt in length, although the exact value may vary with different promoter sequences (55, 64, 65). The stochastic release model proposes instead that the affinity of RNAP for σ decreases as the TEC is formed, so that σ gets released stochastically from the complex after the transition to elongation phase (66).
Recent work has questioned the paradigm that σ is released concomitant with promoter escape, and suggested that a subpopulation of elongation complexes may not release σ70 at all. Such a possibility might facilitate more rapid transcription of genes whose promoters require σ70 (67). Bulk (solution) FRET measurements with dye labels incorporated into σ and DNA showed persistent signals in TECs that had synthesized RNA transcripts up to 50 nt long, although these signals did decay with increasing transcript length (68). However, bulk experiments cannot differentiate between a homogeneous population of complexes with a single lifetime and a heterogeneous population of both long- and short-lived lifetimes, nor can they score possible re-association events.
Single-molecule FRET measurements similar to those performed in bulk confirmed that σ70 is not released obligatorily upon promoter escape. In experiments with freely diffusing complexes, a significant fraction of early TECs (transcript lengths of 11 or 14 nt) were bound to σ-factor. Furthermore, the introduction of a promoter-like sequence in the initially transcribed region significantly increased the half-life of bound σ70 (18). The authors argued that σ-factor remained bound as a consequence of inefficient release upon transition to the elongation phase. However, the experiments with freely diffusing complexes allow for the possibility that σ might be released upon promoter escape but subsequently rebind, for example, at certain promoter-like sequences found in the downstream DNA. Subsequent single-molecule FRET experiments using surface-immobilized TECs permitted measurements with improved time resolution, and ruled out that σ was released or exchanged (62). In addition to showing that early TECs retain σ, the experiments with freely-diffusing elongation complexes also showed that mature TECs (those with transcript lengths of 50 nt) still retained ~50% of σ, with a retention half-life of 50 min (18). This long lifetime hints at the possible existence of a subpopulation of TECs that remain bound to σ70 throughout multiple rounds of transcription. It seems worthwhile to conduct follow-up experiments in the presence of other factors that may modulate rates of σ release, e.g. NusA, competing σ factors, and core RNAP, to determine if such a long half-life is consistent with the cellular milieu.
ELONGATION
The elongation phase of transcription is known to be a highly complex, multi-state process. Conceptually, one can separate the elongation phase into a series of “on-pathway” states associated with DNA-templated RNA synthesis via the nucleotide condensation reaction with PPi release (along with any associated translocations) and various “off-pathway” states that are incompetent for elongation, such as paused or arrested states (Figure 6).
Figure 6.

Transcription elongation pathway and a subset of off-pathway states. RNA polymerase is shown in green, the template strand in light blue, the non-template strand in dark blue, RNA in red, and ρ-factor in yellow. Elongation (central panel; green background) corresponds to the template-directed condensation of NTPs onto the 3′ end of the growing RNA chain. Individual nucleotides may occasionally be excised via pyrophosphorolysis, releasing NMPs and PPi. A number of paused states branch off the central elongation pathway (upper panel; yellow background). An elemental pause state has been proposed as a common intermediate state preceding hairpin-stabilized and backtracking pauses (solid arrows), although both these states might be reached directly from the main elongation pathway (dotted arrows). Misincorporation-induced pauses are triggered when a mismatched NTP (yellow) is added to the RNA chain; backtracking often results in such cases. Two paths lead to transcriptional termination (lower panel; red background). Intrinsic termination occurs when RNAP transcribes specific sequence elements that code for a termination hairpin in the RNA followed by a U-rich tract, triggering dissociation of the TEC. Another termination pathway to termination involves the binding of ρ, which is thought to move along the transcript until reaching RNAP and ultimately dislodge the RNA from the enzyme.
On-pathway elongation
Structure and stability
Once the nascent transcript reaches ~9–11 nt in length, RNAP breaks free of the promoter region and enters the elongation phase. At this point, the TEC becomes highly stable and processive, remaining tightly associated to both the template DNA and nascent RNA throughout (potentially) thousands of cycles of nucleotide addition. The robustness of the TEC is dramatically displayed in single-molecule optical trapping assays that are able to exert extraordinarily large loads (up to 30 pN tension, applied to either the DNA or RNA) without disrupting transcription (11, 12, 69) (figure 3b–e). TEC stability is also supported by the fact that transcriptionally stalled TECs can be prepared in advance and stored for weeks or longer, then re-started during an experiment by the addition of NTPs (70, 71). The primary stabilizing factor of the TEC has been presumed to be base-pairing within the RNA:DNA hybrid (72). However, the forces that can be applied to the nascent RNA without impairing transcription vastly exceed the forces required to unzip or shear apart an 8–9-bp RNA:DNA duplex. A “sliding clamp” model, where extensive protein-nucleic acid contacts within the polymerase contribute significantly to RNA retention has been proposed to explain the overall TEC stability (73). Such a clamp, consisting of a narrow protein channel surrounding the hybrid, would also prevent any significant shearing motions between the RNA and DNA strands under load, because confinement inside a channel would lead to significant steric clashes between bases (11).
Prior to determination of the crystal structure of RNAP (74, 75) and to the elucidation of the paths taken by nucleic acids through the elongating enzyme (73), AFM images of TECs correctly measured the large bend angle between the upstream and downstream DNA, which is close to 90° (48). Longer RNA transcripts could occasionally be visualized in TEC images, as well (76). However, the angles measured between RNA and DNA arms proved to be inconsistent with the currently modeled location of nucleic acids in the crystal structures, perhaps because of confounding surface interactions with the RNA, which is substantially less rigid than DNA, or because of the difficulties inherent in imaging a three-dimensional structure in two dimensions (77).
Step size
During elongation, translocation of the nucleic acid scaffold with respect to the enzyme active site must be coordinated with the nucleotide condensation reaction. Initially, RNAP was postulated to behave as a rigid body, maintaining an invariant footprint as it advanced by one base pair for every nucleotide added to the growing RNA chain (78). However, an “inchworming” model of elongation was subsequently proposed in an attempt to rationalize the apparent differences in the size of the enzyme footprint when complexes were halted at successive template positions (79). During the proposed inchworming motion, a flexible element hypothesized to exist within RNAP allowed upstream and downstream portions of the enzyme to move out of phase, quasi-independently, while simultaneously producing its transcript one nucleotide at a time. The discrepancies in footprint size were eventually re-interpreted as resulting from the backtracking behavior of TECs (80, 81), which were found to slide upstream along the template DNA under certain condition (80–82). The inchworming model consequently fell into disfavor. However, other bulk biochemical experiments have supplied some evidence for the existence of flexible elements within RNAP itself (83–85), and recent single-molecule data obtained during the initiation phase support the notion that the footprint of RNAP may have the capacity to change (6, 61). All this leaves open the question of the actual DNA step-size during elongation.
Single-molecule techniques have successfully measured the nanometer-scale step sizes of many motor proteins (86–90), but the Ångström-scale step sizes expected for nucleic acid-based motors were experimentally inaccessible until recently. The construction of an ultra-stable optical trap with Ångström resolution allowed Block and coworkers to follow individual, actively elongating TECs with unprecedented precision (7, 91). Records of transcriptional elongation obtained under conditions of low nucleotide concentration and moderate loads (2.5–10 μM NTPS; 18 pN assisting force) displayed clear steps of varying duration averaging 3.7 ± 0.6 Å in length, which is nearly the rise per base of double-stranded, B-form DNA (3.4 ± 0.5 Å) (92). Larger steps, consisting of small integral multiples of the fundamental spacing, were also observed. The larger steps were statistically attributable to the temporal resolution of the assay and analysis, which fails to detect brief events below the integration time used for measurement. The observation of single-base stepping is inconsistent with either an obligate scrunching or an inchworming model, and supports the original concept a rigid-body, sliding-clamp mechanism, where RNAP translocates in single base-pair increments that are tightly coupled to nucleotide addition (7).
Kinetics—heterogeneity and state switching
The rates at which genes are transcribed play an important regulatory role by freeing the polymerase molecule to undertake additional rounds of transcription or, conversely, causing it to remain occupied. Single-molecule measurements of elongation dynamics offer insights into such rate-based regulatory mechanisms (93). The very first single-molecule transcription experiments employed the TPM assay (Figure 3a) to measure rates of elongation by E. coli RNAP molecules (32, 70). Measured speeds were generally consistent with the transcription rates reported in bulk studies. Interestingly, however, although the average speeds of individual transcribing molecules did not vary substantially with time, these speeds did vary significantly from molecule to molecule (70). The time resolution of the TPM assay made it difficult to determine if the heterogeneity was due to intrinsic differences in the on-pathway elongation rates of molecules, or to different propensities to enter into off-pathway, paused states. High-resolution optical trapping studies subsequently permitted a more accurate separation of active elongation from pausing in E. coli RNAP (10, 12), as well as measurements of T7 RNAP (9, 94), where pausing is rarely observed. These studies corroborated the original observation of molecular heterogeneity in the overall rates of transcription, and determined that that the variance in molecular rates was largely attributable to “on-pathway” differences in speeds.
Arguably, results from bulk steady-state and pre-steady-state kinetic studies may also be taken as evidence of heterogeneous kinetics (95, 96). However, rather than assuming a molecular population with a distribution of intrinsic elongation rates, the data were interpreted in terms of a model in which members of an otherwise homogeneous population switched between two distinct elongation rates on a time-scale slow compared to nucleotide addition. Whereas regulator binding is known to switch RNAP into different, persistent states (97, 98), the phenomenon of spontaneous switching behavior is disputed (99). One early single-molecule study, which was conducted at comparatively low spatial and temporal resolution, reported that wild-type RNAP can spontaneously switch velocity states (100). However, subsequent studies have failed to confirm any such switching (12, 13, 101), casting doubt on the finding. To date, only one other observation of velocity-state switching has been reported, in this case for an RNAP mutant bearing a point mutation in the β-subunit (but not for the wild type) (13). The mechanistic basis of this particular mutation is unclear, however, as it potentially affects a specific contact with the nascent mRNA that is located more then 20 Å from the enzyme active site.
Careful control experiments performed by Gelles and coworkers have ruled out a number of trivial explanations for the apparent intermolecular heterogeneity, such as the effect of temperature, the solute concentration, and the immobilization technique. This suggests that the source of heterogeneity may be structural in origin, perhaps due to minor defects in RNAP caused by translation errors, post-translational modifications of RNAP, or different conformers in RNAP folding (101). Supporting the structural origin of heterogeneity, the variance in FRET distances between the RNA 5′ end and a labeled base located on the template DNA in a TEC was significantly larger than the corresponding variance in a control sample with the identical dyes placed on a DNA molecule. In individual TECs, these FRET levels persisted for more than 10 min (24). Analogous FRET measurements with active complexes initiated from natural promoters may help to establish whether any such heterogeneity persists during elongation. Simultaneous FRET and elongation-rate measurements (performed with TPM or OT assays) may provide evidence for a correlation between structural and velocity heterogeneity.
Chemomechanics—translocation mechanism and stall
Recent single-molecule work has helped to characterize the molecular mechanism of RNAP translocation. Two different models have been proposed. In the “power stroke” model, a conformational change in the enzyme generates translocation through the direct coupling of displacement to NTP hydrolysis and subsequent PPi release. In the “Brownian ratchet” model, random thermal fluctuations between the pre- and post-translocated states of the enzyme are mechanically rectified by NTP binding and hydrolysis, leading to unidirectional motion. Experimental (80, 102) and theoretical (103, 104) evidence has often been interpreted in terms of a ratchet-like mechanism, although other interpretations certainly cannot be ruled out. The power-stroke model was inspired by crystal structures of T7 RNAP obtained in nominally pre-and post-translocated states. In that model, translocation is tightly coupled to PPi release through a structural change that constitutes the power stroke (105). Optical trapping techniques, where force can be used as a control parameter to modulate stepping rates, are well-suited for differentiating between these particular models because they supply quantitatively different predictions about the relationship between translocation rates and applied loads.
The elongation velocity, v(F) is expected to fit a Boltzmann-type model, which returns a “distance parameter”, δ, representing the effective distance over which an applied force, F, acts to slow translocation (where ΔG = F·δ supplies the associated mechanical energy). For the general case of a Brownian ratchet mechanism, this parameter corresponds to the distance over which the enzyme fluctuates during the stepping cycle between translocation states. For the specific case of an RNAP ratchet, the distance between pre- and post- translocated states subtends exactly one basepair. For a power stroke mechanism, however, the distance parameter corresponds to the displacement of the enzyme in moving from the start of its cycle to a transition state located intermediate between the pre- and post-translocated positions, which is necessarily less than one basepair. In addition to predicting different values for the distance parameter, the Brownian ratchet and power stroke models also predict significant differences in the force dependence of transcriptional velocity over a range of nucleotide concentrations. Because the NTP binding event is coupled to translocation in the ratchet model, velocity becomes most sensitive to applied loads when NTP concentrations are very low, which causes NTP binding to become rate-limiting. In this regime, force acts like a competitive inhibitor to NTP binding. Conversely, in the power-stroke model, NTP binding tends to be decoupled from translocation, because it is separated by one or more biochemical transitions that are very nearly irreversible, such as nucleotide condensation followed by PPi release (where the latter is presumed to be responsible for the power stroke itself). The presence of these intervening biochemical steps therefore tends to make velocities largely independent of load at the lowest NTP concentrations, and most sensitive when concentrations are high. Thus, the Brownian ratchet and power stroke mechanisms have diametrically opposite effects on force-velocity curves as the NTP concentrations are varied.
Accurate measurements of force-velocity relationships for RNAP are made significantly more challenging by the presence of off-pathway events, such as the entry into backtracking and arrested states, which also exhibit a load dependence (34, 100, 106). This complication is evident in the variety of stall forces reported for E. coli RNAP, which range from 14 to 25 pN, depending on how fast load was applied (33, 69). Heterogeneity in the stall force from molecule to molecule has also been observed, suggesting that polymerases may stall at different locations on the DNA template, corresponding to different underlying sequences. Some DNA sequences are known to be prone to enzyme backtracking and arrest, and therefore this variability may be responsible for the different apparent stall forces (12, 69). In addition, a eukaryotic RNAP (yeast Pol II) has been reported to stall at a comparatively low force of 7.5 pN. However, Pol II was observed to elongate successfully against forces significantly beyond this “stall” force for brief periods of time. Furthermore, the apparent stall force was found to doubled with the addition of elongation factor TFIIS (107). All together, the results from prokaryotic and eukaryotic RNAP suggest that stall occurs not when translocation forces are exactly balanced by the application of an external load, but rather when the probability of encountering a backtracking-prone sequence becomes significant, leading to enzyme inactivation. This makes measuring the “true” stall force of RNAP considerably more challenging than for the conventional motor proteins, such as kinesin and myosin, and highly dependent on the method of data collection and its interpretation.
The first measurements of the force-velocity relationships for E. coli and yeast RNAP were obtained by rapidly increasing a hindering load in such a way that RNAP transcribed only a short distance before stalling. Force-velocity characteristics obtained in this fashion were conducted under conditions of saturating NTP concentrations, and the issue of RNAP heterogeneity was addressed by normalizing each record in both force and velocity before ensemble averaging, so that individual records could be combined (12, 69, 107). However, these normalization procedures may have obscured the underlying force-velocity relationships somewhat, making the velocity appear rather insensitive to load until stall was reached, at which point it dropped precipitously with additional force (8). This insensitivity to external load under saturating NTP concentrations implies that force does not significantly affect overall translocation rates until other (off-pathway) processes intervene, such as backtracking or irreversible stall. For saturating nucleotide concentrations, a force-insensitive velocity is broadly consistent with a Brownian ratchet-type model where translocation is coupled to NTP binding, as discussed above.
Recent experiments, however, on T7 RNAP and E. coli RNAP, provide evidence for a greater load-sensitivity in the elongation velocity. For T7 RNAP under conditions of limiting NTP concentrations, hindering loads were found to reduce transcription rates, consistent with the load acting as a competitive inhibitor of NTP binding (9). Velocity was not found to be load-dependent, however, under saturating NTP concentrations. These findings were interpreted in terms of a Brownian ratchet model similar to one first proposed by Guajardo and Sousa (104), where RNAP molecules fluctuate between pre- and post-translocated states until NTP binding locks these into the post-translocated state. In experiments on E. coli RNAP, Block and coworkers (7) used a high-resolution, passive optical force clamp to measure an entire ensemble of force-velocity curves, varying the NTP concentration over more than two orders of magnitude. The improved spatial resolution achieved using this approach allowed potentially confounding backtracking events (which are off-pathway) to be identified in individual records and removed from further analysis, thereby isolating the force dependence of the (on-pathway) translocation events. The ensemble of experimental force-velocity curves were globally fit to a Boltzmann-type relation, which returned a distance parameter of 1 bp. Furthermore, elongation velocity was found to be more sensitive to force at low NTP concentrations (7). A separate experiment conducted by Wang and coworkers (8) also returned a distance parameter of 1 bp. Taken all together, these findings lend support to the notion that RNAP moves by means of a Brownian ratchet mechanism.
The angular motion of RNAP has also been probed using an externally-applied torque (27). Magnetic beads, decorated with small fluorescent beads used to track the relative angular motion of RNAP and DNA (Figure 3f), displayed rotations of ~8.7 ± 3.7 bp/revolution during elongation. The observed rate was within error of the rotational speed expected if RNAP tracked the DNA helix, which has 10.4 bp per turn. In addition, RNAP was observed to stall under external torques greater then 5 pN·nm. Newly-developed technology, such as the optical torque wrench (52), which is capable of exerting both forces and torques in single-molecule experiments, may eventually allow the simultaneous acquisition of torque-velocity and force-velocity curves.
Off-pathway events
Transcriptional pausing
Transcriptional initiation has long been identified as a critical point of regulation, but mechanisms for controlling expression levels during the elongation phase have received comparatively little attention until recently (108). Transcriptional pausing can not only reduce rates of mRNA production, but also recruit regulatory factors to the TEC that modify subsequent transcription (109–112), function as a precursor to transcriptional arrest and termination (113, 114), help to synchronize transcription and translation in prokaryotes (115), or lead to messenger splicing or polyadenylation in eukaryotes (116, 117). The long-lived, “stabilized pauses” that are known to play a regulatory role are often associated with the formation of RNA hairpins in the transcript (which are thought to allosterically inactivate RNAP), or with the formation of energetically weak RNA:DNA hybrids (which are thought to induce backtracking) (118).
High resolution, single-molecule studies of transcriptional pausing complement traditional biochemical studies, helping to overcome some of their intrinsic limitations. Biochemical measurements of pausing typically employ gel-based assays that score the presence or absence of bands generated by RNAs produced by an ensemble of transcribing complexes. To form a sharp band, an initially synchronized population of transcribing molecules must simultaneously encounter a signal on the DNA template and pause there for long enough to be detected. To produce adequate signal levels, the NTP concentrations used in gel-based assays are often reduced to non-physiological levels to slow transcription. Furthermore, once a synchronized population encounters the initial pause location, the stochastic duration of the pause lifetime results in molecules leaving this position over a distribution of times, thereafter desynchronizing the population and reducing the sharpness of all succeeding bands. This de-synchronization makes it difficult to study pausing over significant distances along the DNA template. Single-molecule methods, on the other hand, are not subject to de-synchronization (which is an ensemble property), and they currently allow for the detection of pauses as short as ~1 s and separated by as little as ~2 bp (10) at physiological concentrations of NTPs. In addition, optical trap-based methods allow pausing to be probed as a function of the force applied to the DNA or the RNA. Pausing that involves any longitudinal motion of polymerase along the template or transcript is generally a strong function of the applied load, and therefore such measurements can supply additional insights into mechanism.
Early on, numerous brief transcriptional pauses were noted in records of RNAP transcription obtained using optical traps (69). Such events, which would eventually come to be known as “ubiquitous” pauses, occur even in regions of template DNA previously thought to be devoid of regulatory pauses (based on biochemical assays), such as the E. coli rpoB gene. Approximately 95% of ubiquitous pauses have lifetimes <25 s and occur every ~100 bp, on average, along the template (12, 13). Limitations in the spatial resolution of earlier work made it impossible to determine whether ubiquitous pauses occurred stochastically, independent of the underlying sequence, or were instead triggered in a sequence-dependent fashion by coding elements located at frequent, apparently random intervals. Two recent single-molecule studies succeeded in improving the precision of assays to a point where displacement records could be correlated with the underlying DNA sequences with basepair (or near-basepair) resolution. In brief, these studies relied upon imbedded ‘fiducial marks’ (registration points) that were used to align individual records and supply improved accuracy in the absolute position, based on either the release points of RNAP at the ends of the template (119) or on the transcriptional behavior of RNAP moving on repetitive (concatamer) templates carrying characterized pause sequences (10). Using the latter method, Herbert et. al. determined pause positions within a basepair over nearly 2000 bp of overall transcription, and concluded that ubiquitous pauses were induced by specific, commonly occurring sequences (10).
How, then, do the ubiquitous pauses of single-molecule assays, which are brief and sequence-specific, relate to the longer-lived pauses identified in biochemical assays, many of which are regulatory? Bulk studies found that short-lifetime pauses still persist after RNA hairpin formation or DNA backtracking are suppressed, suggesting that such events may serve to stabilize and thereby prolong pre-existing, but weaker, pauses. This observation led to the proposal that long-lived pauses are preceded by a common, elemental pause that can be further stabilized (97). The existence of an elemental pause (inactivated) state gained additional support from crosslinking studies (120), and it has been invoked to explain the kinetics of misincorporation and nucleotide addition (95, 96, 121). In contrast to stabilized pauses, which involve either large-scale backtracking motions or postulated allosteric modulation of the enzyme by RNA hairpins, an elemental pause likely requires only a very small structural isomerization affecting the active site (97, 118, 120).
Because rates of entry into the presumptive elemental paused state, determined biochemically, are similar to corresponding rates of entry into the ubiquitous pause state, identified in single-molecule experiments, it has been conjectured that ubiquitous pauses represent the elemental pause state (12). Consistent with this hypothesis, ubiquitous pause states lie off the main elongation pathway and are induced by sequences generally similar to those found in biochemically-characterized hairpin and backtracking pauses (10). Furthermore, the duration and frequency of ubiquitous pauses are largely independent of the applied load, implying that such pauses did not involve translocations of polymerase along the RNA or DNA (11, 12). Finally, ubiquitous pauses occurred in single-molecule records where external loads were applied to the transcript sufficient to remove any secondary structure, indicating that RNA hairpin formation was not responsible for such events (11).
In contrast to studies of E. coli RNAP, a recent single-molecule study of transcription in yeast Pol II concluded that ubiquitous pausing in eukaryotic polymerase resulted mainly from backtracking (107). No backtracking at ubiquitous pause sites was actually observed in the single-molecule records from these experiments, however, due to limitations in spatial resolution. Instead, backtracking was inferred by modeling of the pause lifetime distribution, which was fit to a t−3/2 power law. A power-law relationship of this type is expected (at long times) for the first passage time to a barrier by a continuum random-walk process, such as diffusion. Pausing was therefore modeled as inactivation of the enzyme induced by backtracking, followed by diffusional return to an active state, where the 3′ end of the RNA is re-aligned with the active site (107). A backtracking model for pausing is tantalizing, but the pause lifetime distributions acquired for both bacterial and yeast RNAP appear to be complex, and composed of multiple components. For E. coli RNAP, the lifetime distributions of short pause events have been previously been fit by a sum of two exponentials, rather than to a power law (10–12, 34). Longer pause lifetimes, such as those arising from misincorporation events, constitute a third component in the tail of the overall distribution that is sensitive to load (34) (see below). Because individual pauses may have different characteristic lifetimes, pooling all pauses observed on a given template in a global distribution results in a superposition of multiple exponentials, generating a composite curve in which the shortest and longest lifetimes predominate (10). Such a relationship might also give the appearance of a power law. It may therefore be difficult to draw definitive conclusions based solely on models of global lifetime distributions. In any event, considerable attention needs to be paid to details of the analysis procedure and any estimates of error, as well as to alternative models. Assuming that backtracking is responsible for ubiquitous pausing in Pol II, pause lifetimes should be significantly affected by external loads.
One previous study of E. coli RNAP reported load dependence for a particular pause site (ΔtR2) that displayed a significant increase in transcriptional dwell time with increasing (hindering) load, implying backtracking (119). However, because these experiments were conducted at low UTP levels, the possibility remains that the observed load dependence may reflect a force-dependent decrease in elongation rate at this site produced by its U-rich sequence (119). It seems clear that our understanding of backtracking for both the bacterial and eukaryotic forms of polymerases could be improved by the characterization of pausing behavior at specific sites for molecules subjected to various loads. Such studies may place models of pausing mechanisms on firmer ground.
The ability of single-molecule experiments to discern subtle changes in pausing and elongation kinetics has led to a variety of other interesting results. Experiments on rpoB8, a point mutant of E. coli RNAP, showed that it elongates more slowly, and because pausing is an off-pathway state that competes with elongation, it should therefore pause more frequently per unit distance traveled (13). Another study that modulated temperature found that the elongation rate for E. coli RNAP increased by ~1.5 bp/s per °C. However, neither the pause frequency nor the pause lifetime varied with temperature, suggesting that elongation has a large enthalpic contribution, whereas pausing is dominated by an entropy (122). In another study, the effect of microcin J25, an antibiotic known to bind RNAP and decrease overall transcription, was shown not to affect the active elongation rate. Instead, the frequency of pausing was significantly enhanced. These data, taken together with results from crosslinking studies showing that microcin J25 occupies the NTP entry channel, suggest that microcin J25 acts to inhibit transcription by blocking access of NTPs to the active site (123). Finally, using an ultra-stable assay with basepair resolution and scoring the positions of pauses induced by limiting a single NTP species, the DNA sequence of the template was reconstructed from the motions of as few as four RNAP molecules (35).
Proofreading
Two single-molecule studies conducted at comparatively low temporal resolution studied the effects of load on transcription (100, 106). The first such study, restricted to events lasting ~15 s or longer under hindering loads, concluded that the propensity to arrest was force dependent, but not the propensity to pause (100). The second study, which employed both hindering and assisting loads, reported that both pausing and arrest were force dependent (106). Subsequent high-resolution measurements supplied direct evidence for load-induced pausing. In averaged records of long (but not short) pauses, enzymes subjected to moderate hindering loads were found to backtrack (34). The density of pauses lasting 20 s or more (~1 per kilobase), corresponds closely to measured rates of base misincorporation during RNA synthesis in vitro (124), suggesting proofreading as the likely explanation for such events.
The prevailing model for proofreading by RNAP, based on both structural and biochemical data, invokes the backtracking of RNAP along the DNA template in response to a misincorporation event. This backtracking is followed by endonucleolytic cleavage of the 3′ RNA fragment carrying the error, which can be promoted by transcription factors GreA and GreB in prokaryotes, or by TFIIS in eukaryotes (96, 125, 126). Single-molecule experiments provide compelling support for this model, showing that the frequency of long pauses increases in the presence of the nucleotide analog ITP, which mimics misincorporation, and that long pauses lead to enzyme backtracking by an average of ~5 bp. Addition of the transcription factors GreA or GreB can relieve long pauses induced by ITP in single-molecule assays (34). Single-molecule studies complement the biochemical picture developed for proofreading, providing a real-time window into this process during active elongation at saturating nucleotide levels, rather than in stalled complexes under subsaturating conditions that are forced to incorporate an incorrect nucleotide.
Enzyme “memory” and heterogeneity
Single-molecule experiments have shown that transcriptional elongation rates do not tend to change in any systematic way upon recovery from a pause (12, 13). However, the possibility that individual RNAP molecules might retain a kind of “intramolecular memory,” where pausing at an upstream site affects the propensity of RNAP to pause thereafter downstream, remains an open question (99, 127). The binding of transcription regulators such as RfaH, is known to cause RNAP to respond differently to downstream pause signals (109). Could an analogous effect exist in the absence of bound transcription factors, triggered instead by DNA sequence information? Optical trapping experiments on DNA templates containing 8 repeats of the identical sequence allow this and similar questions about molecular “memory” to be examined quantitatively. On repetitive templates, the pause probability at a given sequence site was correlated to pause probabilities at subsequent sites, implying that individual molecules exist in heterogeneous states with greater or lesser propensities to pause. However, the degree of correlation did not decay with the distance between pause sites, suggesting that molecular pause propensities were stable on the timescale of the experiment, and not due to a transient memory effect. The pause correlation analysis was restricted to pause sites that did not display any correlation with elongation velocity, suggesting that the molecular heterogeneity in pause propensity may be due to a different mechanism than the previously-observed heterogeneity in velocity states (10). Further experiments will be required to identify the source of this heterogeneity.
TERMINATION
The TEC is extremely stable, but ultimately RNAP must dissociate accurately in response to termination signals, releasing the transcript and the DNA template. In prokaryotes, intrinsic termination occurs at specific sequence elements that code for a stable hairpin in the nascent RNA followed by a U-rich tract, which together are thought to generate an unstable RNA:DNA hybrid in the enzyme. Termination in prokaryotes also occurs via a different mechanism involving the termination factor ρ, which can translocate along RNA until it encounters the polymerase (114), leading to release of the nascent chain (Figure 6). In general, termination might be produced indirectly through allosteric interactions between the RNA hairpin (or ρ-factor) and RNAP that signal the TEC to release its substrates (128, 129). Alternatively, termination might be produced directly by forces exerted during folding of the terminator hairpin (or by ρ-factor), which push the enzyme forward in the absence of RNA synthesis, so that the hybrid is shortened and the TEC becomes mechanically destabilized (98, 130, 131). Because up to 30 pN of tension can be applied to the RNA without causing the release of a transcript, ρ-factor must exert at least this much force if the latter mechanism is responsible for ρ-based termination. For the case of intrinsic termination, the force generated by a terminator hairpin during folding is not thought to be sufficient to release RNA at most sites along the DNA (11). Therefore, the hybrid- destabilizing effect of the U-rich tract, possibly aided by other mechanisms, such as hairpin stem invasion (73), allostery (128), or forward translocation (131) must play some role in the energetics of intrinsic termination. Future single-molecule experiments should be able to probe these energetics.
Previous biochemical experiments have suggested that termination is an off-pathway state that competes with on-pathway elongation, because the termination efficiency can be increased by slowing the rate of elongation (132). However, controversy arises concerning the pathway involved in intrinsic termination. Some studies conclude that termination is preceded by an intermediate, elongation-incompetent state (133, 134), whereas others find that termination occurs quickly, with no stable intermediate (on a time-scale of seconds) (135). Using TPM (Figure 3a), Gelles and coworkers found that RNAP pauses with a ~1 min characteristic lifetime before releasing DNA at the his terminator. A corresponding pause was not observed for polymerases that read through the terminator or transcribed a template lacking the termination site, suggesting that termination may be irreversibly preceded by an inactivated intermediate state that is committed to termination. In these experiments, the surface immobilization of RNAP is thought to significantly reduce the rate at which DNA can diffuse away from the enzyme, thereby slowing dissociation of the TEC and facilitating the observation of a paused intermediate state (14). This same reduced diffusion rate might, however, also promote nonspecific rebinding to a released DNA template, thereby generating a false signal (135).
In principle, single-molecule fluorescence experiments could be designed to pinpoint if RNA transcripts are released from the TEC before, after, or synchronously with release of the DNA, and if the template or the transcript are both present during the proposed committed intermediate state. Optical trapping experiments where controlled loads are applied to the DNA or RNA during termination should be able to distinguish whether the forward translocation of RNAP is required, and whether forces applied to the RNA are able to dissociate TECs with weak RNA:DNA hybrids.
CONCLUSION
Seventeen years have elapsed since the pioneering single-molecule assay for RNAP transcription was developed by Schafer, Gelles, and Landick (70), and enormous progress has been achieved during this period. Many of the questions that were previously identified as uniquely well-suited to the use of single-molecule methods have already been addressed (3). Single-molecule experiments have shown that RNAP advances by one base at a time along DNA, with translocation tightly coupled to RNA synthesis, and that it likely operates by a Brownian ratchet-type mechanism (7–9). Single-molecule experiments have identified and characterized long-lived heterogeneities in RNAP conformations (24), elongation rates (12, 13, 101), and pause propensities (10). Other single-molecule studies have found that transcriptional initiation involves scrunching of the DNA template until contacts with the promoter are released (5, 6), and supplied evidence for an elongation-incompetent intermediate state preceding transcriptional termination (14). Steady improvements in single-molecule assays have allowed the effects of transcriptional co-factors and effectors to be studied as well, including σ-factor (18), Gre A and GreB (34), ppGpp (50), and microcin J25 (123).
Progress in single-molecule work on transcription has also raised deeper questions and created new avenues of potential research. Results from new assays for eukaryotic polymerases have revealed large differences in mechanical stability between prokaryotic and eukaryotic polymerases, raising intriguing questions with regard to functional differences between these enzymes (107). The advent of basepair resolution in single-molecule assays (7) opens the possibility of probing enzyme reaction rates at individual sequence sites. Advanced techniques, such as multicolor, single-molecule FRET (61), should also make it possible to observe directly the assembly of large macromolecular complexes, such as Mediator, which serves as a co-activator of Pol II transcription, and may ultimately provide insights into the coordination of RNA splicing and transcription. The recent development of assays that exert controlled forces on the nascent RNA (11) will likely be important in eventually establishing the mechanism of transcriptional termination, and also in determining how elongation kinetics can affect the structures of co-transcriptionally folded RNAs. Single-molecule work on RNAP is really motoring along!
SUMMARY POINTS
RNAP can slide along the DNA template to search for promoter sites.
Some fraction of RNAP molecules retain σ-factor upon the transition from the OPC to TEC in vitro.
Transcription initiation involves “scrunching” of the template DNA within the enzyme.
Translocation occurs in single-base increments, consistent with a tight coupling between the length of the RNA transcript and the position of the RNAP on the DNA template.
The force- and nucleotide- dependence of transcription velocity is most consistent with a Brownian ratchet model for translocation.
TFIIS, a eukaryotic transcription accessory factor, modulates the stall force.
“Ubiquitous,” short-lifetime pauses interrupt transcription by E. coli RNAP, even under saturating nucleotide concentrations. Ubiquitous pauses are sequence-dependent and independent of the applied load, and may represent an elemental pause state from which stabilized, regulatory pauses are derived.
Heterogeneity with respect to elongation rates and the propensity to enter the paused state has been observed in populations of molecules.
FUTURE ISSUES
Does σ-factor remain bound to the TEC, even in vivo?
During abortive initiation, where does the “scrunched” DNA reside within RNAP?
Are short-lifetime pauses caused by backtracking, small conformational rearrangements, or something else? Is pausing caused by the same mechanism at all sites? Are these mechanisms the same in both prokaryotes and eukaryotes?
What is responsible for intermolecular heterogeneity, and are changes in the elongation rate correlated to structural changes?
What are the mechanisms by which accessory factors, such as GreA, GreB, NusA, NusG, λQ, N, etc., affect transcription?
How do specific sequence elements in the transcribed DNA sequence affect the rates of next nucleotide addition to RNA?
How does torque affect transcriptional elongation and termination processes?
How is transcriptional termination modulated by force applied to either the DNA template or the RNA transcript?
Sidebar: Force affects translocation
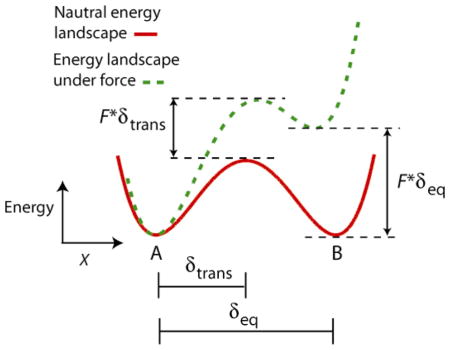
Force biases rates of chemical reactions involving translocation. The graph depicts a notional energy landscape (solid red line) connecting states A (initial) and B (final), with the reaction coordinate, X, corresponding here to displacement along the direction of translocation. In this example, a retarding force, F, tilts the energy landscape by an amount equal to the work performed against the applied load, F*X, producing a changed landscape (dotted green line). The transition state for this reaction is raised by an amount F*δtrans, where δtrans is the distance to the transition state located between A and B. Force also affects the thermodynamic equilibrium between states A and B, raising the relative energy of state B by an amount F*δeq, where δeq is the equilibrium distance between A and B. The capacity to bias both transition-state barriers as well as equilibrium constants of chemical reactions makes force a powerful tool in probing the nature of chemomechanical coupling.
This general reaction picture is readily interpreted in terms of RNAP during its elongation phase. If state A and B are taken to represent pre- and post-translocated states of the TEC, then the reaction diagram above corresponds to a force-dependent translocation mechanism. This same picture can equally well be adapted to represent the force-dependence of pausing or backtracking events, if state B is taken to represent a configuration of RNAP competent for active elongation, while state A is taken to represent a paused or back-tracked state.
Acknowledgments
The authors thank Megan T. Valentine and Kirsten L. Frieda for comments on the manuscript. Funding for our work was provided by the NIGMS.
Acronyms
- RNAP
RNA polymerase
- OPC
open promoter complex
- TEC
transcription elongation complex
- PPi
inorganic pyrophosphate
- AFM
atomic force microscope or atomic force microscopy
- FRET
Förster (fluorescence) resonance energy transfer
- ITC
initially transcribing complex, transcription that occurs before promoter escape
- ALEX
alternating laser excitation
- OT
Optical trap or optical trapping
- TPM
Tethered particle motion
Glossary
- 1. core enzyme
A macromolecular structure comprising the 4 essential subunits of bacterial RNA polymerase, totaling ~400 kD (α2, β, β′), which is competent to carry out transcriptional elongation. Some authors also include the small ω-subunit in this definition
- 2. holoenzyme
A macromolecular structure comprising the core enzyme in addition to σ-factor, required for RNAP binding to a promoter sequence
- 3. abortive initiation
A cycle of transcription initiation and synthesis of short RNA transcripts which are then released, accompanied by the return of the polymerase to the promoter site. The number of abortive initiation cycles varies and depends on many factors, such as the specific promoter sequence
- 4. promoter
A regulatory region of DNA located upstream of a gene in prokaryotes. This region is bound by the RNAP holoenzyme. A strong promoter allows for efficient initiation, while weak promoters are less efficient
- 5. backtracking
The reverse translocation of RNAP (in the upstream direction along the DNA template) while keeping the RNA:DNA hybrid intact. This motion requires the melting of base-pairs at the upstream edge of the transcription bubble and re-annealing at the downstream edge, while the RNA transcript stays in register with the template DNA, leading to the extrusion of the 3′ RNA terminus out the putative nucleotide entry channel
- 6. transcript cleavage factors
Protein-based accessory factors that can bind RNAP and enhance its intrinsic endonucleolytic activity to cleave the RNA transcript. These factors include GreA and GreB in prokaryotes and TFIIS in eukaryotes
- 7. elemental pause
A class of short-lived pause that is believed to be a precursor to longer-lived stabilized pause states. This pause is not thought to involve any translocation of the enzyme relative to the nucleic acid scaffold
- 8. stabilized pause
A class of a long-lived pause resulting from either the formation of a hairpin in the nascent RNA chain, the backtracking of the polymerase induced by a weak RNA:DNA hybrid, or interactions of a transcriptional regulator with a paused TEC
References
- 1.Hsu LM. Biochim Biophys Acta. 2002;1577:191–207. doi: 10.1016/s0167-4781(02)00452-9. [DOI] [PubMed] [Google Scholar]
- 2.Greive SJ, von Hippel PH. Nat Rev Mol Cell Biol. 2005;6:221–32. doi: 10.1038/nrm1588. [DOI] [PubMed] [Google Scholar]
- 3.Gelles J, Landick R. Cell. 1998;93:13–6. doi: 10.1016/s0092-8674(00)81140-x. [DOI] [PubMed] [Google Scholar]
- 4.Nudler E, Gottesman ME. Genes Cells. 2002;7:755–68. doi: 10.1046/j.1365-2443.2002.00563.x. [DOI] [PubMed] [Google Scholar]
- 5.Revyakin A, Liu C, Ebright RH, Strick TR. Science. 2006;314:1139–43. doi: 10.1126/science.1131398. [DOI] [PMC free article] [PubMed] [Google Scholar]
- 6.Kapanidis AN, Margeat E, Ho SO, Kortkhonjia E, Weiss S, Ebright RH. Science. 2006;314:1144–7. doi: 10.1126/science.1131399. [DOI] [PMC free article] [PubMed] [Google Scholar]
- 7.Abbondanzieri EA, Greenleaf WJ, Shaevitz JW, Landick R, Block SM. Nature. 2005;438:460–5. doi: 10.1038/nature04268. [DOI] [PMC free article] [PubMed] [Google Scholar]
- 8.Bai L, Fulbright RM, Wang MD. Phys Rev Lett. 2007;98:068103. doi: 10.1103/PhysRevLett.98.068103. [DOI] [PubMed] [Google Scholar]
- 9.Thomen P, Lopez PJ, Heslot F. Phys Rev Lett. 2005;94:128102. doi: 10.1103/PhysRevLett.94.128102. [DOI] [PubMed] [Google Scholar]
- 10.Herbert KM, La Porta A, Wong BJ, Mooney RA, Neuman KC, et al. Cell. 2006;125:1083–94. doi: 10.1016/j.cell.2006.04.032. [DOI] [PMC free article] [PubMed] [Google Scholar]
- 11.Dalal RV, Larson MH, Neuman KC, Gelles J, Landick R, Block SM. Mol Cell. 2006;23:231–9. doi: 10.1016/j.molcel.2006.06.023. [DOI] [PMC free article] [PubMed] [Google Scholar]
- 12.Neuman KC, Abbondanzieri EA, Landick R, Gelles J, Block SM. Cell. 2003;115:437–47. doi: 10.1016/s0092-8674(03)00845-6. [DOI] [PubMed] [Google Scholar]
- 13.Adelman K, La Porta A, Santangelo TJ, Lis JT, Roberts JW, Wang MD. Proc Natl Acad Sci U S A. 2002;99:13538–43. doi: 10.1073/pnas.212358999. [DOI] [PMC free article] [PubMed] [Google Scholar]
- 14.Yin H, Artsimovitch I, Landick R, Gelles J. Proc Natl Acad Sci U S A. 1999;96:13124–9. doi: 10.1073/pnas.96.23.13124. [DOI] [PMC free article] [PubMed] [Google Scholar]
- 15.Greenleaf WJ, Woodside MT, Block SM. Annu Rev Biophys Biomol Struct. 2007;36:171–90. doi: 10.1146/annurev.biophys.36.101106.101451. [DOI] [PMC free article] [PubMed] [Google Scholar]
- 16.Dame RT, Wyman C, Goosen N. J Microsc. 2003;212:244–53. doi: 10.1111/j.1365-2818.2003.01243.x. [DOI] [PubMed] [Google Scholar]
- 17.Alessandrini A, Facci P. Measurement Science & Technology. 2005;16:R65–R92. [Google Scholar]
- 18.Kapanidis AN, Margeat E, Laurence TA, Doose S, Ho SO, et al. Mol Cell. 2005;20:347–56. doi: 10.1016/j.molcel.2005.10.012. [DOI] [PubMed] [Google Scholar]
- 19.Harada Y, Funatsu T, Murakami K, Nonoyama Y, Ishihama A, Yanagida T. Biophys J. 1999;76:709–15. doi: 10.1016/S0006-3495(99)77237-1. [DOI] [PMC free article] [PubMed] [Google Scholar]
- 20.Kabata H, Kurosawa O, Arai I, Washizu M, Margarson SA, et al. Science. 1993;262:1561–3. doi: 10.1126/science.8248804. [DOI] [PubMed] [Google Scholar]
- 21.Wu T, Schwartz DC. Anal Biochem. 2007;361:31–46. doi: 10.1016/j.ab.2006.10.042. [DOI] [PMC free article] [PubMed] [Google Scholar]
- 22.Kim JH, Larson RG. Nucleic Acids Res. 2007;35:3848–58. doi: 10.1093/nar/gkm332. [DOI] [PMC free article] [PubMed] [Google Scholar]
- 23.Gueroui Z, Place C, Freyssingeas E, Berge B. Proc Natl Acad Sci U S A. 2002;99:6005–10. doi: 10.1073/pnas.092561399. [DOI] [PMC free article] [PubMed] [Google Scholar]
- 24.Coban O, Lamb DC, Zaychikov E, Heumann H, Nienhaus GU. Biophys J. 2006;90:4605–17. doi: 10.1529/biophysj.105.078840. [DOI] [PMC free article] [PubMed] [Google Scholar]
- 25.Mukhopadhyay J, Mekler V, Kortkhonjia E, Kapanidis AN, Ebright YW, Ebright RH. Methods Enzymol. 2003;371:144–59. doi: 10.1016/S0076-6879(03)71010-6. [DOI] [PubMed] [Google Scholar]
- 26.Ha T. Methods. 2001;25:78–86. doi: 10.1006/meth.2001.1217. [DOI] [PubMed] [Google Scholar]
- 27.Harada Y, Ohara O, Takatsuki A, Itoh H, Shimamoto N, Kinosita K., Jr Nature. 2001;409:113–5. doi: 10.1038/35051126. [DOI] [PubMed] [Google Scholar]
- 28.Neuman KC, Block SM. Rev Sci Instrum. 2004;75:2787–809. doi: 10.1063/1.1785844. [DOI] [PMC free article] [PubMed] [Google Scholar]
- 29.Sakata-Sogawa K, Shimamoto N. Proc Natl Acad Sci U S A. 2004;101:14731–5. doi: 10.1073/pnas.0406441101. [DOI] [PMC free article] [PubMed] [Google Scholar]
- 30.Wuite GJ, Davenport RJ, Rappaport A, Bustamante C. Biophys J. 2000;79:1155–67. doi: 10.1016/S0006-3495(00)76369-7. [DOI] [PMC free article] [PubMed] [Google Scholar]
- 31.Gelles J, Schnapp BJ, Sheetz MP. Nature. 1988;331:450–3. doi: 10.1038/331450a0. [DOI] [PubMed] [Google Scholar]
- 32.Yin H, Landick R, Gelles J. Biophys J. 1994;67:2468–78. doi: 10.1016/S0006-3495(94)80735-0. [DOI] [PMC free article] [PubMed] [Google Scholar]
- 33.Yin H, Wang MD, Svoboda K, Landick R, Block SM, Gelles J. Science. 1995;270:1653–7. doi: 10.1126/science.270.5242.1653. [DOI] [PubMed] [Google Scholar]
- 34.Shaevitz JW, Abbondanzieri EA, Landick R, Block SM. Nature. 2003;426:684–7. doi: 10.1038/nature02191. [DOI] [PMC free article] [PubMed] [Google Scholar]
- 35.Greenleaf WJ, Block SM. Science. 2006;313:801. doi: 10.1126/science.1130105. [DOI] [PMC free article] [PubMed] [Google Scholar]
- 36.Revyakin A, Allemand JF, Croquette V, Ebright RH, Strick TR. Methods Enzymol. 2003;370:577–98. doi: 10.1016/S0076-6879(03)70049-4. [DOI] [PubMed] [Google Scholar]
- 37.Riggs AD, Bourgeois S, Cohn M. J Mol Biol. 1970;53:401–17. doi: 10.1016/0022-2836(70)90074-4. [DOI] [PubMed] [Google Scholar]
- 38.Belintsev BN, Zavriev SK, Shemyakin MF. Nucleic Acids Res. 1980;8:1391–404. doi: 10.1093/nar/8.6.1391. [DOI] [PMC free article] [PubMed] [Google Scholar]
- 39.von Hippel PH, Berg OG. J Biol Chem. 1989;264:675–8. [PubMed] [Google Scholar]
- 40.Berg OG, Winter RB, von Hippel PH. Biochemistry. 1981;20:6929–48. doi: 10.1021/bi00527a028. [DOI] [PubMed] [Google Scholar]
- 41.Khoury AM, Lee HJ, Lillis M, Lu P. Biochim Biophys Acta. 1990;1087:55–60. doi: 10.1016/0167-4781(90)90120-q. [DOI] [PubMed] [Google Scholar]
- 42.Singer PT, Wu CW. J Biol Chem. 1988;263:4208–14. [PubMed] [Google Scholar]
- 43.Winter RB, Berg OG, von Hippel PH. Biochemistry. 1981;20:6961–77. doi: 10.1021/bi00527a030. [DOI] [PubMed] [Google Scholar]
- 44.Singer P, Wu CW. Journal of Biological Chemistry. 1987;262:14178–89. [PubMed] [Google Scholar]
- 45.Guthold M, Zhu X, Rivetti C, Yang G, Thomson NH, et al. Biophys J. 1999;77:2284–94. doi: 10.1016/S0006-3495(99)77067-0. [DOI] [PMC free article] [PubMed] [Google Scholar]
- 46.Bustamante C, Guthold M, Zhu X, Yang G. J Biol Chem. 1999;274:16665–8. doi: 10.1074/jbc.274.24.16665. [DOI] [PubMed] [Google Scholar]
- 47.Rivetti C, Guthold M, Bustamante C. Embo J. 1999;18:4464–75. doi: 10.1093/emboj/18.16.4464. [DOI] [PMC free article] [PubMed] [Google Scholar]
- 48.Rees WA, Keller RW, Vesenka JP, Yang G, Bustamante C. Science. 1993;260:1646–9. doi: 10.1126/science.8503010. [DOI] [PubMed] [Google Scholar]
- 49.Rippe K, Guthold M, von Hippel PH, Bustamante C. J Mol Biol. 1997;270:125–38. doi: 10.1006/jmbi.1997.1079. [DOI] [PubMed] [Google Scholar]
- 50.Revyakin A, Ebright RH, Strick TR. Proc Natl Acad Sci U S A. 2004;101:4776–80. doi: 10.1073/pnas.0307241101. [DOI] [PMC free article] [PubMed] [Google Scholar]
- 51.deHaseth PL, Zupancic ML, Record MT., Jr J Bacteriol. 1998;180:3019–25. doi: 10.1128/jb.180.12.3019-3025.1998. [DOI] [PMC free article] [PubMed] [Google Scholar]
- 52.La Porta A, Wang MD. Phys Rev Lett. 2004;92:190801. doi: 10.1103/PhysRevLett.92.190801. [DOI] [PubMed] [Google Scholar]
- 53.Gralla JD, Carpousis AJ, Stefano JE. Biochemistry. 1980;19:5864–9. doi: 10.1021/bi00566a031. [DOI] [PubMed] [Google Scholar]
- 54.Krummel B, Chamberlin MJ. Biochemistry. 1989;28:7829–42. doi: 10.1021/bi00445a045. [DOI] [PubMed] [Google Scholar]
- 55.Straney DC, Crothers DM. J Mol Biol. 1987;193:267–78. doi: 10.1016/0022-2836(87)90218-x. [DOI] [PubMed] [Google Scholar]
- 56.Carpousis AJ, Gralla JD. J Mol Biol. 1985;183:165–77. doi: 10.1016/0022-2836(85)90210-4. [DOI] [PubMed] [Google Scholar]
- 57.Carpousis AJ, Stefano JE, Gralla JD. J Mol Biol. 1982;157:619–33. doi: 10.1016/0022-2836(82)90502-2. [DOI] [PubMed] [Google Scholar]
- 58.Carpousis AJ, Gralla JD. Biochemistry. 1980;19:3245–53. doi: 10.1021/bi00555a023. [DOI] [PubMed] [Google Scholar]
- 59.Kapanidis AN, Laurence TA, Lee NK, Margeat E, Kong XX, Weiss S. Accounts of Chemical Research. 2005;38:523–33. doi: 10.1021/ar0401348. [DOI] [PubMed] [Google Scholar]
- 60.Kapanidis AN, Lee NK, Laurence TA, Doose S, Margeat E, Weiss S. Proc Natl Acad Sci U S A. 2004;101:8936–41. doi: 10.1073/pnas.0401690101. [DOI] [PMC free article] [PubMed] [Google Scholar]
- 61.Lee NK, Kapanidis AN, Koh HR, Korlann Y, Ho SO, et al. Biophys J. 2007;92:303–12. doi: 10.1529/biophysj.106.093211. [DOI] [PMC free article] [PubMed] [Google Scholar]
- 62.Margeat E, Kapanidis AN, Tinnefeld P, Wang Y, Mukhopadhyay J, et al. Biophys J. 2006;90:1419–31. doi: 10.1529/biophysj.105.069252. [DOI] [PMC free article] [PubMed] [Google Scholar]
- 63.Travers AA, Burgess RR. Nature. 1969;222:537–40. doi: 10.1038/222537a0. [DOI] [PubMed] [Google Scholar]
- 64.Korzheva N, Mustaev A, Nudler E, Nikiforov V, Goldfarb A. Cold Spring Harb Symp Quant Biol. 1998;63:337–45. doi: 10.1101/sqb.1998.63.337. [DOI] [PubMed] [Google Scholar]
- 65.Straney DC, Crothers DM. Cell. 1985;43:449–59. doi: 10.1016/0092-8674(85)90175-8. [DOI] [PubMed] [Google Scholar]
- 66.Shimamoto N, Kamigochi T, Utiyama H. J Biol Chem. 1986;261:11859–65. [PubMed] [Google Scholar]
- 67.Bar-Nahum G, Nudler E. Cell. 2001;106:443–51. doi: 10.1016/s0092-8674(01)00461-5. [DOI] [PubMed] [Google Scholar]
- 68.Mukhopadhyay J, Kapanidis AN, Mekler V, Kortkhonjia E, Ebright YW, Ebright RH. Cell. 2001;106:453–63. doi: 10.1016/s0092-8674(01)00464-0. [DOI] [PubMed] [Google Scholar]
- 69.Wang MD, Schnitzer MJ, Yin H, Landick R, Gelles J, Block SM. Science. 1998;282:902–7. doi: 10.1126/science.282.5390.902. [DOI] [PubMed] [Google Scholar]
- 70.Schafer DA, Gelles J, Sheetz MP, Landick R. Nature. 1991;352:444–8. doi: 10.1038/352444a0. [DOI] [PubMed] [Google Scholar]
- 71.Levin JR, Krummel B, Chamberlin MJ. J Mol Biol. 1987;196:85–100. doi: 10.1016/0022-2836(87)90512-2. [DOI] [PubMed] [Google Scholar]
- 72.Wilson KS, Conant CR, von Hippel PH. J Mol Biol. 1999;289:1179–94. doi: 10.1006/jmbi.1999.2814. [DOI] [PubMed] [Google Scholar]
- 73.Korzheva N, Mustaev A, Kozlov M, Malhotra A, Nikiforov V, et al. Science. 2000;289:619–25. doi: 10.1126/science.289.5479.619. [DOI] [PubMed] [Google Scholar]
- 74.Cramer P, Bushnell DA, Kornberg RD. Science. 2001;292:1863–76. doi: 10.1126/science.1059493. [DOI] [PubMed] [Google Scholar]
- 75.Gnatt AL, Cramer P, Fu J, Bushnell DA, Kornberg RD. Science. 2001;292:1876–82. doi: 10.1126/science.1059495. [DOI] [PubMed] [Google Scholar]
- 76.Kasas S, Thomson NH, Smith BL, Hansma HG, Zhu X, et al. Biochemistry. 1997;36:461–8. doi: 10.1021/bi9624402. [DOI] [PubMed] [Google Scholar]
- 77.Rivetti C, Codeluppi S, Dieci G, Bustamante C. J Mol Biol. 2003;326:1413–26. doi: 10.1016/s0022-2836(03)00042-1. [DOI] [PubMed] [Google Scholar]
- 78.Yager TD, von Hippel PH. Biochemistry. 1991;30:1097–118. doi: 10.1021/bi00218a032. [DOI] [PubMed] [Google Scholar]
- 79.Chamberlin MJ. The Harvey Lectures. New York: Wiley-Liss; 1995. pp. 1–21. [Google Scholar]
- 80.Komissarova N, Kashlev M. J Biol Chem. 1997;272:15329–38. doi: 10.1074/jbc.272.24.15329. [DOI] [PubMed] [Google Scholar]
- 81.Komissarova N, Kashlev M. Proc Natl Acad Sci U S A. 1997;94:1755–60. doi: 10.1073/pnas.94.5.1755. [DOI] [PMC free article] [PubMed] [Google Scholar]
- 82.Reeder TC, Hawley DK. Cell. 1996;87:767–77. doi: 10.1016/s0092-8674(00)81395-1. [DOI] [PubMed] [Google Scholar]
- 83.Landick R. Cell. 1997;88:741–4. doi: 10.1016/s0092-8674(00)81919-4. [DOI] [PubMed] [Google Scholar]
- 84.Guerin M, Leng M, Rahmouni AR. Embo J. 1996;15:5397–407. [PMC free article] [PubMed] [Google Scholar]
- 85.Mustaev A, Kashlev M, Zaychikov E, Grachev M, Goldfarb A. J Biol Chem. 1993;268:19185–7. [PubMed] [Google Scholar]
- 86.Mallik R, Carter BC, Lex SA, King SJ, Gross SP. Nature. 2004;427:649–52. doi: 10.1038/nature02293. [DOI] [PubMed] [Google Scholar]
- 87.Finer JT, Simmons RM, Spudich JA. Nature. 1994;368:113–9. doi: 10.1038/368113a0. [DOI] [PubMed] [Google Scholar]
- 88.Sowa Y, Rowe AD, Leake MC, Yakushi T, Homma M, et al. Nature. 2005;437:916–9. doi: 10.1038/nature04003. [DOI] [PubMed] [Google Scholar]
- 89.Noji H, Yasuda R, Yoshida M, Kinosita K. Nature. 1997;386:299–302. doi: 10.1038/386299a0. [DOI] [PubMed] [Google Scholar]
- 90.Svoboda K, Schmidt CF, Schnapp BJ, Block SM. Nature. 1993;365:721–7. doi: 10.1038/365721a0. [DOI] [PubMed] [Google Scholar]
- 91.Greenleaf WJ, Woodside MT, Abbondanzieri EA, Block SM. Phys Rev Lett. 2005;95:208102. doi: 10.1103/PhysRevLett.95.208102. [DOI] [PMC free article] [PubMed] [Google Scholar]
- 92.Watson JD, Crick FH. Nature. 1953;171:737–8. doi: 10.1038/171737a0. [DOI] [PubMed] [Google Scholar]
- 93.Kerppola TK, Kane CM. Faseb J. 1991;5:2833–42. doi: 10.1096/fasebj.5.13.1916107. [DOI] [PubMed] [Google Scholar]
- 94.Skinner GM, Baumann CG, Quinn DM, Molloy JE, Hoggett JG. J Biol Chem. 2004;279:3239–44. doi: 10.1074/jbc.M310471200. [DOI] [PubMed] [Google Scholar]
- 95.Foster JE, Holmes SF, Erie DA. Cell. 2001;106:243–52. doi: 10.1016/s0092-8674(01)00420-2. [DOI] [PubMed] [Google Scholar]
- 96.Erie DA, Hajiseyedjavadi O, Young MC, von Hippel PH. Science. 1993;262:867–73. doi: 10.1126/science.8235608. [DOI] [PubMed] [Google Scholar]
- 97.Artsimovitch I, Landick R. Proc Natl Acad Sci U S A. 2000;97:7090–5. doi: 10.1073/pnas.97.13.7090. [DOI] [PMC free article] [PubMed] [Google Scholar]
- 98.Yarnell WS, Roberts JW. Science. 1999;284:611–5. doi: 10.1126/science.284.5414.611. [DOI] [PubMed] [Google Scholar]
- 99.Pasman Z, von Hippel PH. J Mol Biol. 2002;322:505–19. doi: 10.1016/s0022-2836(02)00814-8. [DOI] [PubMed] [Google Scholar]
- 100.Davenport RJ, Wuite GJ, Landick R, Bustamante C. Science. 2000;287:2497–500. doi: 10.1126/science.287.5462.2497. [DOI] [PubMed] [Google Scholar]
- 101.Tolic-Norrelykke SF, Engh AM, Landick R, Gelles J. J Biol Chem. 2004;279:3292–9. doi: 10.1074/jbc.M310290200. [DOI] [PubMed] [Google Scholar]
- 102.Bar-Nahum G, Epshtein V, Ruckenstein AE, Rafikov R, Mustaev A, Nudler E. Cell. 2005;120:183–93. doi: 10.1016/j.cell.2004.11.045. [DOI] [PubMed] [Google Scholar]
- 103.Bai L, Shundrovsky A, Wang MD. J Mol Biol. 2004;344:335–49. doi: 10.1016/j.jmb.2004.08.107. [DOI] [PubMed] [Google Scholar]
- 104.Guajardo R, Sousa R. J Mol Biol. 1997;265:8–19. doi: 10.1006/jmbi.1996.0707. [DOI] [PubMed] [Google Scholar]
- 105.Yin YW, Steitz TA. Cell. 2004;116:393–404. doi: 10.1016/s0092-8674(04)00120-5. [DOI] [PubMed] [Google Scholar]
- 106.Forde NR, Izhaky D, Woodcock GR, Wuite GJ, Bustamante C. Proc Natl Acad Sci U S A. 2002;99:11682–7. doi: 10.1073/pnas.142417799. [DOI] [PMC free article] [PubMed] [Google Scholar]
- 107.Galburt EA, Grill SW, Wiedmann A, Lubkowska L, Choy J, et al. Nature. 2007;446:820–3. doi: 10.1038/nature05701. [DOI] [PubMed] [Google Scholar]
- 108.Guenther MG, Levine SS, Boyer LA, Jaenisch R, Young RA. Cell. 2007;130:77–88. doi: 10.1016/j.cell.2007.05.042. [DOI] [PMC free article] [PubMed] [Google Scholar]
- 109.Artsimovitch I, Landick R. Cell. 2002;109:193–203. doi: 10.1016/s0092-8674(02)00724-9. [DOI] [PubMed] [Google Scholar]
- 110.Tang H, Liu Y, Madabusi L, Gilmour DS. Mol Cell Biol. 2000;20:2569–80. doi: 10.1128/mcb.20.7.2569-2580.2000. [DOI] [PMC free article] [PubMed] [Google Scholar]
- 111.Palangat M, Meier TI, Keene RG, Landick R. Mol Cell. 1998;1:1033–42. doi: 10.1016/s1097-2765(00)80103-3. [DOI] [PubMed] [Google Scholar]
- 112.Ring BZ, Yarnell WS, Roberts JW. Cell. 1996;86:485–93. doi: 10.1016/s0092-8674(00)80121-x. [DOI] [PubMed] [Google Scholar]
- 113.Kireeva ML, Hancock B, Cremona GH, Walter W, Studitsky VM, Kashlev M. Mol Cell. 2005;18:97–108. doi: 10.1016/j.molcel.2005.02.027. [DOI] [PubMed] [Google Scholar]
- 114.Richardson JP, Greenblatt J. In: Escherichia coli and Salmonella: Cellular and Molecular Biology. Neidhardt F, Curtiss IR, Ingraham JL, Lin ECC, Low KB, et al., editors. Washington, DC: ASM Press; 1996. pp. 822–48. [Google Scholar]
- 115.Landick R, Turnbough CJ, Yanofky C. In: Escherichia coli and Salmonella: Cellular and Molecular Biology. Neidhardt F, Curtiss IR, Ingraham JL, Lin ECC, Low KB, et al., editors. Washington, DC: ASM Press; 1996. pp. 1263–86. [Google Scholar]
- 116.de la Mata M, Alonso CR, Kadener S, Fededa JP, Blaustein M, et al. Mol Cell. 2003;12:525–32. doi: 10.1016/j.molcel.2003.08.001. [DOI] [PubMed] [Google Scholar]
- 117.Yonaha M, Proudfoot NJ. Mol Cell. 1999;3:593–600. doi: 10.1016/s1097-2765(00)80352-4. [DOI] [PubMed] [Google Scholar]
- 118.Landick R. Biochem Soc Trans. 2006;34:1062–6. doi: 10.1042/BST0341062. [DOI] [PubMed] [Google Scholar]
- 119.Shundrovsky A, Santangelo TJ, Roberts JW, Wang MD. Biophys J. 2004;87:3945–53. doi: 10.1529/biophysj.104.044081. [DOI] [PMC free article] [PubMed] [Google Scholar]
- 120.Markovtsov V, Mustaev A, Goldfarb A. Proc Natl Acad Sci U S A. 1996;93:3221–6. doi: 10.1073/pnas.93.8.3221. [DOI] [PMC free article] [PubMed] [Google Scholar]
- 121.Holmes SF, Erie DA. J Biol Chem. 2003;278:35597–608. doi: 10.1074/jbc.M304496200. [DOI] [PubMed] [Google Scholar]
- 122.Abbondanzieri EA, Shaevitz JW, Block SM. Biophys J. 2005;89:L61–3. doi: 10.1529/biophysj.105.074195. [DOI] [PMC free article] [PubMed] [Google Scholar]
- 123.Adelman K, Yuzenkova J, La Porta A, Zenkin N, Lee J, et al. Mol Cell. 2004;14:753–62. doi: 10.1016/j.molcel.2004.05.017. [DOI] [PubMed] [Google Scholar]
- 124.Erie DA, Yager TD, von Hippel PH. Annu Rev Biophys Biomol Struct. 1992;21:379–415. doi: 10.1146/annurev.bb.21.060192.002115. [DOI] [PubMed] [Google Scholar]
- 125.Thomas MJ, Platas AA, Hawley DK. Cell. 1998;93:627–37. doi: 10.1016/s0092-8674(00)81191-5. [DOI] [PubMed] [Google Scholar]
- 126.Jeon C, Agarwal K. Proc Natl Acad Sci U S A. 1996;93:13677–82. doi: 10.1073/pnas.93.24.13677. [DOI] [PMC free article] [PubMed] [Google Scholar]
- 127.Harrington KJ, Laughlin RB, Liang S. Proc Natl Acad Sci U S A. 2001;98:5019–24. doi: 10.1073/pnas.240431598. [DOI] [PMC free article] [PubMed] [Google Scholar]
- 128.Toulokhonov I, Artsimovitch I, Landick R. Science. 2001;292:730–3. doi: 10.1126/science.1057738. [DOI] [PubMed] [Google Scholar]
- 129.Arndt KM, Chamberlin MJ. J Mol Biol. 1990;213:79–108. doi: 10.1016/S0022-2836(05)80123-8. [DOI] [PubMed] [Google Scholar]
- 130.Park JS, Roberts JW. Proc Natl Acad Sci U S A. 2006;103:4870–5. doi: 10.1073/pnas.0600145103. [DOI] [PMC free article] [PubMed] [Google Scholar]
- 131.Santangelo TJ, Roberts JW. Mol Cell. 2004;14:117–26. doi: 10.1016/s1097-2765(04)00154-6. [DOI] [PubMed] [Google Scholar]
- 132.Reynolds R, Bermudez-Cruz RM, Chamberlin MJ. J Mol Biol. 1992;224:31–51. doi: 10.1016/0022-2836(92)90574-4. [DOI] [PubMed] [Google Scholar]
- 133.Gusarov I, Nudler E. Mol Cell. 1999;3:495–504. doi: 10.1016/s1097-2765(00)80477-3. [DOI] [PubMed] [Google Scholar]
- 134.Chan CL, Wang D, Landick R. J Mol Biol. 1997;268:54–68. doi: 10.1006/jmbi.1997.0935. [DOI] [PubMed] [Google Scholar]
- 135.Kashlev M, Komissarova N. J Biol Chem. 2002;277:14501–8. doi: 10.1074/jbc.M200215200. [DOI] [PubMed] [Google Scholar]