

Abstract
Structural and functional studies of membrane proteins are limited by their poor stability outside the native membrane environment. The development of novel methods to efficiently stabilize membrane proteins immediately after purification is important for biophysical studies, and is likely to be critical for studying the more challenging human targets. Lipidic cubic phase (LCP) provides a suitable stabilizing matrix for studying membrane proteins by spectroscopic and other biophysical techniques, including obtaining highly ordered membrane protein crystals for structural studies. We have developed a robust and accurate assay, LCP-Tm, for measuring the thermal stability of membrane proteins embedded in an LCP matrix. In its two implementations, protein denaturation is followed either by a change in the intrinsic protein fluorescence on ligand release, or by an increase in the fluorescence of a thiol-binding reporter dye that measures exposure of cysteines buried in the native structure. Application of the LCP-Tm assay to an engineered human β2-adrenergic receptor and bacteriorhodopsin revealed a number of factors that increased protein stability in LCP. This assay has the potential to guide protein engineering efforts and identify stabilizing conditions that may improve the chances of obtaining high-resolution structures of intrinsically unstable membrane proteins.
Introduction
Membrane proteins are essential cellular components that perform a variety of functions including transport of ions and nutrients, transformation of energy and transduction of signals across the cell membrane. The involvement of membrane proteins in many crucial cellular and physiological processes and their strategic location at the cell surface makes them important pharmaceutical drug targets (∼60% of approved drugs on the market act on membrane proteins) (1). Rational design of new drugs with improved efficacy and selectivity is facilitated by the knowledge of the 3D structure of the target protein at atomic resolution, yet acquiring this information in the case of membrane proteins remains a formidable task. There are only ∼200 nonredundant membrane protein structures out of ∼20,000 total nonredundant structures in the Protein Data Bank, and this disparity is even greater when only human proteins are considered (>2000 nonredundant human protein structures were solved at <3 Å resolution, but only five of these are membrane proteins). The structures of two such membrane proteins, members of the G protein-coupled receptor family (2–4), were obtained using crystals grown in a lipidic cubic phase (LCP) (5).
The success of LCP for growing highly ordered crystals of challenging membrane proteins can be attributed to at least two factors. First, LCP allows the membrane proteins to remain in a more native-like membrane environment throughout crystallization instead of being transiently exposed to a number of physically and chemically distinct environments that are encountered when a protein is solubilized with detergent. Second, crystals grown in LCP have type I packing (see Deisenhofer and Michel (6) for a description of packing in membrane protein crystals) with protein molecules making contacts not only through hydrophilic but also through hydrophobic moieties resulting in lower solvent content and better crystal ordering. By the end of 2009, the LCP crystallization technique yielded high-resolution structures of 12 different membrane proteins contributing 56 total entries to the Protein Data Bank (7) (Table S1 in the Supporting Material).
Crystallization efforts of eukaryotic membrane proteins are plagued by challenges associated with the heterologous expression of functional proteins and by their low intrinsic stability in detergent micelles. Both of these problems likely relate to the more complex nature of biological membranes in higher organisms. The relatively large number of chemically distinct components that make up eukaryotic membranes and their heterogenous distribution in the membrane allows tight control of function and selective stabilization of embedded proteins. For example, cholesterol, an essential component of eukaryotic membranes, was shown to directly modulate the activity of several membrane proteins, such as the oxytocin G protein-coupled receptor (8) and nicotinic acetylcholine receptor (9).
Although it is natural to assume that the lipid bilayer of LCP provides a more stabilizing environment for membrane proteins than detergent micelles, this has neither been convincingly demonstrated nor quantified. A number of techniques have been used to quantify the thermal stability of soluble proteins as well as membrane proteins in detergent solutions, the most successful of which are based on spectroscopic approaches (10–12). Because LCP material is optically transparent when formed under proper conditions, proteins reconstituted in LCP are amenable to spectroscopic measurements. Recently, Lunde et al. (13) showed that the intrinsic fluorescence of bacteriorhodopsin (bR) embedded in LCP increases more than two times after heating the protein to 90°C and cooling it down to room temperature. This increase was attributed to protein denaturation on heating. We have extended these results and developed a robust protocol, LCP-Tm, for comparing the thermal denaturation temperatures of membrane proteins in LCP. Herein we describe the details of the LCP-Tm protocol and report on the stability characteristics of two constructs of an engineered human β2-adrenergic receptor (β2AR) and of the wild-type bR in a variety of conditions.
Materials and Methods
Expression and purification of β2AR constructs
Two engineered human β2-adrenergic receptor constructs were used in this study. The first construct, β2AR, contained a stabilizing mutation E122W (14), C-terminal truncation at residue 348, mutated out glycosylation site N187E (3,15), and deleted residues 245–259 in the third intracellular loop. In addition to all these initial modifications, the second construct, β2AR-T4L, included a replacement of the third intracellular loop residues 231–262 between the transmembrane helices 5 and 6 with cysteine-free T4 lysozyme (C54T, C97A) residues 2–161 (15). Both constructs were expressed in baculovirus infected insect cells (sf9) and purified following published protocols (3). The final protein was in 0.05% w/v n-dodecyl-β-D-maltopyranoside (DDM, Anatrace, Maumee, OH), 0.01% w/v cholesteryl hemisuccinate (CHS; Sigma, St. Louis, MO), 20 mM Hepes pH 7.5, 150 mM NaCl, 0.5 mM ligand. Additional details on expression and purification are provided in the Supporting Material.
Expression and purification of bR
Cultivation of Halobacterium salinarum (strain S9) was carried out as described previously (16,17). Wild-type bR was solubilized with 1.2% w/v n-octyl-β-D-glucoside (OG, Anatrace) using purple membranes isolated from H. salinarum following established protocols (16,18). The concentration of bR was determined by absorbance at 550 nm using the extinction coefficient ɛ550 ∼5.8 × 10⁴ M−1 cm−1 (5). Purified bR was stored at −80°C for up to 6 months until used.
Mixing monoolein with lipid additives
Lipid additives, 1,2-dioleoyl-sn-glycero-3-phosphocholine (DOPC), 1,2-dioleoyl-sn-glycero-3-phosphatidylethanolamine (DOPE), 1,2-dioleoyl-sn-glycero-3-phosphatidylglycerol (DOPG), 1,2-dioleoyl-sn-glycero-3-phosphatidylserine (DOPS), and cholesterol (all lipid additives were from Avanti Polar Lipids, Alabaster, AL), were co-dissolved with monoolein (Nu Chek Prep, Elysian, MN) in chloroform at appropriate molar ratios. The bulk of the solvent was evaporated using a gentle stream of nitrogen gas. The remaining traces of chloroform were removed under a vacuum, 150 mTorr, at room temperature (RT, 21–23°C) for at least 12 h. The dried lipid mixtures were stored at −20°C until used.
Preparation of LCP samples
LCP host lipids, monoolein (MO), monopalmitolein (MP), monovaccenin (MV), and monoeicosenoin (ME) (all lipids were from Nu Chek Prep), were taken from a −20°C freezer, and melted by incubating them for 10 min at RT (MP), 40°C (MV, MO, and mixtures of additive lipids with MO), or 60°C (ME). Molten lipid was cooled down to RT and immediately mixed with a protein solution to form a homogeneous LCP using a syringe mixer (19), as described in Caffrey and Cherezov (20). Final concentrations for all target proteins in the LCP samples were ∼0.5 mg/mL. Protein-free buffer (washing buffer at the last purification step) was used to make control samples for the background correction. To obtain optically clear samples for spectroscopic measurements, sample compositions were selected based on published phase diagrams: 40% w/w hydration for MO (21) and ME (22), 50% w/w hydration for MP (23) and MV (24). Deviations in the actual hydration from the nominal values were within 2% w/w. If any of the additives significantly shifted the hydration boundary (>2% w/w), the sample composition was adjusted accordingly. To estimate the hydration boundary in the presence of additives, the aqueous content was varied by 2% w/w steps in the vicinity of the hydration boundary of the additive-free control until the boundary between the optically clear and hazy samples was determined. For example, the LCP samples containing bR and 1 M Na/K phosphate pH 5.6 were prepared at 35% w/w hydration to account for a reduced LCP hydration capacity induced by the high concentration of salt.
After achieving a homogeneous and transparent LCP sample in the syringe mixer, ∼50 μL of the sample was transferred into a 3-mm quartz cuvette (Hellma USA, Plainview, NY). The top of the cuvette was sealed with a Teflon tape to prevent dehydration at high temperatures. The cuvette was centrifuged at 5600 × g and 20°C for 10 min (Allegra 25 R refrigerated centrifuge with TS-5.1-500 swinging bucket rotor; Beckman Coulter, Fullerton, CA) to remove any defects and air pockets that were introduced during the sample loading.
Ultraviolet-visible absorption spectroscopy
Absorption spectra were recorded with a DU800 spectrophotometer (Beckman Coulter). Data were collected in the 750–250 nm range with 1-nm steps at 1200 nm/min using air as the reference. The absorption spectrum of a protein-free LCP or buffer sample recorded against air was subtracted from the protein-containing sample spectra as appropriate.
Fluorescence spectroscopy
Emission spectra were recorded using a Cary Eclipse fluorescence spectrophotometer (Varian, Walnut Creek, CA). For measuring intrinsic protein fluorescence the excitation wavelength was 280 nm and the emission was scanned between 500 and 300 nm with 1 nm steps at 100 nm/min.
Appropriate inner filter, as well as background corrections were applied to all relevant data following established procedures (25), as described (26,27). Typical maximum absorbance values for the samples in this study were in the 0.5–1 range corresponding to the inner filter correction factors ranging between 1.9 and 3.5.
LCP-Tm protocol
To overcome the problem of clouding LCP samples during temperature ramps, a step-wise heating/cooling protocol was designed. The protocol included 13 data points, starting at RT and ending at 80°C with 5°C increments between points (Fig. 1). LCP samples were prepared and loaded in 3-mm quartz cuvettes as described above. The initial absorbance and intrinsic protein fluorescence spectra were taken immediately after making the samples. At each step samples were incubated at the desired temperature for 7 min in a VWR (West Chester, PA) Digital Heatblock. Temperature increase induced shrinkage of LCP lattice and shedding of water, making samples turbid (Fig. 2). Samples were reset back into a transparent state by centrifugation at 5600 × g and 20°C for 10–15 min (Fig. 2). Absorbance and fluorescence spectra were collected from transparent samples at RT after each incubation/centrifugation cycle, and the process was repeated with the same samples incrementing the incubation temperature by 5°C on each step until the whole data set was collected. Protein-free samples for background correction were prepared at each different condition used in this study. It was verified that both ultraviolet absorbance and fluorescence spectra of these background samples did not change when they were subjected to the same heating/cooling/centrifugation treatment as the protein-containing samples. Therefore, in all subsequent measurements, background data were collected only once at RT and used for correction of data recorded from protein-containing samples at all temperature treatment points.
Figure 1.
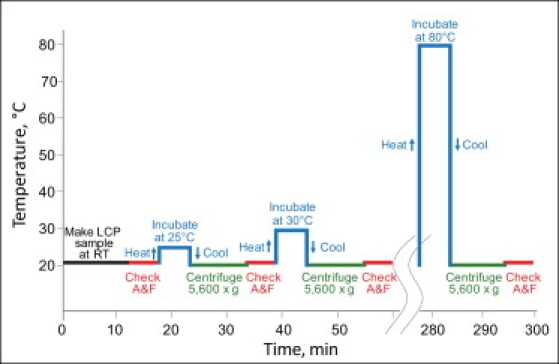
Schematic diagram of the LCP-Tm protocol showing a sequence of temperature treatment steps. After each heating/cooling step samples are centrifuged at 20°C and 5600 × g for 10 min to return the LCP sample to a transparent state. Absorbance and fluorescence spectra are taken for each sample at RT. The whole protocol contains 13 heating/cooling treatment steps, takes ∼300 min and allows for processing of up to six to eight samples simultaneously (A, absorbance; F, fluorescence).
Figure 2.
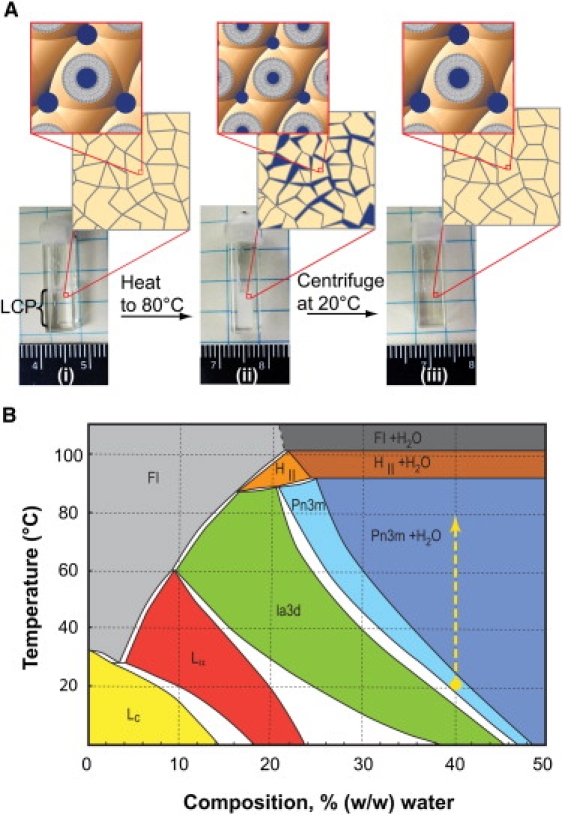
Heat-induced water shedding from the LCP sample. (A) Photographs of a cuvette filled with LCP: (i) after loading; (ii) after heating to 80°C and cooling to RT; and (iii) after 10 min centrifugation at 5,600 × g and 20°C. The first layer of zoom windows shows the domain-like mesoscopic structure of LCP on a scale of ∼100 μm. The second layer of zoom windows depicts the LCP microstructure at a 100 Å scale, showing a cubic lattice formed by a single lipid bilayer. In the initial sample (i) the LCP domains are tightly packed resulting in a homogeneous and transparent appearance. Heating (ii) induces shrinkage of the cubic lattice shedding water into the interdomain space. The water droplets of a few microns in size scatter light impeding spectroscopic measurements (see Fig. S1). Cooling alone does not restore transparency due to a prominent hysteresis in the LCP swelling behavior. A mechanical force such as centrifugation is required to achieve a transparent sample (iii). (B) MO/water temperature-composition phase diagram (re-drawn from Briggs et al. (21)). The phase diagram is metastable at temperatures below 17°C (36). Ia3d and Pn3m represent two bicontinuous cubic phases with different symmetries. Initial samples are prepared at RT and 40% w/w hydration in the cubic-Pn3m phase (yellow dot). Heating brings the samples along the yellow dashed line into a region where the cubic-Pn3m phase and water coexist. The higher the temperature, the more water separates from the LCP.
Using a CPM probe in the LCP-Tm assay
The LCP-Tm assay can also be carried out using a thiol-reactive fluorescent probe 7-diethylamino-3-(4′-maleimidylphenyl)-4-methylcoumarin (CPM) (Invitrogen, Carlsbad, CA), if the protein contains free buried cysteine residues. The CPM probe has very low fluorescence in solution (excitation 387 nm, emission 463 nm) that strongly increases when the probe binds to cysteine. Use of the CPM probe reduces the amount of protein sample required for measurement, typically by an order of magnitude. For this assay, the typical protein concentration was ∼0.015 mg/mL. CPM dye was dissolved in dimethyl formamide at 4 mg/mL and added to the protein solution at the final concentration of 0.007 mg/mL. Introducing a probe into a protein sample, however, is an invasive technique, potentially destabilizing the protein (28). Certain precautions should be taken to reduce the interference between the CPM probe and other components in the sample.
Imidazole was identified as one of the most common components that interacted with CPM resulting in high background signal. The background due to imidazole binding could be reduced by decreasing the concentration of imidazole in the protein samples eluted from the Ni-charged IMAC by de-salting (PD-10, GE HealthCare, Piscataway, NJ). Additionally, we observed that the fluorescence signal from the CPM dye in the protein-free control sample increased after each heating/cooling step of the LCP-Tm assay, possibly due to interactions of the dye with the lipid bilayer. Thus, it was essential to process the control sample with exactly the same thermal treatment as the protein-containing samples and acquire data from the control samples lacking protein at all temperature points.
For liquid samples of proteins in detergent solutions, thermal denaturation data were collected in 1 cm path-length cuvettes by a Cary Eclipse spectrofluorometer temperature ramping function (20–100°C, 1°C/min) as previously described (12).
Isothermal stability assay
An isothermal stability assay was carried out by incubating samples at RT in the dark for 30 days. Fluorescence and absorption spectra were taken daily. Protein stability in LCP was assessed via the intrinsic protein fluorescence signal (F) as described in the LCP-Tm assay protocol. Fraction of the native protein (Rnat) was estimated by assuming that the initial signal (FRT) corresponded to 100% folded protein and the signal after heating the sample to 80°C (F80) corresponded to a completely unfolded protein using the following equation:
| (1) |
For bR, absorbance at 542 nm was used as an additional indicator of protein stability. The amount of correctly folded bR was assumed to be proportional to the absorbance at 542 nm. Fractions of folded bR estimated from the intrinsic fluorescence and from the absorbance at 542 nm agreed within the experimental errors.
Protein samples in detergent solutions were centrifuged in cuvettes at 5600 × g for 15 min before each measurement. We observed some protein aggregation and precipitation over time, correlating with a decrease in the absorption signal at 280 nm. Visual pellet was observed after a few days in the case of β2AR-T4L. To compensate for the loss of protein, the intrinsic protein fluorescence signal was corrected by normalizing it to the absorbance at 280 nm, which is proportional to the concentration of protein in solution. The fraction of folded protein remaining in solution in respect to the total protein was estimated by the increase in the intrinsic fluorescence in a fashion similar to the analysis used in LCP.
Ligand release and binding in LCP
Ligand release experiments were carried out by layering 80 μL buffer (20 mM Hepes pH 7.5, 150 mM NaCl) on top of ∼50 μL LCP sample made of MO and β2AR-T4L/timolol in a 3-mm quartz cuvette. Absorbance and fluorescence spectra of the protein in LCP were taken every hour along with replacement of the top layer of the solution with fresh buffer.
After the fluorescence signal reached equilibrium, corresponding to complete ligand dissociation, ligand binding was initiated by replacing the ligand-free buffer with 80 μL of ligand-containing buffer (20 mM Hepes pH 7.5, 150 mM NaCl, 812.5 μM timolol). The timolol concentration used in the ligand binding experiment was chosen to bring the final concentration of timolol after equilibration back to the original value of 500 μM. Absorbance and fluorescence spectra were collected every hour after ligand addition.
Data analysis
Samples for all experiments were prepared and analyzed at least in triplicate. The protein thermal denaturation data were fit by a Boltzmann sigmoidal function using a GraphPad Prism Software (La Jolla, CA):
| (2) |
where F is the normalized fluorescence, T is the temperature, Fmin and Fmax are fitting parameters describing fluorescence before and after transition, Tm is the transition temperature, and S is the slope factor. Fluorescence signal is expressed in arbitrary units, and both temperature and slope are expressed in °C.
Results
Development of the LCP-Tm protocol
A central issue to the development of spectroscopic methods for measuring the thermal stability of membrane proteins in LCP is shrinkage of LCP and shedding of water induces by heating (Fig. 2 A). This phenomenon results in excess light scattering that hampers the use of spectroscopy under these conditions (Fig. 2 A and Fig. S1). To overcome this problem we designed a step-wise heating/cooling/centrifugation protocol (Fig. 1). At each step the sample is heated to a desired temperature, incubated for 7 min, cooled to 20°C and centrifuged for 10–15 min at 5600 × g. Initially transparent LCP becomes opaque on heating and resets back into a transparent state after cooling and centrifugation (Fig. 2 A), allowing absorbance and fluorescence measurements to be carried out. Starting from 25°C the incubation temperature is increased by 5°C at each step. The process is repeated until a final temperature of 80°C is reached.
The phenomenon of shedding water can be understood by inspecting the MO/water temperature-composition phase diagram (Fig. 2 B) (21). Initially, at RT and 40% w/w hydration, the sample is in a pure cubic-Pn3m phase. On increasing temperature, (Fig. 2 B, dashed yellow line), the sample enters a region where water and the cubic-Pn3m phase coexist, and the sample becomes cloudy. Cooling the sample back to the original temperature alone typically does not restore the transparent state due to a pronounced hysteresis in the LCP swelling behavior; rather a physical force, such as centrifugation, is required to accelerate the equilibration. To ensure that an LCP sample returns back to a transparent state after cooling and centrifugation, it was important to prepare the sample at slightly below the full hydration limit. Lipid or soluble additives can shift the full hydration boundary, making it necessary to adjust the sample composition to maintain the transparency of the LCP sample.
To reduce consumption of lipid and, more importantly, of protein, we used quartz microcuvettes with 3-mm pathlength. These cuvettes hold ∼50 μL of LCP sample, corresponding to ∼10 μg of protein. To prevent sample dehydration at high temperatures the cuvettes were sealed with a Teflon tape. Special holders were made for centrifugation and for mounting these cuvettes into a spectrophotometer and a spectrofluorimeter (20).
Initial experiments were carried out with β2AR-T4L bound to a partial inverse agonist, timolol, in an MO cubic phase at 40% w/w hydration. At each step, intrinsic protein fluorescence was measured using excitation at 280 nm and emission scanned from 500 nm to 300 nm. Absorption spectrum in the 250–750 nm range was also taken to verify that the samples did not scatter light after heating, and to carry out necessary inner filter effect corrections (Fig. S2).
Acquiring a complete denaturation curve by the LCP-Tm protocol takes ∼300 min (Fig. 1). Several samples can be processed in parallel, limited mainly by the number of available cuvettes and slots in the centrifuge, typically six or eight. After the inner filter corrections and background subtraction, measured data points follow a Boltzmann sigmoidal curve, describing a transition between two states (Fig. 3). Curve fitting provides the transition temperature, Tm, and the slope factor, S. This protocol was extensively optimized (see Supporting Material) resulting in typical accuracy and reproducibility of the transition temperatures to be within a few tenths of a degree (see Supporting Material). We have shown that the apparent increase in intrinsic protein fluorescence detected by LCP-Tm is due to irreversible ligand dissociation (see Supporting Material), meaning that the use of intrinsic fluorescence for measuring the thermal stability of proteins in LCP is limited to certain classes of ligand-bound proteins containing tryptophan residues in the vicinity of the bound ligand.
Figure 3.
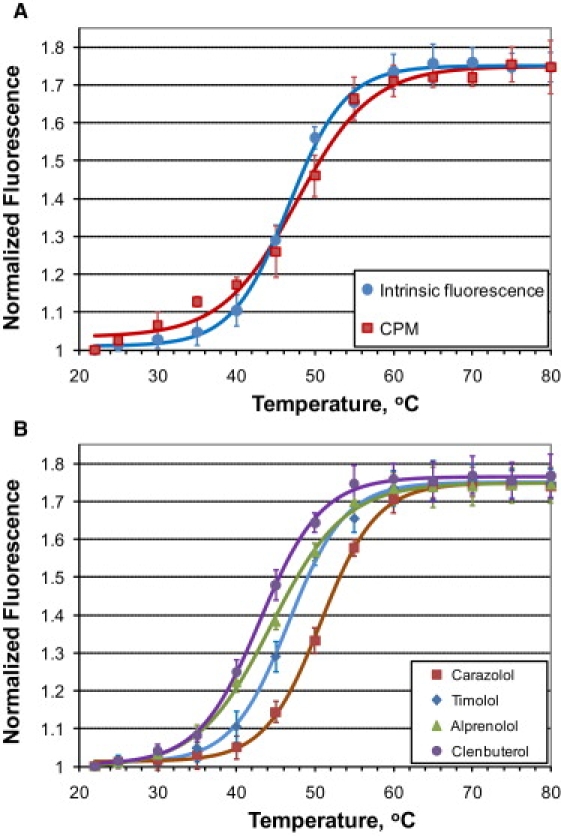
Thermal denaturation curves for β2AR-T4L obtained by the LCP-Tm protocol. (A) Comparison between the intrinsic protein fluorescence and the CPM probe fluorescence for monitoring the unfolding of β2AR-T4L/timolol in the MO cubic phase. (B) Effect of ligands on denaturation of β2AR-T4L in the MO cubic phase. Individual points represent averaged data obtained from at least three samples. Continuous curves represent fits by the Boltzmann sigmoidal function.
LCP-Tm with CPM probe
To extend the LCP-Tm method to a broader range of targets, we used a thiol-sensitive fluorophore, CPM. The CPM probe has been used previously for monitoring unfolding of membrane proteins in detergent solutions (12). It has a low fluorescence that increases dramatically when the probe binds to cysteine. Protein unfolding can be detected when cysteines that are buried in the native protein structure are exposed to solvent on a protein conformational change or on unfolding. We compared thermal denaturation curves for β2AR-T4L/timolol in LCP collected using intrinsic protein fluorescence and the CPM probe (Fig. 3 A, Fig. S3, and Fig. S4). The β2AR-T4L construct contains 11 cysteines, four of which are engaged in forming two disulfide bonds, one cysteine is palmitoylated, one cysteine is capped with iodoacetamide, and the remaining five cysteines are buried in the protein interior (3). The Tm measured using the CPM probe (Tm = 47.3 ± 0.7°C) was within experimental error of the Tm obtained by using intrinsic fluorescence (Tm = 46.4 ± 0.3°C), confirming that the receptor is unfolding in parallel with ligand dissociation.
Effects of environment and protein engineering on stability of β2AR-T4L in LCP
After establishing the parameters of the base condition for β2AR-T4L/timolol in an MO cubic phase, we evaluated the effects of ligands, host LCP lipids, lipid additives, and pH on stability, and correlated these results with the outcomes of crystallization trials. Most of the experiments were carried out using intrinsic fluorescence, unless noted otherwise.
Effect of ligands
The effects of four different β2AR ligands—carazolol (partial inverse agonist), timolol (partial inverse agonist), alprenolol (partial inverse agonist / antagonist) and clenbuterol (partial agonist)—on β2AR-T4L thermal stability were tested by the LCP-Tm assay. The same set of ligands was also used in extensive crystallization trials. Crystals of β2AR-T4L bound to all four ligands were grown in LCP and analyzed for diffraction quality using a 10-μm minibeam at GM/CA CAT at the Advance Photon Source (Argonne, IL) (29). A remarkable correlation was observed between the ligand-induced stability of the receptor, as measured by the LCP-Tm assay (Fig. 3 B, Fig. 4 A, and Table S3), and the diffraction quality of crystals (Table S4). The ligands were ranked by their ability to both improve the thermal stability and increase the crystal resolution limit in the following order: carazolol (Tm = 50.8 ± 0.2°C; resolution = 2.4 Å (2)), timolol (Tm = 46.4 ± 0.3°C; resolution = 2.8 Å (3)), alprenolol (Tm = 44.5 ± 0.2°C; resolution ∼3.5 Å (Fig. S8 A)) and clenbuterol (Tm = 43.0 ± 0.2°C; resolution ∼7 Å (Fig. S8 B)). Thermal stability of the apo-receptor was measured using the CPM probe (Tm = 37.2 ± 0.4°C) and compared to stability of the timolol-bound receptor (Tm = 47.3 ± 0.7°C) obtained under identical conditions in side-by-side experiments. The apo-receptor did not yield crystals under combined optimization screening conditions selected from the conditions used for the successful crystallization trials of the ligand-bound receptor.
Figure 4.
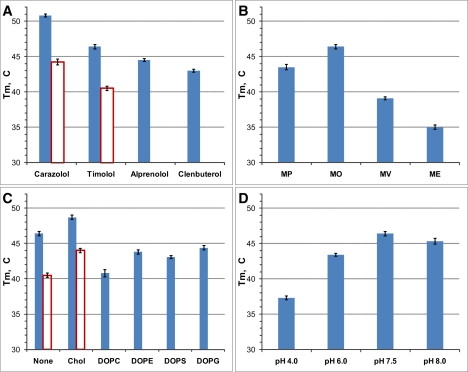
Apparent melting temperatures obtained with the LCP-Tm assay using intrinsic protein fluorescence. (A) Effect of ligands. (B) Effect of LCP host lipids. (C) Effect of lipid additives. (D) Effect of pH. The solid bars represent data for β2AR-T4L and the open bars for β2AR samples. Experiments in B, C, and D were carried out with receptors bound to timolol. The Tm data represent averaged values obtained by curve fitting from at least three samples. The error bars show standard deviation for Tm data.
Effect of lipids
There are several known monoacylglycerols (MAGs) that support formation of LCP at full hydration (30,31). Microstructural parameters of the LCP, such as lipid bilayer thickness and water channel diameter, strongly depend on the identity of the host MAG, and, thus, can affect the stability of the reconstituted proteins. We selected four different MAGs for our studies: monopalmitolein (MP, C16:1c9), monoolein (MO, C18:1c9), monovaccenin (MV, C18:1c11) and monoeicosenoin (ME, C20:1c11). Protein stability, when plotted against the lipid identities arranged in the order of increasing bilayer thickness, followed a bell-shaped curve centered on MO (Fig. 4 B and Table S5), suggesting that the bilayer thickness of MO provides a better match to the hydrophobic thickness of β2AR-T4L.
It has been shown that the MO cubic phase can tolerate supplementation with a variety of native membrane lipids, such as phospholipids, cholesterol, etc. (32). Lipid additives can affect protein stability either through a change in the structural properties of the LCP or through direct lipid/protein interactions. To minimize the effect of added lipids on the structural parameters of LCP, most of the additive lipids were used at a concentration of 5 mol %, except for cholesterol, which was used at 10 mol %. The effects of cholesterol, two zwitterionic phospholipids (DOPC and DOPE) and two anionic phospholipids (DOPS and DOPG) on the thermal stability of β2AR-T4L/timolol in LCP are summarized in Fig. 4 C, Fig. S9 B, and Table S3. Cholesterol was the only lipid that stabilized β2AR-T4L in LCP, increasing Tm by 2.3°C. The most destabilizing lipid was DOPC, decreasing Tm by 5.6°C. The rest of the lipid additives were mildly destabilizing, lowering Tm by 2–3°C. Cholesterol was also the best additive lipid for crystallization, substantially improving the crystal size and shape (2,3). The stabilizing effect of cholesterol in LCP is likely due to direct interactions with the protein, which is consistent with the identification of two bound cholesterol molecules in the β2AR-T4L crystal structure (3). The addition of DOPE also increased the β2AR-T4L crystal size, despite a slightly destabilizing effect observed by LCP-Tm. The increase in crystal size, however, was mostly in one dimension and did not improve the diffraction quality. The addition of DOPC almost completely abolished crystal growth, in agreement with the destabilizing effect of this lipid on β2AR-T4L in LCP. The last two lipids (DOPS and DOPG) were not used in crystallization trials.
Effect of pH
The effect of pH was rather straightforward, showing diminished stability of β2AR-T4L/timolol in a MO-based LCP at lower pH levels (Fig. 4 D, Fig. S9 C, and Table S3). This result is consistent with a decrease in the ligand binding activity of β2AR at pH values below 7.0 (33). Crystals of β2AR-T4L were obtained in a pH range from 6.5 to 8.0. The best diffraction quality crystals were grown at pH 6.5–7.0. Outside of this range crystals were small or irregularly shaped and were not suitable for x-ray diffraction experiments. At pH values >8.0 the LCP becomes unstable due to the increased rate of MO transesterification and hydrolysis (34); therefore, stability and crystallization experiments were not carried out at higher pH values.
Effect of T4 lysozyme fusion
Lysozyme from T4 phage (T4L) was initially fused in place of the third intracellular loop of β2AR to improve the proteolytic stability of the protein and to facilitate crystallization (15). We evaluated the effect of the T4L fusion on the thermal stability of β2AR in LCP via the LCP-Tm assay using two protein constructs that differed only by the presence or absence of the T4L fusion. The stability of both constructs was measured in the timolol and carazolol bound states (Fig. 4 A), and, for timolol-bound proteins, in the presence and absence of cholesterol (Fig. 4 C). In all of these cases, the T4L fusion increased the Tm by 5–6°C, confirming a substantial stabilizing effect of this fusion partner on the receptor. The stabilizing effect of the T4L domain is likely due to reduced conformational flexibility of the intracellular interface between the transmembrane helices 5 and 6 (2,3).
Effect of mesophase
During the course of in meso crystallization, LCP can transform to or transiently pass through different lipidic mesophases (35). We have tried to mimic such situations and to estimate the impact of passing through various mesophases on protein stability.
Below 17°C the MO-based LCP is metastable and can flip into a lamellar crystalline phase (Lc) characterized by crystal-like packing of the lipid molecules (36). An LCP sample with β2AR-T4L/timolol was prepared at RT, cooled to 4°C, and incubated for 10 min. Transition to the Lc phase was confirmed visually by an apparent opaqueness and by characteristic birefringency detected using polarized light microscopy (20). The sample was warmed up to RT and incubated for 20 min to return it to the LCP. LCP-Tm measurements showed that the total increase in fluorescence dropped to ∼35% (compared to ∼75% in a control sample) and Tm decreased to 42.8 ± 0.4°C (Fig. S10 and Table S3). Because the total increase in fluorescence is proportional to the amount of folded receptor bound to the ligand, we concluded that transient passage through the Lc phase damaged more than half of the protein and destabilized the rest.
Transient formation of an inverse hexagonal HII phase was induced by mixing LCP with 2 M sodium sulfate at RT (37,38). Formation of a birefringent phase was confirmed by polarized light microscopy. After a 10 min incubation, the salt concentration was decreased to <0.2 M using two washes in a syringe lipid mixer (19) with more than three times excess buffer solution. This treatment destroyed ∼40% of protein and decreased Tm of the remaining protein to 44.4 ± 0.4°C (Fig. S10 and Table S3). In contrast, similar treatment with 1 M sodium sulfate, which kept the LCP intact, did not affect protein stability.
Finally, a lamellar liquid crystalline phase (Lα) was achieved by either preparing samples at low hydration (15% w/w, Fig. 2 B), incubating for 10 min and increasing hydration to 40% w/w to convert the sample to the LCP, or by using 40% hydration with high concentration of DDM (4.1% w/v), incubating for 10 min and adding 1 M sodium sulfate to convert the sample back into the LCP (39). All manipulations were carried out using a syringe lipid mixer (19) as described in Caffrey and Cherezov (20). Although the amount of folded receptor decreased by ∼20% after the low hydration treatment, the transient formation of the Lα phase induced by detergent did not appreciably affect either the amount of folded receptor or its stability (Fig. S10 and Table S3).
Therefore, we conclude that formation of the Lc or HII phase during crystallization trials is highly detrimental to the protein and should be avoided as much as possible. However, a transient passage through the Lα phase can likely be tolerated. These results are consistent with previous observations from in meso crystallization trials with bR (39). An excess of detergent may originally induce formation of the Lα phase, which converts into a cubic phase on addition of a precipitant. Such phase transitions typically do not prevent subsequent crystal growth.
LCP provides a better stabilizing environment for membrane proteins than detergent micelles at RT
Whereas the LCP-Tm protocol is a fast and quantitative method for measuring protein stability in LCP that allows comparison of different protein constructs and conditions, it does not give clear evidence on long-term protein stability and it does not allow comparison of protein stability in different environments, such as detergent micelles and LCP. To obtain this information we carried out isothermal denaturation experiments, comparing stability of β2AR-T4L/timolol and bR in both MO-based LCP and detergent solutions. Samples were incubated at RT, and the state of the proteins was assessed by intrinsic fluorescence and UV-Vis absorbance daily for 30 days (Figs. S11–S18 in the Supporting Material).
As expected, the β2AR-T4L/timolol sample in DDM/CHS solution was the least stable, losing ∼50% of the active protein within a week and completely denaturing after 20 days (Fig. 5). Reconstitution of β2AR-T4L/timolol in the MO-based LCP greatly improved its stability, retaining ∼70% of the active protein after 30 days. Consistently, bR samples in OG solution were moderately unstable, whereas reconstitution in LCP increased the stability to about the same level as β2AR-T4L/timolol. The increase in bR stability in LCP was, however, not as dramatic as for β2AR-T4L, which is consistent with observations of distorted retinal spectrum for bR in MO LCP reported by Lunde et al. (13). On the other hand, it has been known that under crystallization conditions bR is stable in LCP for months. Indeed, the addition of 1 M Na/K phosphate pH 5.6 (bR crystallizes at >2 M Na/K phosphate pH 5.6) substantially increased bR stability bringing the level of properly folded protein to 80% after 30 days. Assuming a linear dependence of protein stability on the salt concentration, we would expect >90% viability of bR in LCP at crystallization conditions after 30 days. This pronounced effect of salt on bR stability in the isothermal experiments translated well into the LCP-Tm measurements. Addition of 1 M Na/K phosphate pH 5.6 increased the Tm of bR in LCP from 43.8 ± 0.6°C to 50.7 ± 0.4°C (Fig. S9 F and Table S3).
Figure 5.
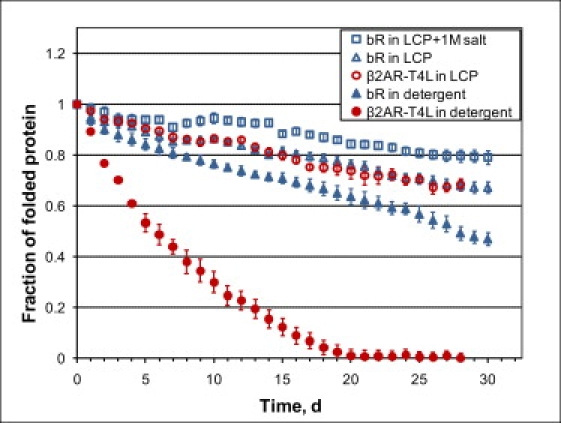
Comparisons of stability of bR and β2AR-T4L/timolol in detergent (open symbols) and LCP (solid symbols) environments at RT. Fractions of folded proteins were estimated using absorbance and fluorescence as described in the Materials and Methods. The original raw data are shown in Figs. S11–S18 in the Supporting Material. bR was prepared in 1.2% w/v OG, 25 mM Na/K phosphate pH 5.6, and β2AR-T4L was prepared in 0.05% w/v DDM, 0.01% w/v CHS, 20 mM Hepes pH 7.5, 150 mM NaCl, 0.5 mM timolol.
Discussion
Measuring the thermodynamic stability of membrane proteins in a membrane environment is not a straightforward task due to the difficulties associated with establishing equilibrium, reversible transition conditions, and the concomitant effects of denaturants on the properties of the lipid mesophases. For example, the thickness of lipid membranes in a physiologically relevant lamellar liquid crystalline phase shrinks with increasing temperature (40). This shrinkage can denature the protein through a hydrophobic mismatch (41). Properties of detergent micelles also depend on temperature, but in a different way (42). In the case of LCP, heating induces shrinkage of the water channel diameter along with thinning of the lipid bilayer, increasing the membrane curvature, which can also affect the protein stability (21). These effects preclude the direct comparisons of denaturation temperatures obtained in different environments. For example, Tm measured by LCP-Tm for β2AR-T4L/timolol is 46.4 ± 0.3°C, whereas measured by the CPM probe in DDM/CHS solution is 66.1 ± 1.2°C (Fig. S19). On the other hand, using the isothermal measurements we have shown that the same protein was substantially more stable in LCP than in detergent solution at RT (Fig. 5). Thus, meaningful comparisons of denaturation temperatures for membrane proteins can only be obtained when the proteins are analyzed in similar environments.
We believe the LCP-Tm protocol introduced in this work provides a robust and accurate method for comparing the stability of membrane proteins in LCP at a variety of conditions. In one of its implementations, the method uses an increase in the intrinsic protein fluorescence on heating to assess denaturation of the protein. We have shown that this increase is associated with an irreversible release of the ligand coupled with the protein unfolding. Therefore, one of the requirements for applying the intrinsic protein fluorescence for detection of protein denaturation in LCP is the presence of both a bound ligand and tryptophans, preferably near the ligand binding site. A large group of integral membrane proteins that satisfies these criteria is the superfamily of G protein-coupled receptors (GPCRs). Most GPCRs contain a highly conserved tryptophan residue, often referred to as a toggle switch (43), near where most of the small molecule ligands are believed to bind. Therefore, for most GPCRs bound to ligands, the intrinsic fluorescence is expected to change on temperature-induced protein unfolding. It is possible that not all combinations of ligands and tryptophan-containing proteins will work, therefore for any new protein and/or ligand it is imperative to verify the intrinsic fluorescence response by heating to 80°C before starting to use the LCP-Tm protocol. Alternatively, for proteins lacking ligands or tryptophans but containing buried cysteines, the CPM probe can be used to monitor protein unfolding. A simple analysis of all unique membrane proteins of known structure in the Protein Data Bank indicates that >60% of proteins contain buried cysteine residues (12). For proteins that do not fit in either of these two categories, a tryptophan or cysteine residue could be engineered, if stability data are crucial for the success of the project.
One has to be careful with the interpretation of LCP-Tm data. Similar to the temperature effect, most salts and other kosmotropes, as well as some nonlamellar phase forming lipids, can decrease the lattice parameter of LCP, increase membrane curvature and change the membrane thickness (32,38). In contrast, the addition of chaotropes, certain polymers such as PEG 400, detergents, or lamellar phase forming lipids can induce swelling of the cubic phase and decrease the membrane curvature (32,37,44). Some of these additives can transform LCP into another phase or change the phase transition temperature. All of these effects should be taken into account when the experiments are planned and conducted. If carried out under controlled conditions, however, LCP-Tm measurements are very accurate and sensitive to factors affecting protein stability. They can be extremely helpful in guiding protein engineering efforts and selecting the most stabilizing host lipids and lipid additives, as well as for studying specific lipid-protein interactions.
We observed a remarkable correlation between the stabilizing effect of ligands on β2AR-T4L and the quality of obtained crystals. Additionally, the LCP host lipid, MO, and the lipid additive, cholesterol, used in obtaining high-resolution crystals of β2AR-T4L provided the most stabilizing lipid matrix for this protein. In the case of bR, we found that salt used to induce crystallization substantially stabilized the protein in LCP. There are debates in the literature regarding the existence of a correlation between protein stability and its ability to crystallize. Positive correlations were found between the stabilizing effect of additives and their effect on promoting crystallization in several studies (11,45). On the other hand, a recent comprehensive analysis of 117 proteins suggested no correlation between denaturation temperatures and the propensities of proteins to crystallize (46). We should note that most if not all of such studies were carried out with soluble proteins. Our experiments were carried out on a relatively small scale reflecting a scarcity of available crystal forms of selected membrane protein targets. This analysis will be expanded to better understand the relationship between the stability of proteins in LCP and their crystallization propensities. We anticipate that for the human membrane proteins, and especially such intrinsically flexible molecules as GPCRs, increasing stability is the key toward obtaining high-resolution structures.
Supporting Material
Supplemental methods, supplemental results, 19 figures, and five tables are available at http://www.biophysj.org/biophysj/supplemental/S0006-3495(09)06148-7.
Supporting Material
Acknowledgments
The authors acknowledge E. Chien, K. Allin, and T. Trinh for the help with protein expression, and A. Walker and A. Pia Abola for assistance with the manuscript preparation.
This work was supported by the National Institutes of Health Roadmap Initiative (P50 GM073197).
References
- 1.Yildirim M.A., Goh K.I., Vidal M. Drug-target network. Nat. Biotechnol. 2007;25:1119–1126. doi: 10.1038/nbt1338. [DOI] [PubMed] [Google Scholar]
- 2.Cherezov V., Rosenbaum D.M., Stevens R.C. High-resolution crystal structure of an engineered human β2-adrenergic G protein-coupled receptor. Science. 2007;318:1258–1265. doi: 10.1126/science.1150577. [DOI] [PMC free article] [PubMed] [Google Scholar]
- 3.Hanson M.A., Cherezov V., Stevens R.C. A specific cholesterol binding site is established by the 2.8 A structure of the human β2-adrenergic receptor. Structure. 2008;16:897–905. doi: 10.1016/j.str.2008.05.001. [DOI] [PMC free article] [PubMed] [Google Scholar]
- 4.Jaakola V.P., Griffith M.T., Stevens R.C. The 2.6 angstrom crystal structure of a human A2A adenosine receptor bound to an antagonist. Science. 2008;322:1211–1217. doi: 10.1126/science.1164772. [DOI] [PMC free article] [PubMed] [Google Scholar]
- 5.Landau E.M., Rosenbusch J.P. Lipidic cubic phases: a novel concept for the crystallization of membrane proteins. Proc. Natl. Acad. Sci. USA. 1996;93:14532–14535. doi: 10.1073/pnas.93.25.14532. [DOI] [PMC free article] [PubMed] [Google Scholar]
- 6.Deisenhofer J., Michel H. Nobel lecture. The photosynthetic reaction centre from the purple bacterium Rhodopseudomonas viridis. EMBO J. 1989;8:2149–2170. doi: 10.1002/j.1460-2075.1989.tb08338.x. [DOI] [PMC free article] [PubMed] [Google Scholar]
- 7.Raman P., Cherezov V., Caffrey M. The Membrane Protein Data Bank. Cell. Mol. Life Sci. 2005;63:36–51. doi: 10.1007/s00018-005-5350-6. [DOI] [PMC free article] [PubMed] [Google Scholar]
- 8.Gimpl G., Burger K., Fahrenholz F. Cholesterol as modulator of receptor function. Biochemistry. 1997;36:10959–10974. doi: 10.1021/bi963138w. [DOI] [PubMed] [Google Scholar]
- 9.Addona G.H., Sandermann H., Miller K.W. Where does cholesterol act during activation of the nicotinic acetylcholine receptor? Biochim. Biophys. Acta. 1998;1370:299–309. doi: 10.1016/s0005-2736(97)00280-0. [DOI] [PubMed] [Google Scholar]
- 10.Pantoliano M.W., Petrella E.C., Salemme F.R. High-density miniaturized thermal shift assays as a general strategy for drug discovery. J. Biomol. Screen. 2001;6:429–440. doi: 10.1177/108705710100600609. [DOI] [PubMed] [Google Scholar]
- 11.Ericsson U.B., Hallberg B.M., Nordlund P. Thermofluor-based high-throughput stability optimization of proteins for structural studies. Anal. Biochem. 2006;357:289–298. doi: 10.1016/j.ab.2006.07.027. [DOI] [PubMed] [Google Scholar]
- 12.Alexandrov A.I., Mileni M., Stevens R.C. Microscale fluorescent thermal stability assay for membrane proteins. Structure. 2008;16:351–359. doi: 10.1016/j.str.2008.02.004. [DOI] [PubMed] [Google Scholar]
- 13.Lunde C.S., Rouhani S., Glaeser R.M. Membrane-protein stability in a phospholipid-based crystallization medium. J. Struct. Biol. 2006;154:223–231. doi: 10.1016/j.jsb.2006.02.002. [DOI] [PubMed] [Google Scholar]
- 14.Roth C.B., Hanson M.A., Stevens R.C. Stabilization of the human β2-adrenergic receptor TM4-TM3-TM5 helix interface by mutagenesis of Glu122(3.41), a critical residue in GPCR structure. J. Mol. Biol. 2008;376:1305–1319. doi: 10.1016/j.jmb.2007.12.028. [DOI] [PMC free article] [PubMed] [Google Scholar]
- 15.Rosenbaum D.M., Cherezov V., Kobilka B.K. GPCR engineering yields high-resolution structural insights into β2-adrenergic receptor function. Science. 2007;318:1266–1273. doi: 10.1126/science.1150609. [DOI] [PubMed] [Google Scholar]
- 16.Gordeliy V.I., Schlesinger R., Heberle J. Crystallization in lipidic cubic phases: a case study with bacteriorhodopsin. Methods Mol. Biol. 2003;228:305–316. doi: 10.1385/1-59259-400-X:305. [DOI] [PubMed] [Google Scholar]
- 17.Oesterhelt D., Stoeckenius W. Isolation of the cell membrane of Halobacterium halobium and its fractionation into red and purple membrane. Methods Enzymol. 1974;31(Pt A):667–678. doi: 10.1016/0076-6879(74)31072-5. [DOI] [PubMed] [Google Scholar]
- 18.Nollert P. Lipidic cubic phases as matrices for membrane protein crystallization. Methods. 2004;34:348–353. doi: 10.1016/j.ymeth.2004.03.030. [DOI] [PMC free article] [PubMed] [Google Scholar]
- 19.Cheng A., Hummel B., Caffrey M. A simple mechanical mixer for small viscous lipid-containing samples. Chem. Phys. Lipids. 1998;95:11–21. doi: 10.1016/s0009-3084(98)00060-7. [DOI] [PubMed] [Google Scholar]
- 20.Caffrey M., Cherezov V. Crystallizing membrane proteins using lipidic mesophases. Nat. Protoc. 2009;4:706–731. doi: 10.1038/nprot.2009.31. [DOI] [PMC free article] [PubMed] [Google Scholar]
- 21.Briggs J., Chung H., Caffrey M. The temperature-composition phase diagram and mesophase structure characterization of the monoolein/water system. J. Phys. II. 1996;6:723–751. [Google Scholar]
- 22.Qiu, H. 1998. The mesophase behavior of the monoacylglycerol/water system: application in drug delivery. PhD thesis. The Ohio State University, Columbus, OH.
- 23.Briggs, J. 1994. The phase behavior of hydrated monoacylglycerols and the design of an x-ray compatible scanning calorimeter. PhD thesis. The Ohio State University, Columbus, OH.
- 24.Qiu H., Caffrey M. Lyotropic and thermotropic phase behavior of hydrated monoacylglycerols: structure characterization of monovaccenin. J. Phys. Chem. B. 1998;102:4819–4829. [Google Scholar]
- 25.Lakowicz J.R. Plenum Press; New York, NY: 1983. Instrumentation of Fluorescence Spectroscopy. [Google Scholar]
- 26.Liu W., Caffrey M. Gramicidin structure and disposition in highly curved membranes. J. Struct. Biol. 2005;150:23–40. doi: 10.1016/j.jsb.2004.12.007. [DOI] [PubMed] [Google Scholar]
- 27.Liu W., Caffrey M. Interactions of tryptophan, tryptophan peptides, and tryptophan alkyl esters at curved membrane interfaces. Biochemistry. 2006;45:11713–11726. doi: 10.1021/bi0608414. [DOI] [PMC free article] [PubMed] [Google Scholar]
- 28.Smoot A.L., Panda M., Brazil B.T., Buckle A.M., Fersht A.R. The binding of bis-ANS to the isolated GroEL apical domain fragment induces the formation of a folding intermediate with increased hydrophobic surface not observed in tetradecameric GroEL. Biochemistry. 2001;40:4484–4492. doi: 10.1021/bi001822b. [DOI] [PubMed] [Google Scholar]
- 29.Cherezov V., Hanson M.A., Stevens R.C. Rastering strategy for screening and centering of microcrystal samples of human membrane proteins with a sub-10 microm size x-ray synchrotron beam. J. R. Soc. Interface. 2009;6(Suppl 5):S587–S597. doi: 10.1098/rsif.2009.0142.focus. [DOI] [PMC free article] [PubMed] [Google Scholar]
- 30.Misquitta Y., Cherezov V., Caffrey M. Rational design of lipid for membrane protein crystallization. J. Struct. Biol. 2004;148:169–175. doi: 10.1016/j.jsb.2004.06.008. [DOI] [PubMed] [Google Scholar]
- 31.Caffrey M. Crystallizing membrane proteins for structure determination: use of lipidic mesophases. Annu. Rev. Biophys. 2009;38:29–51. doi: 10.1146/annurev.biophys.050708.133655. [DOI] [PubMed] [Google Scholar]
- 32.Cherezov V., Clogston J., Caffrey M. Membrane protein crystallization in meso: lipid type-tailoring of the cubic phase. Biophys. J. 2002;83:3393–3407. doi: 10.1016/S0006-3495(02)75339-3. [DOI] [PMC free article] [PubMed] [Google Scholar]
- 33.Ghanouni P., Schambye H., Kobilka B.K. The effect of pH on β(2) adrenoceptor function. Evidence for protonation-dependent activation. J. Biol. Chem. 2000;275:3121–3127. doi: 10.1074/jbc.275.5.3121. [DOI] [PubMed] [Google Scholar]
- 34.Murgia S., Caboi F., Nylander T. Acyl migration and hydrolysis in monoolein-based systems. Progr. Colloid Polym. Sci. 2002;120:41–46. [Google Scholar]
- 35.Caffrey M. On the mechanism of membrane protein crystallization in lipidic mesophases. Cryst. Growth Des. 2008;8:4244–4254. doi: 10.1021/cg101384p. [DOI] [PMC free article] [PubMed] [Google Scholar]
- 36.Qiu H., Caffrey M. The phase diagram of the monoolein/water system: metastability and equilibrium aspects. Biomaterials. 2000;21:223–234. doi: 10.1016/s0142-9612(99)00126-x. [DOI] [PubMed] [Google Scholar]
- 37.Cherezov V., Fersi H., Caffrey M. Crystallization screens: compatibility with the lipidic cubic phase for in meso crystallization of membrane proteins. Biophys. J. 2001;81:225–242. doi: 10.1016/S0006-3495(01)75694-9. [DOI] [PMC free article] [PubMed] [Google Scholar]
- 38.Vargas R., Mateu L., Romero A. The effect of increasing concentrations of precipitating salts used to crystallize proteins on the structure of the lipidic Q224 cubic phase. Chem. Phys. Lipids. 2004;127:103–111. doi: 10.1016/j.chemphyslip.2003.09.006. [DOI] [PubMed] [Google Scholar]
- 39.Misquitta Y., Caffrey M. Detergents destabilize the cubic phase of monoolein: implications for membrane protein crystallization. Biophys. J. 2003;85:3084–3096. doi: 10.1016/S0006-3495(03)74727-4. [DOI] [PMC free article] [PubMed] [Google Scholar]
- 40.Gordeliy V.I., Cherezov V., Teixeira J. Strength of thermal undulations of phospholipid membranes. Phys. Rev. E Stat. Nonlin. Soft Matter Phys. 2005;72:061913. doi: 10.1103/PhysRevE.72.061913. [DOI] [PubMed] [Google Scholar]
- 41.Killian J.A. Hydrophobic mismatch between proteins and lipids in membranes. Biochim. Biophys. Acta. 1998;1376:401–415. doi: 10.1016/s0304-4157(98)00017-3. [DOI] [PubMed] [Google Scholar]
- 42.Balmbra R.R., Clunie J.S., Goodman J.F. Effect of temperature on the micelle size of a homogeneous non-ionic detergent. Trans. Faraday Soc. 1962;58:1661–1667. [Google Scholar]
- 43.Schwartz T.W., Frimurer T.M., Elling C.E. Molecular mechanism of 7TM receptor activation—a global toggle switch model. Annu. Rev. Pharmacol. Toxicol. 2006;46:481–519. doi: 10.1146/annurev.pharmtox.46.120604.141218. [DOI] [PubMed] [Google Scholar]
- 44.Cherezov V., Clogston J., Caffrey M. Room to move: crystallizing membrane proteins in swollen lipidic mesophases. J. Mol. Biol. 2006;357:1605–1618. doi: 10.1016/j.jmb.2006.01.049. [DOI] [PubMed] [Google Scholar]
- 45.Vedadi M., Niesen F.H., Edwards A.M. Chemical screening methods to identify ligands that promote protein stability, protein crystallization, and structure determination. Proc. Natl. Acad. Sci. USA. 2006;103:15835–15840. doi: 10.1073/pnas.0605224103. [DOI] [PMC free article] [PubMed] [Google Scholar]
- 46.Price W.N., Chen Y., Hunt J.F. Understanding the physical properties that control protein crystallization by analysis of large-scale experimental data. Nat. Biotechnol. 2009;27:51–57. doi: 10.1038/nbt.1514. [DOI] [PMC free article] [PubMed] [Google Scholar]
Associated Data
This section collects any data citations, data availability statements, or supplementary materials included in this article.