Abstract
Ceramide is an important lipid signaling molecule that plays critical roles in regulating cell behavior. Ceramide synthesis is surprisingly complex and is orchestrated by six mammalian ceramide synthases, each of which produces ceramides with restricted acyl chain lengths. We have generated a CerS2 null mouse and characterized the changes in the long chain base and sphingolipid composition of livers from these mice. Ceramide and downstream sphingolipids were devoid of very long (C22–C24) acyl chains, consistent with the substrate specificity of CerS2 toward acyl-CoAs. Unexpectedly, C16-ceramide levels were elevated, and as a result, total ceramide levels were unaltered; however, C16-ceramide synthesis in vitro was not increased. Levels of sphinganine were also significantly elevated, by up to 50-fold, reminiscent of the effect of the ceramide synthase inhibitor, fumonisin B1. With the exceptions of glucosylceramide synthase and neutral sphingomyelinase 2, none of the other enzymes tested in either the sphingolipid biosynthetic or degradative pathways were significantly changed. Total glycerophospholipid and cholesterol levels were unaltered, although there was a marked elevation in C18:1 and C18:2 fatty acids in phosphatidylethanolamine, concomitant with a reduction in C18:0 and C20:4 fatty acids. Finally, differences were observed in the biophysical properties of lipid extracts isolated from liver microsomes, with membranes from CerS2 null mice displaying higher membrane fluidity and showing morphological changes. Together, these results demonstrate novel modes of cross-talk and regulation between the various branches of lipid metabolic pathways upon inhibition of very long acyl chain ceramide synthesis.
Keywords: Enzymes/Lipid, Lipid/Physical Chemistry, Lipid/Sphingolipid, Lipid/Sphingolipids, Lipid/Synthesis, Membrane/Lipids, Ceramide, Ceramide Synthesis
Introduction
Biological membranes contain thousands of different lipid species that can be broadly classified according to their backbone structure (1). Of these, sphingolipids (SL)2 have become particularly prominent due to the discovery of their unexpected structural complexity and their intricate modes of cellular trafficking and metabolism (2–4). Ceramides are perhaps the most well studied class of SLs, because of their essential roles in differentiation and in apoptosis (5–7).
Ceramides can differ in both their long chain sphingoid base (8) and fatty acid composition (9). Over the past few years, a complex mode of regulation of ceramide synthesis has been described, with each of the six mammalian ceramide synthase (CerS) (formerly known as Lass (longevity assurance)) genes generating ceramides with specific acyl chain lengths (10). Thus, CerS1 uses mostly C18-CoA (11); CerS4 uses C18- and C20-CoAs (12); CerS5 and CerS6 use mostly C16-CoA (12, 13); and CerS3 uses very long chain acyl-CoAs (C26 and higher) (14). CerS2 can utilize a wider range of fatty acyl-CoAs but uses mainly C22 to C24. In addition, CerS2 displays complex modes of regulation and has genomic features characteristic of a “housekeeping” gene, although no other CerS genes display these characteristics (15).
We have now generated a CerS2 null mouse and have systematically dissected the changes in SL levels in the livers of these mice during the first 4 months of their development. These analyses extend the recent study by Imgrund et al. (16), inasmuch as we provide data on the changes in SL levels during mouse development. Our study also measures changes in levels of sphingoid long chain bases and is consistent with the idea that the dramatic pathological changes that occur in the liver of these mice (17) are likely due to a combination of changes in the acyl chain composition of SLs as well as changes in long chain base (predominantly sphinganine) levels. Finally, we have analyzed the activity of a number of enzymes of SL metabolism, including neutral sphingomyelinase 2 (N-SMase 2), whose levels are significantly elevated, and we have also analyzed changes in the biophysical properties of microsomal lipids. Significant and unexpected changes are observed that together suggest complex modes of interaction between components of the SL metabolic pathway.
EXPERIMENTAL PROCEDURES
Materials
d-Erythro-[4,5-3H]sphinganine (80 Ci/mmol) was synthesized as described previously (18). Fatty acyl-CoAs, ceramides, C6-NBD-sphingomyelin (SM), C6-NBD-glucosylceramide (GlcCer), C12-NBD-ceramide, C6-NBD-ceramide, 1,2-dioleoyl-sn-glycero-3-phosphoethanolamine-N-(lissamine rhodamine B sulfonyl) (Rho), and the internal standards for liquid chromatography electrospray ionization-tandem mass spectrometry (ESI-MS/MS) were purchased from Avanti Polar Lipids (Alabaster, AL). Sphinganine was from Matreya (Pleasant Gap, PA). Silica gel 60 TLC plates were from Merck. A protease inhibitor mixture was from Sigma. 1,6-Diphenyl-1,3,5-hexatriene (DPH) and trans-parinaric acid (t-PnA) were from Molecular Probes (Leiden, The Netherlands). Dulbecco's modified Eagle's medium was from Invitrogen or Sigma. All solvents were of analytical grade and were purchased from Biolab (Jerusalem, Israel).
Mice
All mice were maintained under pathogen-free conditions and handled according to protocols approved by the Weizmann Institute Animal Care Committee as per international guidelines.
PCR Methods and Primers for Genotyping Mice
Genotyping was performed by PCR using primers that detect the wild type CerS2 (CerS2+) and the gene-trapped CerS2 (CerS2GT) alleles in one reaction, using a mixture of three primers as follows: forward (264), 5′-GTAGTGCTCTCCATCATG-3′; forward (564), 5′-CAGACACAGATAAGTTGC-3′; reverse (432), 5′-CATACAAGGTCTGGAGC-3′. PCR cycles were 95 °C for 3 min (95 °C for 30 s, 57 °C for 30 s, and 72 °C for 1.5 min) for 35 cycles and 72 °C for 3 min. TaqDNA polymerase master mix (Amplicon) was used. A 1537-bp band was detected for the CerS2+ allele and a 1258-bp band for the CerS2GT allele (see supplemental “Experimental Procedures”). For full-length reverse transcription-PCR analysis of CerS2, the following primers were used: forward (314), 5′-GATGCTCCAGACCTTGTATGAC-3′; reverse (590), 5′-TTGTTATTGAGGATGGGGTG-3′. PCR cycles were as above. Further details are given in the supplemental material.
Lipid Biochemistry
CerS activity was assayed using [3H]sphinganine and acyl-CoAs of different chain lengths (15, 19) using 150 μg of protein. Neutral sphingomyelinase (SMase) activity was assayed using C6-NBD-SM (20), and other enzymes were measured according to the following protocols: SM synthase using C6-NBD-ceramide (20); acid, alkaline, and neutral ceramidases using C12-NBD-ceramide (21); GlcCer synthase using C6-NBD-ceramide (22); acid SMase using C6-NBD-SM (20); glucosylceramidase using C6-NBD-ceramide (23).
CerS mRNA Expression
cDNA was synthesized and determined by quantitative PCR using TaqManTM analysis and a 7300 sequence detection system (15). The following primers were used: CerS2 sense, 5′-GGCGCTAGAAGTGGGAAAC-3′; antisense, 5′-TCGAATGACGAGAAAGAGCA-3′. For CerS4, -5, and -6, and for TATA-binding protein, which was used as an endogenous control, see Ref. 15.
Lipid Analysis
SL analyses by ESI-MS/MS were conducted using a PE-Sciex API 3000 triple quadrupole mass spectrometer and an ABI 4000 quadrupole-linear ion trap mass spectrometer (12, 15, 24, 25), as were acyl-CoA levels (26). Glycerophospholipids and cholesterol were measured by nano-ESI-MS/MS (27, 28). All data are expressed per dry weight. Total cholesterol was measured by ferric chloride (29).
Neutral SMase Expression
N-SMase 1 and -2 mRNA expression was measured by reverse transcription-PCR using the following primers: N-SMase 2 forward, 5′-GAGCAGCTACACGGCTACTTC-3′, and N-Smase 2 reverse, 5′-GAGACCGTTTGTGTCCAGCAG-3′ to yield a 546-bp DNA fragment; N-SMase 1 forward, 5′-CAATCTCAACTGCTG-3′, and N-Smase 1 reverse, 5′-GAGTCACGTAGGCATTGAG-3′ to yield a 371-bp DNA fragment. Hypoxanthine-guanine phosphoribosyltransferase 1 primers were as follows: forward, 5′-TCCAACACTTCGAGAGGTCC-3′, and reverse, 5′-GGGGGCTATAAGTTCTTTGC-3′.
Membrane Biophysics and Morphology
The biophysical properties of membranes were examined after preparing lipid vesicles (∼0.3 mm phospholipid in phosphate-buffered saline) (30) from microsomal lipid extracts (31). During vesicle preparation, all the samples were re-equilibrated by freeze-thaw cycles. For studies with t-PnA and DPH, the samples were slowly brought to room temperature, and the probe was added from an ethanol stock solution. The samples were again re-equilibrated by freeze-thaw cycles and subsequently kept overnight at 4 °C. Before measurements, the samples were slowly brought to room temperature and maintained at this temperature at least for 1 h. Fluorescence anisotropy was measured (10 measurements for each analysis) in a FluoroLog®-3 fluorimeter (Horiba Jobin-Yvon, Edison, NJ) using t-PnA, Rho, or DPH (at final probe concentrations of 0.7, 0.5, and 0.8 μm, respectively). All measurements were performed in 0.5 × 0.5 cm quartz cuvettes under magnetic stirring. The excitation (λex)/emission (λem) wavelengths were 320/405 nm for t-PnA, 358/430 nm for DPH, and 570/593 nm for Rho.
Membrane morphology was studied by fluorescence microscopy using a Leica TCS SP5 (Leica Microsystems CMS GmbH, Mannheim, Germany) inverted microscope (DMI6000) with a 63× water (1.2 numerical aperture) apochromatic objective. Giant unilamellar vesicles were prepared by electroformation (32) using microsomal lipid extracts. Rho was used at a probe to lipid ratio of 1:500.
Protein Phosphatase 2A
Protein phosphatase 2A activity was measured as described previously (33, 34).
Statistics
All data are shown as means ± S.E. (unless indicated). p values were calculated using two independent samples of a one-tailed Student's t test. A p value <0.05 was considered statistically significant.
RESULTS
A CerS2 null mouse was generated from embryonic stem cells harboring a gene trap (GT) retroviral vector insertion in the first intron of the CerS2 gene (Fig. 1A) (35). Intercrossing CerS2GT/+ mice (F1 of 129S4/SvJae × C57BL/6) resulted in generation of F2 CerS2GT/GT (CerS2 null) mice (Fig. 1B), which were born with normal Mendelian inheritance ratios but weighed ∼20–30% less than wild type (WT) mice (Fig. 1C). CerS2 null mice do not normally survive beyond ∼16 months, although occasionally mice survived as long as 20 months (17).
FIGURE 1.
Generation and characterization of CerS2 null mice. A, CerS2 null mice were created by crossing CerS2GT/+ mice generated from a gene trap embryonic stem cell line (stock number 013236-UCD, Mutant Mouse Regional Resource Center). The upper panel shows the Rosafary gene trap retroviral vector used to generate CerS2 gene trap embryonic stem cells (35). A splice acceptor (SA) is located upstream to a β-geo gene (neo resistance + lacZ genes), which is followed by a polyadenylation sequence (pA). A selectable marker for hygromycin (hyg) resistance is expressed under the phosphoglycerate kinase (PGK) promoter, followed by a splice donor (SD) sequence, which is within two frt sites that are recognized by Flp recombinase. Elements of this vector are marked as gray boxes. The vector was inserted between exons 1 and 2 of the CerS2 gene (dashed lines). Exons are marked as black boxes, and translational start and stop sites are shown as arrows. A spliced transcript of the WT locus is also shown. The lower panel shows the integration of the retroviral vector into the CerS2 gene, leading to generation of two transcripts. Transcript 1 is generated by splicing exon 1 of CerS2 (5′-untranslated region) into the Rosafary splice acceptor, resulting in expression of lacZ under the CerS2 promoter. The second transcript is driven by the PGK promoter of the hygromycin gene, which is spliced into the second exon of CerS2. B, CerS2 null mice do not express full-length transcript 2, demonstrated using primers that amplify the full-length CerS2 transcript. C, weight of CerS2 null mice. *, p < 0.01; n = 5.
CerS2 Null Mice Display Changes in the Acyl Chain Composition of SLs
Analysis of ceramide synthesis in homogenates from mouse liver (which contains high levels of CerS2 mRNA (15)) demonstrated that synthesis of ceramides containing very long acyl chains (C22–C24) was reduced by ∼95% in CerS2 null mice (Fig. 2), as predicted from the acyl chain specificity of CerS2 (15). The small residual amounts of C22–C24-ceramide synthesis may be due to the sensitivity of the assay or due to the reverse activity of ceramidase; alternatively, other CerS (i.e. CerS3 and CerS4) may be able to synthesize small amounts of C22–C24-ceramides, although the data largely support the functional nonredundancy of CerS2 with respect to acyl chain lengths.
FIGURE 2.

Ceramide synthesis in CerS2 null mouse liver. The synthesis of C22- or C24-ceramides is highly reduced in the CerS2 null mouse; the inset shows C16-ceramide synthesis, which is unchanged. *, p < 0.05; n = 3.
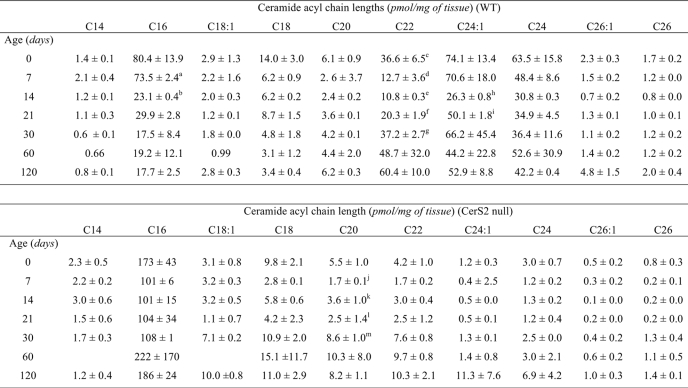
ESI-MS/MS analysis of the changes in SL levels versus development of the CerS2 null mouse corroborated that CerS2 null mouse liver contained only trace amounts of very long acyl chain ceramides compared with WT (Fig. 3 and Table 1) and significantly reduced levels of long acyl chain SM and HexCer (supplemental Tables 1 and 2) at all stages of mouse development. Thus, levels of C22-, C24:0-, and C24:1-SLs were reduced by 10–100-fold in the CerS2 null mouse, but no significant reduction was seen in C20-SLs. Levels of C26:1- and C26:0-SLs were relatively low in the WT, and only a small reduction was observed in their levels in the CerS2 null mouse.
FIGURE 3.
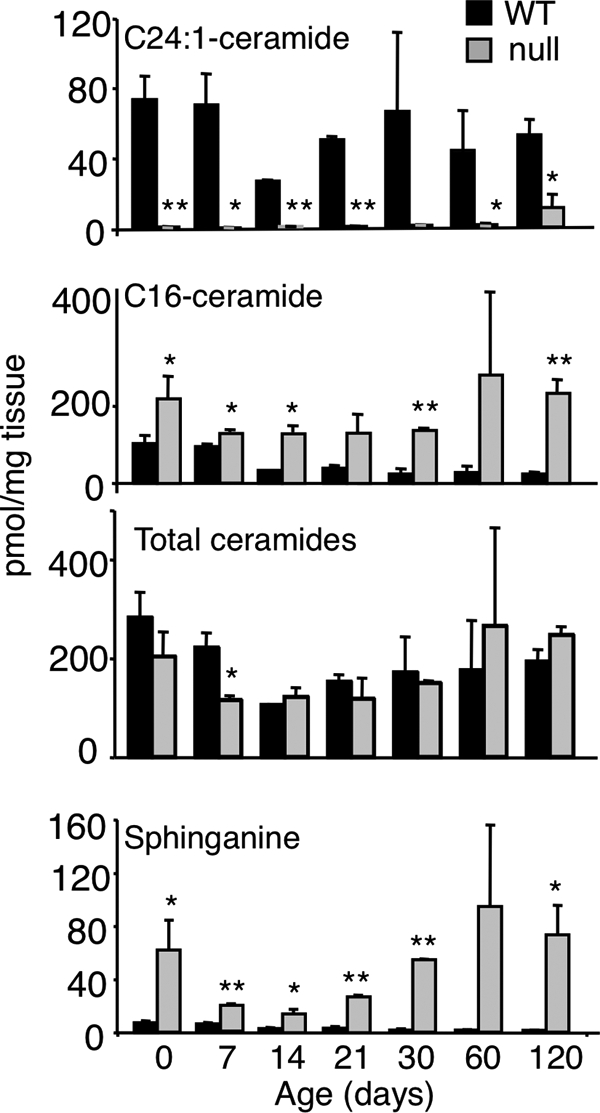
Ceramide and long chain base levels in CerS2 null mouse liver. Ceramide and sphinganine levels in CerS2 null mice versus age of the mice, measured by ESI-MS/MS. C24:1-ceramide is shown as an example of a very long acyl chain ceramide; data for the other very long acyl chain ceramides are in Table 1. For day 0, n = 4; for other time points, n = 2. *, p < 0.05; **, p < 0.01.
TABLE 1.
Ceramide composition of CerS2 WT and null mouse liver
Measurements were made by ESI-MS/MS. For day 0, n = 4, and for all other time points, n = 2. Statistical analysis was performed as indicated, a versus b, h versus i, p < 0.01; c versus d, e versus f, f versus g, j versus k, l versus m, p < 0.05.
Unexpectedly, levels of C16-ceramide and C16-SLs were increased (Fig. 3, Table 1, and supplemental Tables 1 and 2), and this increase compensated for the loss of C22–C24-ceramides such that total ceramide levels (i.e. the sum of individual ceramide species containing all acyl chains) were essentially unaltered (Table 2). Thus, CerS2 null mice are not depleted in total ceramide levels but rather show a change in their acyl chain composition.
TABLE 2.
Total SL levels in WT and CerS2 null mouse liver
The data are the sum of the individual SL species shown in Table 1 and supplemental Tables 1 and 2. With the exception of ceramide on day 7, SM on day 120, and HexCer on days 7 and 14 (p < 0.05), total ceramide, SM, and HexCer levels between WT and CerS2 null mice were statistically indistinguishable.
| Age | Ceramide |
SM |
HexCer |
|||
|---|---|---|---|---|---|---|
| WT | CerS2 null | WT | CerS2 null | WT | CerS2 null | |
| days | pmol/mg tissue | |||||
| 0 | 282 ± 49 | 203 ± 47 | 1153 ± 238 | 1402 ± 510 | 54.0 ± 5.6 | 52.8 ± 9.4 |
| 7 | 220 ± 30 | 114 ± 7 | 979 ± 215 | 707 ± 29 | 75.1 ± 3.5 | 48.0 ± 6.0 |
| 14 | 104 ± 0 | 121 ± 18 | 707 ± 109 | 827 ± 47 | 86.0 ± 11.1 | 50.1 ± 1.3 |
| 21 | 152 ± 12 | 117 ± 41 | 920 ± 16 | 1253 ± 304 | 99.3 ± 20.2 | 57.2 ± 15.7 |
| 30 | 171 ± 70 | 149 ± 4 | 859 ± 302 | 887 ± 42 | 40.1 ± 23.3 | 29.6 ± 1.6 |
| 60 | 175 ± 99 | 264 ± 199 | 780 ± 280 | 1093 ± 423 | 37.5 ± 19.5 | 48.9 ± 25.9 |
| 120 | 193 ± 23 | 247 ± 15 | 559 ± 62 | 1180 ± 69 | 19.1 ± 6.8 | 49.1 ± 15.7 |
C16-ceramide was the only ceramide species whose level increased (Table 1), and the increase was detectable at birth; the extent of the increase in C16-ceramide did not alter significantly during subsequent development (up to 120 days of age) (Table 1). Likewise, C16-SM was elevated from birth to 120 days of age (supplemental Table 2), as was C16-HexCer, although HexCer levels in liver were significantly lower than those of SM, and therefore the changes in HexCer levels were more variable (supplemental Table 2).
CerS2 Null Mice Display Changes in Levels of Long Chain Bases
In addition to the unexpected elevation of C16-SLs, a massive elevation of sphinganine was observed (Fig. 3 and Table 3), reaching levels as high as 95 pmol/mg of tissue, an ∼50-fold elevation compared with WT. Interestingly, sphinganine levels were high at birth in both WT and CerS2 null mice (Table 3) and subsequently decreased to levels of ∼1–2 pmol/mg of tissue in WT mice; in contrast, in CerS2 null mice, sphinganine levels started to increase after ∼21 days of age and reached levels similar to those at birth after about 1 month. Sphinganine was the only long chain base whose levels increased significantly, as levels of the important signaling molecules, sphingosine 1-phosphate and sphinganine 1-phosphate, were unchanged, and only a small change in sphingosine levels was observed (Table 3). However, no significant changes in levels of the second substrate of the CerS reaction, acyl-CoA, were detected (Fig. 4).
TABLE 3.
Long chain base composition of WT and CerS2 null mouse liver
Measurements were made by ESI-MS/MS. For day 0, n = 4, and for all other time points, n = 2. Differences between sphinganine levels in the WT versus the CerS2 null mice were statistically significant (p < 0.05). The only other statistically significant differences in long chain base levels in WT versus CerS2 null mice were between sphingosine levels on days 30 and 120 (p < 0.05) and in sphinganine 1-phosphate levels on days 120 (p < 0.05). a versus b, b versus c, and d versus e, p < 0.05; e versus f, p < 0.01.
| Age | Sphingosine |
Sphinganine |
Sphingosine 1-phosphate |
Sphinganine 1-phosphate |
||||
|---|---|---|---|---|---|---|---|---|
| WT | CerS2 null | WT | CerS2 null | WT | CerS2 null | WT | CerS2 null | |
| days | pmol/mg tissue | |||||||
| 0 | 31.8 ± 8.0 | 43.1 ± 15.0 | 7.0 ± 1.5 | 62.0 ± 22.1 | 0.2 ± 0.0 | 0.3 ± 0.1 | 0.9 ± 0.03 | 1.2 ± 0.6 |
| 7 | 13.1 ± 1.9 | 10.5 ± 1.0 | 4.7 ± 1.4 | 19.3 ± 0.7 | 0.1 ± 0.0 | 0.1 ± 0.0 | 0.1 ± 0.0 | 0.2 ± 0.1 |
| 14 | 9.7 ± 0.7 | 9.6 ± 0.6a | 2.9 ± 0.6 | 14.0 ± 3.3d | 0.0 ± 0.0 | 0.0 ± 0.0 | 0.1 ± 0.0 | 0.1 ± 0.0 |
| 21 | 11.0 ± 1.7 | 16.3 ± 0.9b | 3.1 ± 0.1 | 26.8 ± 1.1e | 0.1 ± 0.0 | 0.1 ± 0.0 | 0.1 ± 0.0 | 0.1 ± 0.0 |
| 30 | 12.0 ± 0.9 | 20.7 ± 0.3c | 1.8 ± 0.5 | 54.3 ± 0.6f | 0.1 ± 0.0 | 0.1 ± 0.0 | 0.0 ± 0.0 | 0.1 ± 0.0 |
| 60 | 17.2 ± 5.7 | 38.7 ± 21.3 | 1.8 ± 0.3 | 94.4 ± 61.2 | 0.1 | 0.1 | 0.0 | 0.2 |
| 120 | 15.3 ± 2.2 | 32.8 ± 4.6 | 1.3 ± 0.4 | 73.3 ± 22.1 | 0.1 ± 0.0 | 0.1 ± 0.0 | 0.1 ± 0.0 | 0.4 ± 0.1 |
FIGURE 4.
Levels of acyl-CoAs. Levels of fatty acyl-CoAs were analyzed by ESI-MS/MS in 30-day-old WT and CerS2 null mouse livers and are shown as a ratio. n = 2. There were no statistically significant differences between WT and the CerS2 null mouse.
Changes in Levels of Other Enzymes of SL Metabolism Cannot Explain the Changes in the SL Profile
To determine the mechanism responsible for the changes in SL acyl chain length and in sphinganine levels, we analyzed the mRNA expression levels and the activity of a number of enzymes in the SL metabolic pathway. mRNA levels of CerS5, which synthesizes C16-ceramide (12, 13), were elevated ∼2.5-fold, whereas mRNA levels of CerS6 (13), which can also synthesize C16-ceramide, were unaltered (Fig. 5). However, the increased mRNA levels do not result in changes in CerS5 (or CerS6, see also Ref. 36) enzyme activity, because C16-ceramide synthesis in vitro was unaltered (Fig. 2, inset). CerS1 and CerS3 mRNA was undetectable (data not shown).
FIGURE 5.
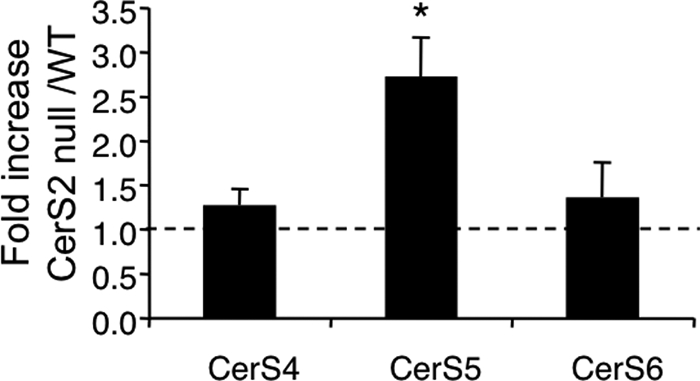
Levels of CerS mRNA expression. mRNA was isolated from 1-month-old WT and CerS2 null mice. n = 5; *, p < 0.005.
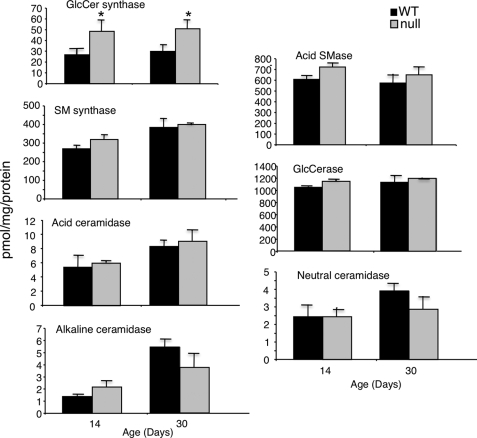
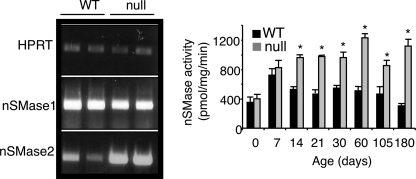
Systematic analysis of enzymes that either utilize ceramide as a substrate or produce it, including SM synthase, acid, alkaline, and neutral ceramidases and acid SMase, revealed no change in activity in either 14- or 30-day-old mice (Fig. 6). The only biosynthetic enzyme whose activity was altered was GlcCer synthase, which showed an ∼2-fold elevation in activity (Fig. 6). In addition, levels of N-SMase 2 mRNA, but not N-SMase 1 (Fig. 7), were elevated in CerS2 null mice, resulting in increased N-SMase activity in the liver starting at 14 days of age (Fig. 7).
FIGURE 6.
Activity of enzymes of ceramide metabolism. Activity was measured in liver homogenates (15–200 μg of protein) using fluorescent (NBD) lipid analogs. n = 3–4; *, p < 0.01.
FIGURE 7.
N-SMase activity. The left panel shows reverse transcription-PCR of N-SMase 1 and 2 in WT versus CerS2 null mice at 1 month of age; hypoxanthine-guanine phosphoribosyltransferase 1 (HPRT) was used as a control for RNA isolation and cDNA synthesis. The right panel shows N-SMase activity. n = 3; *, p < 0.05.
Changes in Glycerophospholipid and Cholesterol Levels
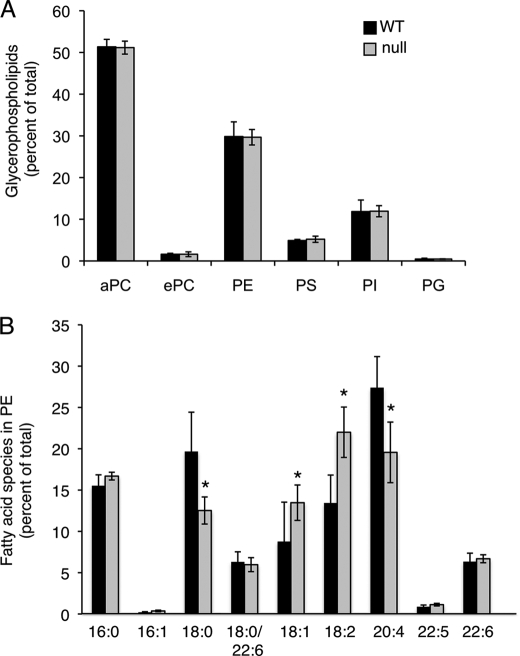
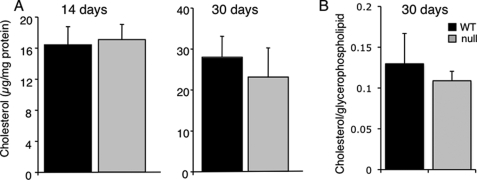
No changes were observed in glycerophospholipid levels between WT and CerS2 null mice. Thus, total phosphatidylcholine comprised ∼50% of the total glycerophospholipids in both WT and CerS2 null mouse liver, and phosphatidylethanolamine comprised ∼30% (Fig. 8A). However, there were significant differences in the distribution of acyl chains in phosphatidylethanolamine, with a significant reduction in 18:0 fatty acids and in the polyunsaturated fatty acid, C20:4, and a significant elevation in unsaturated fatty acids (C18:1 and C18:2) (Fig. 8B). Cholesterol levels were unaltered between the WT and CerS2 mice (Fig. 9).
FIGURE 8.
Glycerophospholipid levels. Glycerophospholipid levels were analyzed by nano-ESI-MS/MS in 30-day-old WT and CerS2 null mouse livers. A, glycerophospholipid levels are shown as a percent of total glycerophospholipids. n = 4 ± S.D. B, distribution of fatty acid chains in phosphatidylethanolamine is shown. n = 2. aPC, phosphatidylcholine (acyl chains); ePC, phosphatidylcholine (ethyl chains); PE, phosphatidylethanolamine; PS, phosphatidylserine; PI, phosphatidylinositol; PG, phosphatidylglycerol. n = 3 ± S.D.; *, p < 0.05.
FIGURE 9.
Cholesterol levels. A, total cholesterol levels were measured by the ferric chloride method for 14- and 30-day-old mouse liver (n = 3 ± S.D.). B, free (unesterified) cholesterol was measured by nano-ESI-MS/MS for 30-day-old liver (n = 4).
Functional Consequences of Altered SL Levels
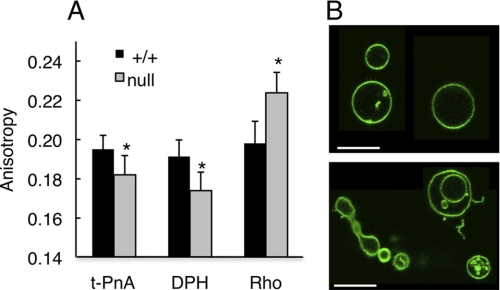
To examine the functional consequences of altered SL levels, two properties were examined that have been reported to depend on the acyl chain composition of SLs. First, small but significant differences were observed in the biophysical properties of lipid extracts isolated from liver microsomes, with membranes from CerS2 null mice displaying higher membrane fluidity (Fig. 10A) as shown by the lower anisotropy of t-PnA and DPH in CerS2 null membranes. This was confirmed by the increase in Rho anisotropy in CerS2 null membranes. In fluid membranes, Rho anisotropy increases because it distributes homogeneously in the membrane, and energy homotransfer is minimized. In membranes containing ordered regions, Rho is confined to the more fluid areas leading to an increase in energy homotransfer and a consequent decrease in anisotropy (30). Nevertheless, the extent of the change was not as large as might have been predicted based on the large change in the sphingolipid profile (Tables 1 and supplemental Tables 1 and 2), suggesting that compensatory changes occur in CerS2 null mice so as to maintain membrane fluidity. Despite the small differences observed in membrane fluidity, CerS2 null membranes displayed strong morphological alterations, including membrane fusion, budding, tubule formation, and vesicle adhesion, compared with WT membranes (Fig. 10B).
FIGURE 10.
Membrane biophysical properties and morphology of microsomal lipids. A, fluorescence anisotropy of three different probes in microsomal lipid extracts obtained from membranes of CerS2 null and WT mice at 30 days of age. n = 3; *, p < 0.001. B, confocal fluorescence microscopy showing the morphological features of microsomal lipid extracts from WT (upper panel) and CerS2 null mice (lower panel). Scale bar, 10 μm.
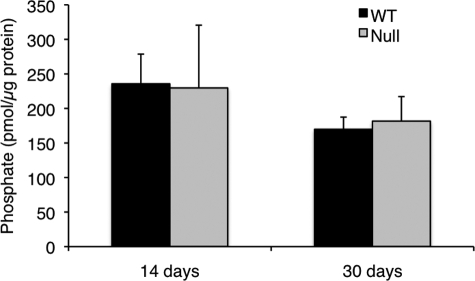
Second, we examined the activity of protein phosphatase 2A, whose activity is known to be modified by the acyl chain composition of ceramides (37). Protein phosphatase 2A activity was unchanged (Fig. 11), which is in agreement with studies suggesting a role of C18-ceramide, but not C16-ceramide (whose levels are elevated in the CerS2 null mouse liver, Fig. 3) (37), in regulating protein phosphatase 2A activity.
FIGURE 11.
Protein phosphatase 2A activity. Protein phosphatase 2A activity was measured in homogenates from WT and CerS2 null mouse liver. n = 3.
DISCUSSION
In this study, we have demonstrated that multiple and unexpected mechanisms of regulation of SL levels exist in vivo. Thus, although the mouse that we generated is defective only in synthesis of ceramides containing very long acyl chain fatty acids (i.e. C22–C24), levels of ceramide and downstream SLs containing long acyl chains (i.e. C16) were elevated, as were levels of sphinganine.
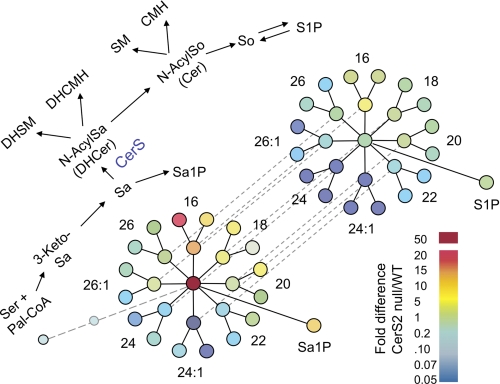
The extent of the differences in the SL profile between the WT and CerS2 null mouse can be appreciated by use of a pathway relational map (9) that shows fold differences in the amounts of SLs between each mouse (Fig. 12) using a “heat map” format. In this map, which depicts each metabolite as a node connected to its precursor and downstream metabolites, the hub of the middle cluster shows the formation of sphinganine from which radiates each of the different chain length N-acylsphinganines (dihydroceramides) produced by CerS, which are next incorporated into dihydrosphingomyelins (left branching nodes), dihydroceramide monohexoses (right branching nodes), or desaturated to the respective ceramides (Cer) (dashed lines to the right cluster) that are incorporated into SM, HexCers (ceramide monohexoses), or turned over to sphingosine (So) and sphingosine 1-phosphate (Fig. 12). This depiction is particularly useful for drawing attention to the metabolites that are elevated (Fig. 12, yellow to red) versus reduced (blue), and the relationships are relatively easy to appreciate. For example, by starting at the branch labeled 16 in Fig. 12 and proceeding clockwise through the various chain length subspecies, it is evident which subspecies are elevated and which are lower in the CerS2 null mouse. It is also apparent that sphinganine is much higher in the CerS2 null mouse and that dihydro-SLs are elevated more than SLs.
FIGURE 12.
Pathway relational map showing differences in the relative amounts of sphingolipids in 60-day-old CerS2 null versus WT mouse liver. The upper scheme (diagonal from lower left to upper right) summarizes the biosynthetic pathway of SLs beginning with condensation of serine and palmitoyl-CoA to 3-ketosphinganine (3-KetoSa) and then sphinganine (Sa), which is either N-acylated (to N-AcylSa, dihydroceramide (DHCer)) or phosphorylated (Sa1P). N-Acylated sphinganine can be desaturated to N-acylsphingosine (N-AcylSo, Cer), and both dihydroceramide and Cer can be converted into SM or glycosylated to ceramide monohexoses (CMH). Also shown is the hydrolysis of Cer to sphingosine (upper right), which can undergo phosphorylation to sphingosine 1-phosphate. Other intermediates and products of this scheme can also undergo turnover; some additional reactions (such as ceramide phosphate formation) are not shown because their amounts are small. The lower part of the figure depicts this pathway with all of the measured individual molecular subspecies as nodes that have been colored in the style of a heat map. The colors display the fold difference in the amounts of each compounds in CerS2 null versus WT mouse liver (i.e. CerS2/WT) using the color scale shown at the lower right. Thus, the light blue circle at the bottom left is for palmitoyl-CoA, followed by 3-ketosphinganine (3-keto-Sa) (which is shown smaller and faded to reflect that the amounts in both samples were too low for detection, but there was no evidence for accumulation of this intermediate in CerS2 null mouse), then by the node for sphinganine, which is deep red because sphinganine was substantially higher in the CerS2 null mice. Radiating from this hub are each N-acyl chain length metabolite of sphinganine (for examples, N-palmitoylsphinganine is labeled 16, and N-nervonoylsphinganine is labeled 24:1) (note that the former is elevated and the latter reduced), followed by the respective dihydrosphingomyelins (DHSM) (left nodes) and dihydroceramide monohexoses (DHCMH) (right nodes). Dashed lines relate each N-acyl chain length dihydroceramide to the respective Cer, which can be converted to SM and ceramide monohexose (outer nodes) or hydrolyzed to sphinganine (at the hub of this diagram). The phosphorylation products of sphinganine and So are also shown, labeled Sa1P and sphingosine 1-phosphate (S1P). The data used for this figure are from Tables 1 to 3. The layout of this scheme is from Ref. 9.
Despite the dramatic changes in the SL profile, we have not yet delineated the precise mechanisms leading to these changes. Thus, although C16-ceramide levels are elevated, there was no difference in C16-ceramide synthesis in vitro, and none of the changes, or lack of changes in the activities of other enzymes that metabolize ceramide, could explain these changes, including N-SMase 2, which shows a preference for degradation of very long acyl chain SM (38). One possibility is that ceramides with different acyl chain lengths (i.e. long chain versus very long chain) turn over with different rates and that these rates are affected upon depletion of very long acyl chain ceramides and SLs; unfortunately, nothing is known about the rate of turnover of SLs with different acyl chains. Another possibility is that different hepatocytes express different complements of CerS genes (17) and that deletion of CerS2 in one type of hepatocyte has unexpected consequences on the other type. For instance, CerS2 is found at high levels in periportal hepatocytes but at lower levels in centrilobular hepatocytes (see Fig. 5 in Ref. 17). Assuming that CerS2 is the major CerS in periportal hepatocytes and that other CerS are found at low levels in these cells, then sphinganine would accumulate in periportal hepatocytes of the CerS2 null mouse but would be consumed in centrilobular hepatocytes, assuming that centrilobular hepatocytes express a wider array of CerS genes. Interestingly, in a recent study using small interfering RNA to CerS2 in cultured SMS-KCNR neuroblastoma and MCF-7 breast cancer cells, no changes in sphinganine levels were observed, although C16-ceramide levels did increase in a similar manner to our study (36).
Irrespective of the precise molecular mechanism responsible for sphinganine elevation, the increases in sphinganine levels are reminiscent of those observed after treatment with fumonisin (39) (a CerS inhibitor) (40) that results in elevation of sphinganine. Sphinganine levels have been determined after treatment with fumonisin (10 mg/kg fumonisin, once per day for 5 days), with levels of ∼50 nmol/g of wet weight tissue (41). Assuming that ∼3 g of wet tissue is equivalent to ∼1 g of dry tissue (42), then sphinganine levels in the CerS2 null mouse liver are ∼30 nmol/g of wet weight, a little lower than values obtained after short term fumonisin treatment. In contrast, sphinganine 1-phosphate is significantly elevated in liver after fumonisin treatment (41) but barely changes in the CerS2 null mouse.
While this study and the accompanying study (17) were in preparation for publication, another study was published in which the same mouse was generated (16). Although there are some similarities between the two studies, our current study contains significant additional information to that of Imgrund et al. (16) as follows. (i) In the Imgrund et al. study (16), only one time point was measured for SL analyses, namely 10 weeks. In our study, we systematically analyzed SL levels for up to 4 months, including early time points in mouse development. This is important because it permits prediction of the time in which liver pathology might be observed and will help delineate the primary events leading to pathology; interestingly, there is little pathology until about 1 month after birth (17) even though SL levels (including sphinganine) are altered immediately after birth. (ii) Imgrund et al. (16) did not measure long chain bases, which could lead to the incorrect assumption that any pathology observed would only be due to changes in the acyl chain composition of SLs. In contrast, our data suggest that pathology is likely due to a combination of changes in the acyl chain composition and also in sphinganine levels; this is important because considerable information is available about pathological changes that occur in mouse liver upon fumonisin consumption, which can thus be compared and contrasted to that obtained in the CerS2 null mouse. (iii) Imgrund et al. (16) see surprisingly high levels of C18-ceramide synthesis in WT liver relative to the low amount of C18-ceramide, -SM, and -HexCer that is found in liver (15, 16); in addition, they see a large reduction in C18-ceramide synthesis in the CerS2 null mouse. This is rather unexpected, because CerS2 does not synthesize significant levels of C18-ceramide (15), suggesting that expression or activity of CerS1 (or CerS4) (which both synthesize C18-ceramide (11)) has been inexplicably altered under their experimental conditions. (iv) Total ceramide, SM, and HexCer levels are reduced by 30–50% in the liver of mice generated by Imgrund et al. (16), whereas there are essentially no statistically significant changes in the total levels of these lipids in our study. This difference may be related to the one specific time point studied by Imgrund et al. (16). However, it is of important functional consequence, because we are able to exclude that any pathology we observe is due to changes in total SL levels.
Although inactivation of the CerS2 gene has a major effect on the acyl chain composition of SLs and on levels of SL metabolites, membrane fluidity is changed to a smaller extent than might be predicted, suggesting that the membrane lipid composition of CerS2 null mice might be fine-tuned to maintain overall fluidity. In WT mice, this property appears to be mainly determined by the balance between very long chain saturated SLs (which give a higher membrane order) and unsaturated SLs (which give higher membrane fluidity) (Table 1 and supplemental Tables 1 and 2). In the CerS2 null mouse, membranes are depleted in unsaturated SLs, and thus membrane order should increase. However, there is a concomitant enrichment in saturated long chain (i.e. C16) SLs, which induce an overall order lower than very long chain saturated SLs (44) leading to an overall decrease in order (fluidity increase). Despite the similar degree of order in CerS2 null and WT membranes, strong differences in membrane shape and curvature were observed. Membrane morphology plays an important role in cellular processes such as development and maintenance of organelles, endocytosis, vesiculation, and lipid and protein sorting (45). Indeed, it was recently shown that structural motifs such as α-helices and alkyl chains are able to sense differences in membrane curvature and are susceptible to membrane curvature-induced redistribution and sorting (46). In addition, the endocytic sorting of lipids and proteins commonly involves vesicular and tubular membranes, where the differences in lipid packing/membrane fluidity determine the route of the sorting molecule (47, 48). Tubular structures were also shown to play a major role in cell-to-cell communication and intercellular transfer of organelles (43). Therefore, changing the lipid profile in CerS2 null mice induces major alterations in membrane morphology that may affect both intra- and intercellular signaling. Furthermore, changes in the membrane lipid composition and concomitant changes in membrane morphology in CerS2 null mice may disrupt several trafficking pathways with various pathophysiological consequences.
In summary, the unexpected changes observed in the SL and long chain base profile of the CerS2 null mouse liver, and in the biophysical properties, implies much more complex pathways of regulation of SL metabolism than previously envisaged. Moreover, these changes cause a dramatic hepatopathy, as reported in the accompanying study (17).
Supplementary Material
Acknowledgments
We thank Reut Pienik and Hani Dekel for excellent technical assistance and Dr. Yisrael Parmet for help with statistical analyses.
This work was supported, in whole or in part, by National Institutes of Health Grant GM076217. This work was also supported by Israel Science Foundation Grant 1404/07 and by The Minerva Foundation.

The on-line version of this article (available at http://www.jbc.org) contains supplemental “Experimental Procedures” and Tables 1 and 2.
- SL
- sphingolipid
- CerS
- ceramide synthase
- DPH
- 1,6-diphenyl-1,3,5-hexatriene
- ESI-MS/MS
- electrospray ionization-tandem mass spectrometry
- GlcCer
- glucosylceramide
- HexCer
- hexosylceramide
- Rho
- 1,2-dioleoyl-sn-glycero-3-phosphoethanolamine-N-(lissamine rhodamine B sulfonyl)
- SMase
- sphingomyelinase
- SM
- sphingomyelin
- t-PnA
- trans-parinaric acid
- WT
- wild type
- N-SMase
- neutral sphingomyelinase.
REFERENCES
- 1.Fahy E., Subramaniam S., Brown H. A., Glass C. K., Merrill A. H., Jr., Murphy R. C., Raetz C. R., Russell D. W., Seyama Y., Shaw W., Shimizu T., Spener F., van Meer G., VanNieuwenhze M. S., White S. H., Witztum J. L., Dennis E. A. (2005) J. Lipid Res. 46, 839–861 [DOI] [PubMed] [Google Scholar]
- 2.Hanada K., Kumagai K., Yasuda S., Miura Y., Kawano M., Fukasawa M., Nishijima M. (2003) Nature 426, 803–809 [DOI] [PubMed] [Google Scholar]
- 3.Alvarez-Vasquez F., Sims K. J., Cowart L. A., Okamoto Y., Voit E. O., Hannun Y. A. (2005) Nature 433, 425–430 [DOI] [PubMed] [Google Scholar]
- 4.D'Angelo G., Polishchuk E., Di Tullio G., Santoro M., Di Campli A., Godi A., West G., Bielawski J., Chuang C. C., van der Spoel A. C., Platt F. M., Hannun Y. A., Polishchuk R., Mattjus P., De Matteis M. A. (2007) Nature 449, 62–67 [DOI] [PubMed] [Google Scholar]
- 5.Futerman A. H., Hannun Y. A. (2004) EMBO Rep. 5, 777–782 [DOI] [PMC free article] [PubMed] [Google Scholar]
- 6.Hannun Y. A., Obeid L. M. (2008) Nat. Rev. Mol. Cell Biol. 9, 139–150 [DOI] [PubMed] [Google Scholar]
- 7.Spiegel S., Milstien S. (2003) Nat. Rev. Mol. Cell Biol. 4, 397–407 [DOI] [PubMed] [Google Scholar]
- 8.Pruett S. T., Bushnev A., Hagedorn K., Adiga M., Haynes C. A., Sullards M. C., Liotta D. C., Merrill A. H., Jr. (2008) J. Lipid Res. 49, 1621–1639 [DOI] [PMC free article] [PubMed] [Google Scholar]
- 9.Merrill A. H., Jr., Wang M. D., Park M., Sullards M. C. (2007) Trends Biochem. Sci. 32, 457–468 [DOI] [PubMed] [Google Scholar]
- 10.Pewzner-Jung Y., Ben-Dor S., Futerman A. H. (2006) J. Biol. Chem. 281, 25001–25005 [DOI] [PubMed] [Google Scholar]
- 11.Venkataraman K., Riebeling C., Bodennec J., Riezman H., Allegood J. C., Sullards M. C., Merrill A. H., Jr., Futerman A. H. (2002) J. Biol. Chem. 277, 35642–35649 [DOI] [PubMed] [Google Scholar]
- 12.Riebeling C., Allegood J. C., Wang E., Merrill A. H., Jr., Futerman A. H. (2003) J. Biol. Chem. 278, 43452–43459 [DOI] [PubMed] [Google Scholar]
- 13.Mizutani Y., Kihara A., Igarashi Y. (2005) Biochem. J. 390, 263–271 [DOI] [PMC free article] [PubMed] [Google Scholar]
- 14.Mizutani Y., Kihara A., Igarashi Y. (2006) Biochem. J. 398, 531–538 [DOI] [PMC free article] [PubMed] [Google Scholar]
- 15.Laviad E. L., Albee L., Pankova-Kholmyansky I., Epstein S., Park H., Merrill A. H., Jr., Futerman A. H. (2008) J. Biol. Chem. 283, 5677–5684 [DOI] [PubMed] [Google Scholar]
- 16.Imgrund S., Hartmann D., Farwanah H., Eckhardt M., Sandhoff R., Degen J., Gieselmann V., Sandhoff K., Willecke K. (2009) J. Biol. Chem. 284, 33549–33560 [DOI] [PMC free article] [PubMed] [Google Scholar]
- 17.Pewzner-Jung Y., Brenner O., Braunn S., Laviad E. L., Ben-Dor S., Feldmesser E., Horn-Saban S., Amann-Zalcenstein D., Raanan C., Berkutzki T., Erez-Roman R., Ben-David O., Levy M., Holzman D., Park H., Nyska A., Merrill A. H., Futerman A. H. (2010) J. Biol. Chem., 10.1074/jbc.M109.077610 [DOI] [PMC free article] [PubMed] [Google Scholar]
- 18.Hirschberg K., Rodger J., Futerman A. H. (1993) Biochem. J. 290, 751–757 [DOI] [PMC free article] [PubMed] [Google Scholar]
- 19.Lahiri S., Lee H., Mesicek J., Fuks Z., Haimovitz-Friedman A., Kolesnick R. N., Futerman A. H. (2007) FEBS Lett. 581, 5289–5294 [DOI] [PubMed] [Google Scholar]
- 20.Futerman A. H., Stieger B., Hubbard A. L., Pagano R. E. (1990) J. Biol. Chem. 265, 8650–8657 [PubMed] [Google Scholar]
- 21.Tani M., Okino N., Mitsutake S., Ito M. (1999) J. Biochem. 125, 746–749 [DOI] [PubMed] [Google Scholar]
- 22.Futerman A. H., Pagano R. E. (1991) Biochem. J. 280, 295–302 [DOI] [PMC free article] [PubMed] [Google Scholar]
- 23.Meivar-Levy I., Horowitz M., Futerman A. H. (1994) Biochem. J. 303, 377–382 [DOI] [PMC free article] [PubMed] [Google Scholar]
- 24.Sullards M. C., Merrill A. H., Jr. (2001) Sci. STKE 86, 2001, pl1. [DOI] [PubMed] [Google Scholar]
- 25.Merrill A. H., Jr., Sullards M. C., Allegood J. C., Kelly S., Wang E. (2005) Methods 36, 207–224 [DOI] [PubMed] [Google Scholar]
- 26.Haynes C. A., Allegood J. C., Sims K., Wang E. W., Sullards M. C., Merrill A. H., Jr. (2008) J. Lipid Res. 49, 1113–1125 [DOI] [PMC free article] [PubMed] [Google Scholar]
- 27.Brügger B., Glass B., Haberkant P., Leibrecht I., Wieland F. T., Kräusslich H. G. (2006) Proc. Natl. Acad. Sci. U.S.A. 103, 2641–2646 [DOI] [PMC free article] [PubMed] [Google Scholar]
- 28.Brügger B., Sandhoff R., Wegehingel S., Gorgas K., Malsam J., Helms J. B., Lehmann W. D., Nickel W., Wieland F. T. (2000) J. Cell Biol. 151, 507–518 [DOI] [PMC free article] [PubMed] [Google Scholar]
- 29.Courchaine A. J., Miller W. H., Stein D. B., Jr. (1959) Clin. Chem. 5, 609–614 [PubMed] [Google Scholar]
- 30.Silva L. C., Futerman A. H., Prieto M. (2009) Biophys. J. 96, 3210–3222 [DOI] [PMC free article] [PubMed] [Google Scholar]
- 31.Stiban J., Caputo L., Colombini M. (2008) J. Lipid Res. 49, 625–634 [DOI] [PubMed] [Google Scholar]
- 32.Pinto S. N., Silva L. C., de Almeida R. F., Prieto M. (2008) Biophys. J. 95, 2867–2879 [DOI] [PMC free article] [PubMed] [Google Scholar]
- 33.Donella Deana A., Mac Gowan C. H., Cohen P., Marchiori F., Meyer H. E., Pinna L. A. (1990) Biochim. Biophys. Acta 1051, 199–202 [DOI] [PubMed] [Google Scholar]
- 34.Baykov A. A., Evtushenko O. A., Avaeva S. M. (1988) Anal. Biochem. 171, 266–270 [DOI] [PubMed] [Google Scholar]
- 35.Friedrich G., Soriano P. (1993) Methods Enzymol. 225, 681–701 [DOI] [PubMed] [Google Scholar]
- 36.Spassieva S. D., Mullen T. D., Townsend D. M., Obeid L. M. (2009) Biochem. J. 424, 273–283 [DOI] [PMC free article] [PubMed] [Google Scholar]
- 37.Mukhopadhyay A., Saddoughi S. A., Song P., Sultan I., Ponnusamy S., Senkal C. E., Snook C. F., Arnold H. K., Sears R. C., Hannun Y. A., Ogretmen B. (2009) FASEB J. 23, 751–763 [DOI] [PMC free article] [PubMed] [Google Scholar]
- 38.Marchesini N., Osta W., Bielawski J., Luberto C., Obeid L. M., Hannun Y. A. (2004) J. Biol. Chem. 279, 25101–25111 [DOI] [PubMed] [Google Scholar]
- 39.Riley R. T., Voss K. A. (2006) Toxicol. Sci. 92, 335–345 [DOI] [PubMed] [Google Scholar]
- 40.Wang E., Norred W. P., Bacon C. W., Riley R. T., Merrill A. H., Jr. (1991) J. Biol. Chem. 266, 14486–14490 [PubMed] [Google Scholar]
- 41.Kim D. H., Yoo H. S., Lee Y. M., Kie J. H., Jang S., Oh S. (2006) J. Toxicol. Environ. Health A 69, 2071–2082 [DOI] [PubMed] [Google Scholar]
- 42.Yang J., Miyazaki N. (2003) Environ. Pollut. 121, 345–347 [DOI] [PubMed] [Google Scholar]
- 43.Rustom A., Saffrich R., Markovic I., Walther P., Gerdes H. H. (2004) Science 303, 1007–1010 [DOI] [PubMed] [Google Scholar]
- 44.Björkqvist Y. J., Brewer J., Bagatolli L. A., Slotte J. P., Westerlund B. (2009) Biochim. Biophys. Acta 1788, 1310–1320 [DOI] [PubMed] [Google Scholar]
- 45.Doherty G. J., McMahon H. T. (2009) Annu. Rev. Biochem. 78, 857–902 [DOI] [PubMed] [Google Scholar]
- 46.Hatzakis N. S., Bhatia V. K., Larsen J., Madsen K. L., Bolinger P. Y., Kunding A. H., Castillo J., Gether U., Hedegård P., Stamou D. (2009) Nat. Chem. Biol. 5, 835–841 [DOI] [PubMed] [Google Scholar]
- 47.Mukherjee S., Soe T. T., Maxfield F. R. (1999) J. Cell Biol. 144, 1271–1284 [DOI] [PMC free article] [PubMed] [Google Scholar]
- 48.Tian A., Baumgart T. (2009) Biophys. J. 96, 2676–2688 [DOI] [PMC free article] [PubMed] [Google Scholar]
Associated Data
This section collects any data citations, data availability statements, or supplementary materials included in this article.


