Abstract
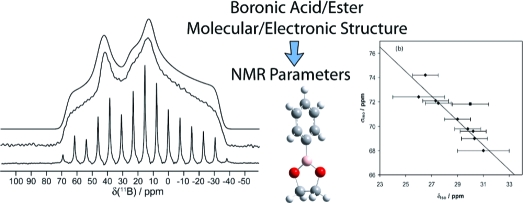
The results of a solid-state 11B NMR study of a series of 10 boronic acids and boronic esters with aromatic substituents are reported. Boron-11 electric field gradient (EFG) and chemical shift (CS) tensors obtained from analyses of spectra acquired in magnetic fields of 9.4 and 21.1 T are demonstrated to be useful for gaining insight into the molecular and electronic structure about the boron nucleus. Data collected at 21.1 T clearly show the effects of chemical shift anisotropy (CSA), with tensor spans (Ω) on the order of 10−40 ppm. Signal enhancements of up to 2.95 were achieved with a DFS-modified QCPMG pulse sequence. To understand the relationship between the measured tensors and the local structure better, calculations of the 11B EFG and magnetic shielding tensors for these compounds were conducted. The best agreement was found between experimental results and those obtained from GGA revPBE DFT calculations. A positive correlation was found between Ω and the dihedral angle (ϕCCBO), which describes the orientation of the boronic acid/ester functional group relative to an aromatic system bound to boron. The small boron CSA is discussed in terms of paramagnetic shielding contributions as well as diamagnetic shielding contributions. Although there is a region of overlap, both Ω and the 11B quadrupolar coupling constants tend to be larger for boronic acids than for the esters. We conclude that the span is generally the most characteristic boron NMR parameter of the molecular and electronic environment for boronic acids and esters, and show that the values result from a delicate interplay of several competing factors, including hydrogen bonding, the value of ϕCCBO, and the electron-donating or withdrawing substituents bound to the aromatic ring.
Introduction
Boronic acids and boronic esters(1) are particularly important classes of compounds that have a wide range of uses and applications. For example, they are used in catalytic additions to ketones,(2) asymmetric conjugate additions,(3) enzyme inhibition,4−9 potent and selective serine protease inhibition,10,11 Suzuki coupling reactions in organic synthesis,12−14 materials synthesis,15−19 and neutron capture therapy treatments for cancer patients.20−23 Given the broad utility of boronic acids and esters, an understanding of the structural and electronic properties of these compounds is important. Solid-state 11B NMR can provide valuable information about these properties. Boron has two quadrupolar NMR-active isotopes, 10B (I = 3; N.A. = 19.9%; Ξ ≈ 10.744%) and 11B (I = 3/2; N.A. = 80.1%; Ξ ≈ 32.084%).(24) Both of these nuclides have small to moderate nuclear electric quadrupole moments, Q (Q(10B) = 84.59 mb; Q(11B) = 40.59 mb).(25) The 11B nucleus is more receptive to NMR studies due to its higher natural abundance, smaller quadrupole moment, and availability of a central transition (CT) (i.e., mI = +1/2 ↔ −1/2).
When NMR experiments are conducted on solutions, rapid tumbling of the solute molecules leads to an averaging of molecular orientations. In many cases, this leads to sharp peaks, and isotropic chemical shift data may be obtained since the motion of the solute molecules is isotropic over the time scale of the NMR experiment. It is well-known that such NMR experiments can be applied to help elucidate and assign the structure of the compound being studied, provide data about the chemical environment of the nucleus being studied, provide information about dynamics such as reaction rates, or simply monitor a reaction in progress from initiation to completion. Comprehensive 11B NMR studies have been conducted on boron compounds in solution and many isotropic chemical shifts (δiso) have been recorded.26,27 The known boron chemical shift range for tricoordinate and tetracoordinate species covers approximately 210 ppm, with tetracoordinate species falling between δiso = 20 and −120 ppm and tricoordinate species falling between δiso = 90 and −20 ppm with respect to F3B·O(C2H5)2 at 0 ppm.26,27 Boronic acids and esters have chemical shifts in solution ranging from about 18 to 31 ppm.(26) The chemical shifts for 11B have been shown to correlate with the ligand π electron-donating ability.(26) Thus, the interpretation of 11B chemical shifts may provide insight into π bonding. For tricoordinate boron compounds of the series BR3, BXR2, BX2R, and BX3 (X = electron-withdrawing ligand; R = alkyl group), as one progresses from BR3 to BX3, the 11B isotropic chemical shifts decrease systematically, which has been interpreted as being associated with increased π-electron backbonding from X to B.(26) In addition, a sterically congested environment tends to cause decreased π-bonding; hence, a positive shift may be observed with increasing steric bulk about the boron.(26)
In powdered samples, the lack of rapid molecular tumbling corresponds to a static distribution of crystallite, and hence molecular, orientations. This leads to broadening of the NMR line shape. For 11B, solid-state NMR (SSNMR) spectra can provide information about both the quadrupolar interaction between the nucleus and the electric field gradient (EFG), as well as chemical shift anisotropy (CSA), both of which may be related to the electronic and molecular environment. An advantage of SSNMR experiments using quadrupolar nuclei is that additional parameters that reflect the orientation-dependence of the NMR interactions are available to describe the local geometry and bonding environment.
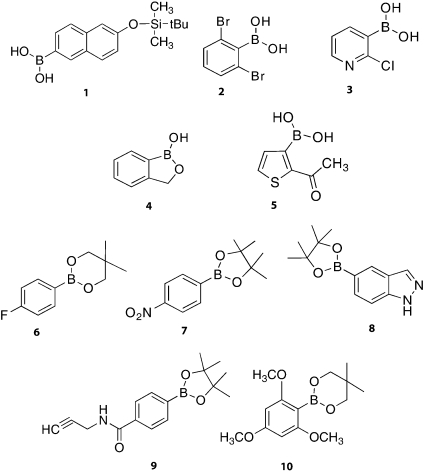
We report the experimental characterization and interpretation of boron chemical shift (CS) and EFG tensors in a series of solid boronic acids and esters (Figure 1). Boron-11 SSNMR experiments were performed under stationary and magic-angle spinning (MAS) conditions at magnetic field strengths (B0) of 9.40 and 21.1 T. At 21.1 T, the influence of the CS tensor on the observed SSNMR line shapes becomes extremely important as its line shape contribution (in Hz) is proportional to B0. In addition to improving sensitivity, ultrahigh-field (>18.8 T) NMR spectrometers should therefore provide more precise measurements of the influence of the CS tensor on SSNMR spectra. In the case of quadrupolar nuclei, such as 11B, a high magnetic field usually produces narrower CT line shapes since the central transition signal broadening associated with the second-order quadrupolar coupling scales inversely with magnetic field.
Figure 1.
Structures of the boronic acids (1−5) and boronic esters (6−10) used in this study.
We also report on molecular orbital (MO) analyses performed to provide insight into the relationship between the molecular and electronic structure around the boron nucleus and the 11B NMR parameters. CSA is often rationalized by considering contributions to the paramagnetic shielding term, as outlined in Ramsey’s theory of nuclear magnetic shielding.28−30 This theory posits that the nuclear magnetic shielding tensor can be broken down into two terms, a diamagnetic term (σdia) and a paramagnetic term (σpara). The theory may be applied in explaining the effects of orbital-mixing-induced paramagnetic shielding on CSA. Interpretation of experimental data alongside quantum chemical calculations has the potential to provide important information relating NMR parameters and molecular and electronic environments about the boron nucleus.
Conventions and Background
The 11B SSNMR spectra presented here are affected by nuclear magnetic shielding (σ) and the quadrupolar interaction between Q and the EFG at the nucleus. The Hamiltonian operator for 11B in a magnetic field may be expressed as:
where the first term represents the Zeeman interaction, the second represents the quadrupolar interaction, and the third represents the magnetic shielding interaction.
Magnetic shielding may be generally represented by a second-rank tensor, σ. Diagonalization of the symmetric portion of σ yields the orientation of its principal axis system (PAS) relative to an external axis system. In its PAS, the three principal components (i.e., the diagonal matrix elements) of the symmetric σ are ordered as follows: σ11 ≤ σ22 ≤ σ33. The experimentally observed δiso may be defined in terms of magnetic shielding if a suitable shielding reference exists:
where ii = 11, 22, 33, iso. The three principal components of the CS tensor are ordered as follows: δ11 ≥ δ22 ≥ δ33. For both the σ and CS tensors, the isotropic value is the average of the three principal components. Here, the Maryland convention will be used for reporting the σ and CS tensor parameters.(31) The span (Ω) is defined as:(31)
The skew (κ) is defined as:(31)
As with the shielding and shift tensors, the EFG tensor may be diagonalized to provide the principal elements of the tensor and the orientation of the PAS. The principal components of the EFG tensor are defined as follows: |V33| ≥ |V22| ≥ |V11|. The quadrupolar coupling constant (CQ) may be expressed as:
where e is the fundamental charge and h is Planck’s constant. The asymmetry parameter of the EFG tensor is defined as:
It is useful to discuss the breadth of the CT powder pattern due to second-order quadrupolar interactions, for a stationary sample, ignoring CSA for the moment:(32)
 |
The breadth of the CT (ΔνCT) is inversely proportional to the Larmor frequency (νL) of the nucleus being studied. Since νL is directly proportional to B0, this implies that ΔνCT is inversely proportional to B0. The use of a larger B0 therefore results in a decrease in second-order quadrupolar broadening of the central transition in frequency units.
Boron-11 magnetic shielding is discussed later in terms of contributions from σdia and σpara.28−30 The paramagnetic shielding term may be defined as:
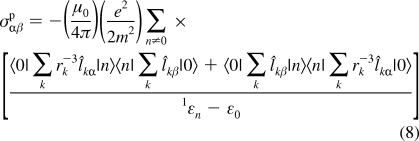 |
where the terms in the numerator represent the degree of orbital mixing between the occupied and virtual orbitals contributing to a particular shielding component (α and β are permuted over x, y, z), and the term in the denominator represents the energy gap between the two wave functions involved in the mixing.
Experimental and Computational Details
i. Solid-State NMR Spectroscopy
a. 400 MHz Data
The five boronic acids [2-(tert-butyldimethylsilyloxy)naphthalene-6-boronic acid (1), 2,6-dibromophenylboronic acid (2), 2-chloropyridine-3-boronic acid (3), 2-(hydroxymethyl)phenylboronic acid cyclic monoester (4), and 2-acetyl-3-thiopheneboronic acid (5)], and five boronic esters [4-fluorophenylboronic acid neopentylglycol ester (6), 4-nitrophenylboronic acid pinacol ester (7), 1H-indazole-5-boronic acid pinacol ester (8), 4-(2-propynylcarbamoyl)phenylboronic acid pinacol ester (9), and 2,4,6-trimethoxyphenylboronic acid neopentyl glycol ester (10)] in this study (Figure 1) were purchased from Aldrich and were used without further purification. Samples were powdered and packed in a glovebox under an inert atmosphere of nitrogen into 4 mm O.D. ZrO2 rotors, and NMR experiments were conducted using a Bruker AvanceIII NMR spectrometer (B0 = 9.40 T, νL(11B) = 128.38 MHz). Spectra were acquired using TopSpin 2.0 software. A Bruker 4.0 mm HXY triple-resonance MAS probe tuned to 11B on the X channel was used. Experimental referencing, calibration, and setup were done using solid powdered sodium borohydride. Solid NaBH4 has a chemical shift of −42.06 ppm relative to the primary standard, liquid F3B·O(C2H5)2 (where δ(11B) = 0.00 ppm).(33) For both MAS and stationary samples, the Hahn echo (π/2 − τ1 − π − τ2 − ACQ)34,35 pulse sequence was used. MAS spinning frequencies ranged from 12 to 15 kHz. Typical π/2 pulse lengths for solid NaBH4 were ∼3.0 μs. For the 10 samples under study, the “solid π/2” pulse was used (e.g., 3.0 μs/(I + 1/2) = 1.5 μs, where I = 3/2 for 11B). Recycle delays of 2−120 s were employed. Signal averaging was carried out over a period of 4 min to 4 h for both static and MAS samples. Proton decoupling was applied during acquisition of the spectra of stationary samples. QCPMG experiments (π/2 − τ1 − π − τ2 − ACQ(τ) − [τ3 − π − τ4 − ACQ(2τ)]N)(36) were also performed, where the number of full echoes acquired (N) depended on the transverse (spin−spin) relaxation time constant T2. In most cases, 96 full echoes were acquired. The value of 2τ was varied from 450−950 μs, depending on the desired spikelet separation in the frequency domain, νCPMG. Modified QCPMG experiments were conducted, where the π pulse in the echo train was replaced with a π/2 pulse.(37) Double-frequency sweep (DFS) shaped pulses were also used in conjunction with Hahn echo and QCPMG experiments to enhance the CT signal intensity.38,39 The probes used at both fields exhibit a small, but manageable background 11B signal in the acquired spectra, as a result of boron nitride in the stators. The Hahn echo pulse sequence was generally found to be effective at suppressing the background signal.
b. 900 MHz Data
Samples were powdered and packed in a glovebox under a dry argon atmosphere into 2.5 mm O.D. ZrO2 rotors, and NMR experiments were conducted using a Bruker AvanceII NMR spectrometer (B0 = 21.1 T, νL(11B) = 288.80 MHz). Spectra were acquired using TopSpin 1.3 software at the National Ultrahigh-Field NMR Facility for Solids in Ottawa (www.nmr900.ca). A Bruker 2.5 mm HX MAS VT probe tuned to 11B on the X channel was used. The referencing, calibration, and setup procedures were identical, and the pulse sequences, pulse widths, pulse delays, and experiment times were similar to those used at 9.40 T. The MAS speed was 30 kHz. All MAS samples were cooled to room temperature using a VT unit to prevent sample decomposition caused by heat production at fast spinning speeds.
c. Spectral Processing and Simulation
Data were processed using TopSpin 2.0. FIDs were left-shifted to the echo maxima when necessary, apodized using a Gaussian function of 5−25 Hz for MAS samples and 20−200 Hz for stationary samples, then Fourier transformed. Stack plots were produced with DMFit.(40) Spectral simulations were performed using the WSolids1 program(41) which incorporates the space-tiling algorithm of Alderman et al.(42) The error associated with spectral parameters was determined heuristically by analyzing the spectra (MAS and static echo, but not QCPMG) obtained at both magnetic fields. In simulations, each NMR parameter was varied individually from the optimum value until a noticeable discrepancy with the experimental spectrum was observed. Of the compounds studied, an X-ray crystal structure is available for compound 4(43) only; this structure indicates a single crystallographically unique boron site. NMR spectra acquired presently strongly suggest that there is a single unique boron site for all other compounds studied as well. As such, all spectra were simulated using a single boron site for each compound. In some cases, boric acid or other decomposition products were included in simulations as an additional boron site.
ii. Quantum Chemical Calculations
A model for each compound was generated using standard bond lengths in Gaussview 3.0. These structures were then subjected to geometry optimization using the B3LYP hybrid DFT functional (B3LYP)(44) and the 6-311+G* basis set for all atoms, while keeping the coordinates of the carbon and hydrogen atoms in the aromatic ring system frozen so as to not perturb the planarity of the aromatic system and to assist in convergence. On the resulting optimized structure, B3LYP was then used to perform an unrestrained second geometry optimization using the 6-311+G* basis set. These optimized structures were subjected to further NMR calculations. Dihedral angles (ϕCCBO) of interest were altered simply by defining a new ϕCCBO in Gaussview for the optimized structure. Although the crystal structure for phenylboronic acid has been reported,(45) geometry optimizations were performed in order to systematically vary ϕCCBO. These computations were performed to isolate the impact of varying ϕCCBO on the boron magnetic shielding tensor. EFG and σ tensors were calculated using Gaussian 03(46) running on an in-house 304 CPU system, and the Amsterdam Density Functional package(47) (ADF) running on the High Performance Computing Virtual Laboratory (www.hpcvl.org) cluster. DFT calculations employing B3LYP(44) used the 6-311+G* basis set on all atoms. Restricted Hartree−Fock (RHF) calculations were also carried out using the same basis set. Finally, magnetic shielding, EFG, and MO analysis calculations using ADF and employing the GGA-revPBE DFT method (GGA-revPBE) were carried out using the TZP basis set on all atoms.
Boron-11 quadrupolar coupling constants were calculated from the largest principal component of the EFG tensor, V33, using eq 5. Calculated NMR parameters were parsed using EFGShield.(48) The factor 9.7177 × 10²¹ V m−2 per atomic unit is used to convert V33 from atomic units to V m−2.(49)
Results and Discussion
i. 11B Solid-State NMR Spectroscopy
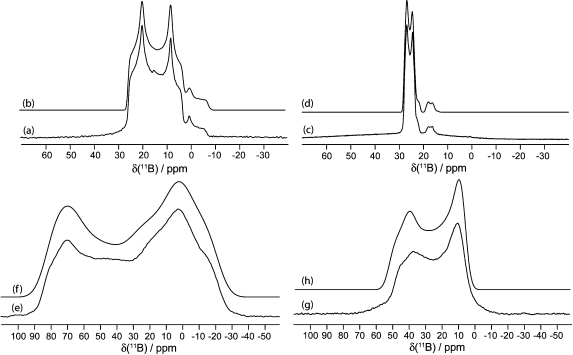
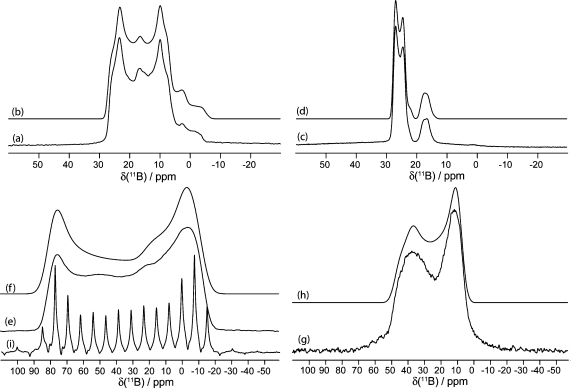
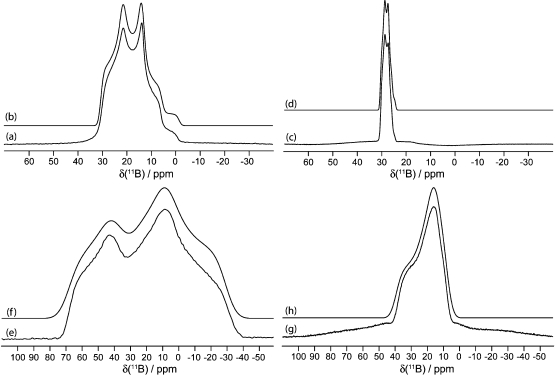
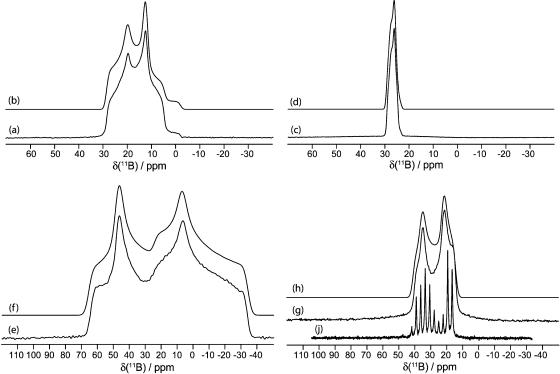
Shown in Table 1 are the boron EFG and CS tensor values obtained via analytical simulations of the 11B NMR spectra of boronic acids and esters 1−10. By simultaneously fitting data at both 9.40 and 21.1 T, the CQ, ηQ, and δiso values were determined from MAS NMR spectra. Subsequently, stationary spectra were analyzed to determine the Ω, κ, and Euler angles relating the two tensor PASs (see Figures 2−9, S3 and S4).
Table 1. Experimental 11B EFG and CS Tensor Parameters for Compounds 1−10a.
| sample | CQ (MHz) | ηQ | δiso (ppm) | Ω (ppm) | κ | α (°) | β (°) | γ (°) | |
|---|---|---|---|---|---|---|---|---|---|
| boronic acids | 1 | 3.29 ± 0.10 | 0.40 ± 0.10 | 29.0 ± 1.0 | 33 ± 11 | −0.50 ± 0.20 | 50 ± 30 | 25 ± 25 | 40 ± 40 |
|
2 |
3.10 ± 0.20 | 0.30 ± 0.20 | 30.0 ± 1.4 | 40 ± 10 | 0.40 ± 0.60 | 65 ± 10 | 0 ± 10 | 0 ± 10 | |
|
3 |
3.05 ± 0.10 | 0.10 ± 0.20 | 27.5 ± 1.0 | 32 ± 2 | 0.40 ± 0.40 | 0 ± 20 | 0 ± 10 | 0 ± 20 | |
|
4 |
2.80 ± 0.10 | 0.45 ± 0.10 | 31.0 ± 2.0 | 19 ± 1 | −0.90 ± 0.10 | 40 ± 5 | 0 ± 5 | 0 ± 5 | |
|
5 |
2.83 ± 0.25 | 0.10 ± 0.30 | 26.0 ± 2.0 | 30 ± 6 | 0.20 ± 0.20 | 0 ± 60 | 0 ± 10 | 0 ± 60 | |
| boronic esters | 6 | 2.79 ± 0.10 | 0.40 ± 0.15 | 26.5 ± 1.0 | 23 ± 2 | 0.30 ± 0.10 | 15 ± 75 | 0 ± 5 | 0 ± 75 |
|
7 |
2.83 ± 0.20 | 0.51 ± 0.10 | 29.8 ± 1.0 | 12 ± 2 | 0.60 ± 0.10 | 0 ± 30 | 0 ± 5 | 0 ± 30 | |
|
8 |
2.76 ± 0.20 | 0.59 ± 0.10 | 30.3 ± 1.0 | 14 ± 2 | −0.25 ± 0.10 | 25 ± 10 | 0 ± 5 | 0 ± 10 | |
|
9 |
2.66 ± 0.10 | 0.68 ± 0.10 | 30.2 ± 1.0 | 10 ± 2 | 0.40 ± 0.10 | 30 ± 15 | 0 ± 5 | 0 ± 15 | |
|
10 |
2.89 ± 0.10 | 0.37 ± 0.05 | 27.3 ± 1.0 | 30 ± 2 | 0.60 ± 0.10 | 103 ± 10 | 0 ± 5 | 0 ± 10 | |
| boric acidb | 2.85 ± 0.05 | 0.40 ± 0.10 | 19.6 ± 0.3 |
Experimental CQ, ηQ, δiso, Ω, κ, and Euler angles for each boronic acid and ester compound studied. Chemical shifts are reported with respect to solid NaBH4 at −42.06 ppm. Boric acid is included as the impurity present at 19.6 ppm in compounds 2 and 3.
The NMR parameters were included in the simulations of compounds 2 and 3 using 4 and 10% intensity relative to the main signal, respectively.
Figure 2.
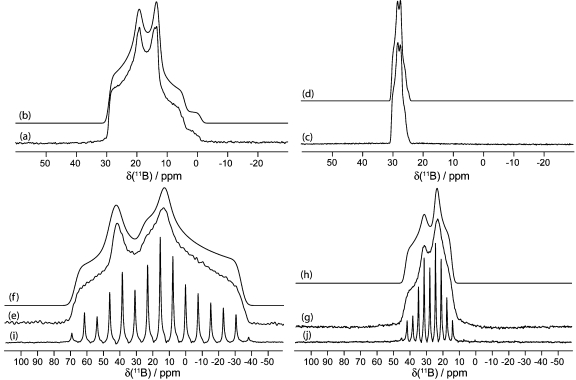
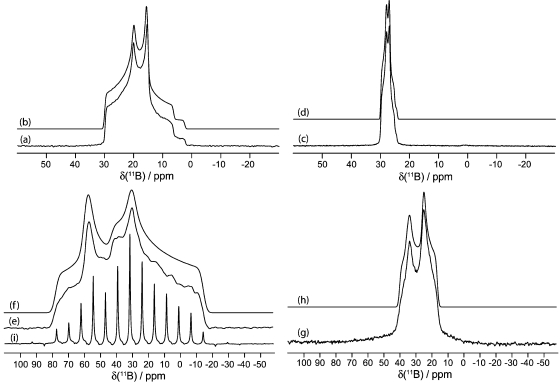
Solid-state boron-11 NMR spectroscopy of 8. Experimental spectra of a powdered sample undergoing MAS are shown in (a) 11B at 9.40 T and (c) 11B at 21.1 T. Best-fit spectra were simulated using WSolids (traces (b) and (d)) using the parameters given in Table 1. Experimental spectra of stationary powdered samples are shown in (e) 11B at 9.40 T and (g) 11B at 21.1 T. Best-fit spectra were simulated using WSolids (traces (f) and (h)) using the parameters given in Table 1. Experimental QCPMG spectra of stationary powdered samples are shown in (i) 11B at 9.40 T and (j) 11B at 21.1 T.
Figure 9.
Solid-state boron-11 NMR spectroscopy of 10. Experimental spectra of a powdered sample undergoing MAS are shown in (a) 11B at 9.40 T and (c) 11B at 21.1 T. Best-fit spectra were simulated using WSolids (traces (b) and (d)) using the parameters given in Table 1. Experimental spectra of stationary powdered samples are shown in (e) 11B at 9.40 T and (g) 11B at 21.1 T. Best-fit spectra were simulated using WSolids (traces (f) and (h)) using the parameters given in Table 1. Experimental QCPMG spectrum of a stationary powdered sample is shown in (i) 11B at 9.40 T.
A small range in CQ(11B) is observed (i.e., from 2.66 MHz for compound 9 to 3.29 MHz for compound 1). In general, the CQ(11B) values for the boronic acids tend to be slightly larger than for the esters; however, there is clearly overlap in the ranges for each class of compound (see Figure S2). An analogous statement can be made for the spans (see Figure S1). There is very little variation in the measured δiso(11B), which ranges from 26.0 ppm (compound 5) to 31.0 ppm (compound 4), that is, only about 5% of the total known range for tricoordinate boron. Because this range is so small, it is difficult to conclusively relate δiso(11B) to any single structural or electronic feature, although there is a good correlation between the experimental isotropic chemical shift values and the calculated isotropic magnetic shielding values (vide infra).
In general, the directions of the eigenvectors corresponding to V33 and δ33 are coincident within experimental error, as quantified by the Euler angle β. Overall, we find that the span is the most sensitive NMR parameter to changes in the molecular and electronic structure from compound to compound, ranging from 10 ppm (compound 9) to 40 ppm (compound 2); that is, the variation in Ω (30 ppm) represents 75% of the maximum span value (40 ppm) observed. Because the span has the largest relative variation among the NMR parameters, it is our primary focus and its relationship with the local boron electronic and molecular structure is discussed in a subsequent section.
Shown in Figure 2 are 11B SSNMR spectra of boronic ester 8 obtained at 9.40 and 21.1 T. As a representative example, we discuss in some detail these spectra and the extracted parameters. The CQ(11B) value obtained for 8 is 2.76 ± 0.20 MHz and ηQ = 0.59 ± 0.10. CSA is present and broadening is therefore observed in the spectrum due to both the quadrupolar interaction as well as CSA (Ω = 14 ± 2 ppm). The isotropic chemical shift of 30.3 ± 1.0 ppm falls within the expected range for a boronic ester.(26) For the data obtained at both magnetic fields, simulated spectra fit very well with the experimental data; hence, there are small experimental error values associated with the reported data (Table 1). The 11B NMR spectra of both MAS and stationary samples are less broad at 21.1 T. This narrowing is seen for all samples in the present work, as the broadening of the CT due to the second-order quadrupolar interaction decreases with increasing B0 and is always the case when broadening in the spectrum is dominated by the second-order quadrupolar interaction. QCPMG spectra were also obtained and each corresponding manifold of spikelets mimics the line shape of the stationary spectra. QCPMG was also used as a method of signal enhancement (vide infra).
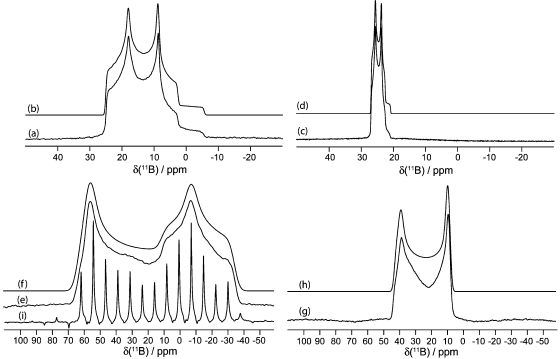
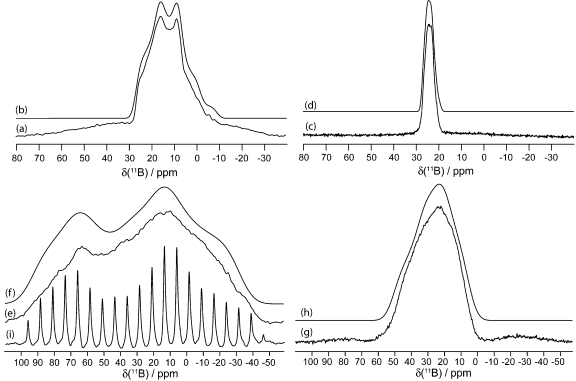
Depicted in Figures 3−9 are the 11B SSNMR spectra of compounds 1−4, 7, 9, and 10, respectively. Upon examination of the spectra it is seen that the 11B line shapes associated with the boronic acids tend to be broader than the spectra of boronic esters. This observation is associated with the fact that the boronic acids tend to have larger CQ(11B) and Ω values. In Table 1, NMR parameters are also listed for boric acid, a known decomposition product of boronic acids.(1) This decomposition product is clearly identified in compounds 2 and 3 (Figures 4 and 5) as purchased and is responsible for the peak with δiso = 19.6 ppm. In addition, spectra for compounds 1, 2, and 4 (Figures 3, 4, and 6) contain broad, low intensity features buried underneath the main signal. We speculate that these peaks are likely due to small amounts of an unknown impurity, decomposition product present in the sample, or possibly the result of less effective suppression of the signal due to boron nitride inside the stator.
Figure 3.
Solid-state boron-11 NMR spectroscopy of 1. Experimental spectra of a powdered sample undergoing MAS are shown in (a) 11B at 9.40 T and (c) 11B at 21.1 T. Best-fit spectra were simulated using WSolids (traces (b) and (d)) using the parameters given in Table 1. Experimental spectra of stationary powdered samples are shown in (e) 11B at 9.40 T and (g) 11B at 21.1 T. Best-fit spectra were simulated using WSolids (traces (f) and (h)) using the parameters given in Table 1. Experimental QCPMG spectrum of a stationary powdered sample is shown in (i) 11B at 9.40 T.
Figure 4.
Solid-state boron-11 NMR spectroscopy of 2. Experimental spectra of a powdered sample undergoing MAS are shown in (a) 11B at 9.40 T and (c) 11B at 21.1 T. Best-fit spectra were simulated using WSolids (traces (b) and (d)) using the parameters given in Table 1. Experimental spectra of stationary powdered samples are shown in (e) 11B at 9.40 T and (g) 11B at 21.1 T. Best-fit spectra were simulated using WSolids (traces (f) and (h)) using the parameters given in Table 1. The small peaks in spectra (a−d) seen at ∼1 and 19 ppm are due to boric acid, and its spectral parameters may be found in Table 1.
Figure 5.
Solid-state boron-11 NMR spectroscopy of 3. Experimental spectra of a powdered sample undergoing MAS are shown in (a) 11B at 9.40 T and (c) 11B at 21.1 T. Best-fit spectra were simulated using WSolids (traces (b) and (d)) using the parameters given in Table 1. Experimental spectra of stationary powdered samples are shown in (e) 11B at 9.40 T and (g) 11B at 21.1 T. Best-fit spectra were simulated using WSolids (traces (f) and (h)) using the parameters given in Table 1. Experimental QCPMG spectrum of a stationary powdered sample is shown in (i) 11B at 9.40 T. The small peaks in spectra (a−d) seen at ∼1 and 19 ppm are due to boric acid, and its spectral parameters may be found in Table 1.
Figure 6.
Solid-state boron-11 NMR spectroscopy of 4. Experimental spectra of a powdered sample undergoing MAS are shown in (a) 11B at 9.40 T and (c) 11B at 21.1 T. Best-fit spectra were simulated using WSolids (traces (b) and (d)) using the parameters given in Table 1. Experimental spectra of stationary powdered samples are shown in (e) 11B at 9.40 T and (g) 11B at 21.1 T. Best-fit spectra were simulated using WSolids (traces (f) and (h)) using the parameters given in Table 1.
Figure 7.
Solid-state boron-11 NMR spectroscopy of 7. Experimental spectra of a powdered sample undergoing MAS are shown in (a) 11B at 9.40 T and (c) 11B at 21.1 T. Best-fit spectra were simulated using WSolids (traces (b) and (d)) using the parameters given in Table 1. Experimental spectra of stationary powdered samples are shown in (e) 11B at 9.40 T and (g) 11B at 21.1 T. Best-fit spectra were simulated using WSolids (traces (f) and (h)) using the parameters given in Table 1. Experimental QCPMG spectrum of a stationary powdered sample is shown in (j) 11B at 21.1 T.
Figure 8.
Solid-state boron-11 NMR spectroscopy of 9. Experimental spectra of a powdered sample undergoing MAS are shown in (a) 11B at 9.40 T and (c) 11B at 21.1 T. Best-fit spectra were simulated using WSolids (traces (b) and (d)) using the parameters given in Table 1. Experimental spectra of stationary powdered samples are shown in (e) 11B at 9.40 T and (g) 11B at 21.1 T. Best-fit spectra were simulated using WSolids (traces (f) and (h)) using the parameters given in Table 1. Experimental QCPMG spectrum of a stationary powdered sample is shown in (i) 11B at 9.40 T.
Figures S10−S18 (Supporting Information) illustrate the B0 dependencies of the second-order quadrupolar interaction and CSA observed in the magnetic resonance line shape for several of the boronic acids and esters. Shown in these Figures are the stationary spectra for each compound, the corresponding best-fit analytical simulation, and a simulation where the CSA is ignored (i.e., Ω = 0 ppm). Comparing the traces where CSA is included to those where it is not for the data acquired at 9.40 T, one clearly sees that the difference between the two traces is minimal. At 21.1 T, however, the difference between the two traces is clear. This holds true for both boronic acids and esters.
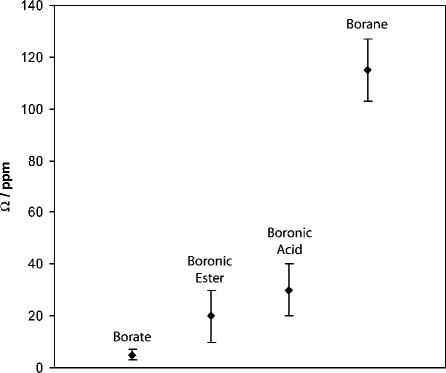
Figure 10 is a graphical representation of the measured Ω values for different trigonal planar boron bonding environments.(50) As the central boron atom is bound to more oxygen atoms and fewer carbon atoms, the experimental Ω values decrease dramatically. This trend may be rationalized by considering the atomic orbitals for each species involved. The oxygen atoms can donate electron density through lone pairs of electrons into the vacant p-orbital of the boron. As described in more detail later, the contributions to the paramagnetic portion of the total σ in the boron trigonal plane are reduced upon increasing oxygen coordination, which can explain the observed decrease in the measured Ω.(50) The boronic acids and esters have Ω values in the small/intermediate range relative to borates on the low end and boranes on the high end. Even though the spans being examined are small, they are the most characteristic NMR parameters for each compound and can successfully be related to the immediate bonding environment (Figure 10).
Figure 10.
Graphical representation of experimental Ω values for the compounds being studied (Table 1) and different borate and borane compounds.(50) Data points indicate average values for a range of compounds (boronic acids and esters) or single experimental measurements (borate and borane). The vertical bars for the boronic acid and ester data show the range of Ω for each class of compound. In the case of borane and borate, the vertical bars represent the experimental measurement error for one compound (trimesitylborane and triphenylborate).(50) As the central boron atom is bound to more oxygen atoms and fewer carbon atoms, the experimental Ω values decrease dramatically. See text for further discussion.
ii. Signal Enhancement Techniques
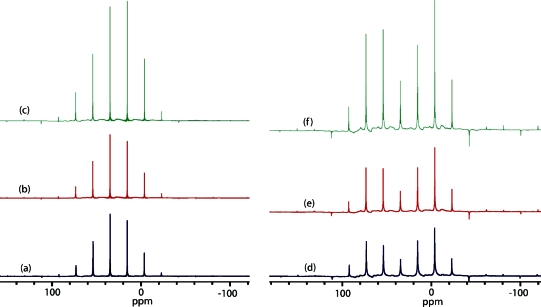
We briefly digress here to assess the effectiveness of modified-QCPMG(37) and DFS-modified-QCPMG38,39 signal enhancement techniques for boronic acids and esters. Modified-QCPMG is similar to the conventional QCPMG pulse sequence, except that the π pulses in the QCPMG echo train are replaced with π/2 pulses.(37) The sequence suppresses homonuclear dipolar coupling; hence, a longer effective T2 is observed, allowing more echoes to be acquired in the time-domain and resulting in sharper spikelets in the frequency-domain. We postulate that this sequence could be beneficial due to the large magnetogyric ratio and natural abundance of 11B. Presently, the modified-QCPMG pulse sequence results in signal enhancement factors ranging from 1.04 in compound 9 to 1.42 in compound 5, relative to the standard QCPMG pulse sequence. Similarly, the DFS modified-QCPMG pulse sequence provides signal enhancement factors ranging from 1.80 in compound 8 to a high of 2.95 in compound 5, relative to the standard QCPMG pulse sequence. As an example, shown in Figure 11 are QCPMG, modified-QCPMG, and DFS modified-QCPMG NMR spectra for a representative boronic ester (9), where signal enhancement factors of 1.04 and 2.16 are achieved. Figure 11 also presents analogous data for a representative boronic acid (3), where signal enhancement factors of 1.35 and 2.71 are obtained. Further examples of signal enhancement for additional boronic acids and esters may be found in the Supporting Information (Figures S5 to S9). Although we were able to acquire high-quality 11B SSNMR spectra without the use of these signal enhancement techniques in the present study, it is worth noting that they were successful and that they might be useful for 11B SSNMR in more dilute systems.11,51 One specific example could involve achieving signal enhancement of the 11B CT of boronic acids present in dilute quantities in systems such as modified protease inhibitors.(10)
Figure 11.
Solid-state boron NMR spectroscopy of 9 (left) and 3 (right). Experimental 11B spectra of stationary powdered samples at 9.40 T are shown in (a) and (d) using the QCPMG pulse sequence; (b) and (e) using the modified-QCPMG pulse sequence with a signal enhancement factor of 1.04 and 1.35, respectively; and (c) and (f) using the DFS modified-QCPMG pulse sequence with a signal enhancement factor of 2.16 and 2.71 respectively, relative to QCPMG. Spikelets are separated by 2500 Hz.
iii. Computational Results
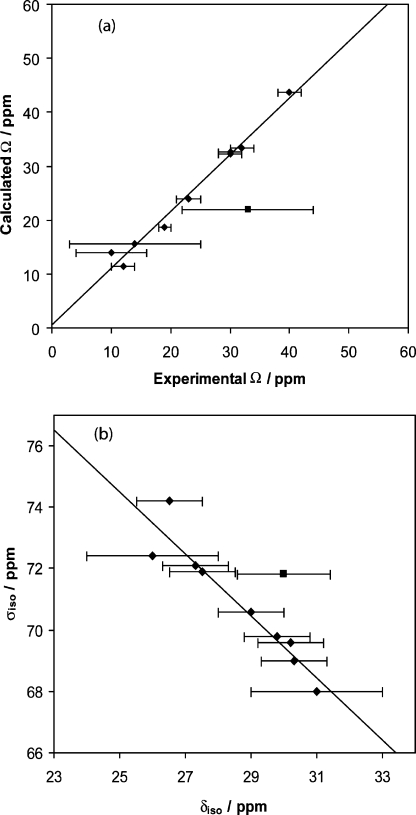
Shown in Table 2 are the boron EFG and σ tensor results calculated using B3LYP, RHF, and GGA-revPBE methods for compounds 1−10 (see also Tables S1 to S3). The GGA-revPBE calculated isotropic magnetic shielding constants are plotted against the experimental values of δiso in Figure 12. A good correlation exists between the experimental and calculated data, as quantified by a correlation coefficient of R2 = 0.9000 (excluding an outlier for boronic acid 2). The experimental spans are also best reproduced by the GGA-revPBE calculations, as quantified by a correlation coefficient of R2 = 0.9818, once one outlier is excluded (Figure 12). The outlier, corresponding to boronic acid 1, may be tentatively rationalized by considering the relatively large experimental error associated with this particular measurement.
Table 2. Calculated 11B EFG and CS Tensor Parameters for Compounds 1−10b.
| B3LYP |
RHF |
GGA-revPBE |
|||||||||
|---|---|---|---|---|---|---|---|---|---|---|---|
| sample | CQ (MHz) | ηQ | Ω (ppm) | CQ (MHz) | ηQ | Ω (ppm) | CQ (MHz) | ηQ | Ω (ppm) | dihedral (°)c | |
| boronic acids | 1 | 3.09 | 0.658 | 20.9 | 3.58 | 0.517 | 19.1 | 2.83 | 0.644 | 21.9 | 0.0 |
|
1a |
3.06 | 0.632 | 21.1 | 3.57 | 0.498 | 21.6 | 2.81 | 0.570 | 25.0 | 8.7 | |
|
2 |
3.21 | 0.402 | 40.9 | 3.66 | 0.283 | 32.9 | 2.96 | 0.383 | 43.7 | 90.0 | |
|
2a |
3.16 | 0.399 | 41.6 | 3.63 | 0.271 | 36.1 | 2.91 | 0.380 | 41.8 | 90.0 | |
|
3 |
3.03 | 0.534 | 27.9 | 3.50 | 0.406 | 19.3 | 2.81 | 0.504 | 33.4 | 28.1 | |
|
3a |
3.00 | 0.382 | 27.9 | 3.49 | 0.272 | 18.2 | 2.74 | 0.362 | 27.7 | 0.1 | |
|
4 |
2.96 | 0.482 | 17.3 | 3.48 | 0.360 | 12.6 | 2.68 | 0.447 | 18.7 | 0.0 | |
|
4a |
2.95 | 0.628 | 25.5 | 3.47 | 0.461 | 20.9 | 2.68 | 0.553 | 23.4 | 0.0 | |
|
5 |
3.07 | 0.637 | 28.2 | 3.54 | 0.436 | 17.5 | 2.84 | 0.524 | 32.6 | 36.7 | |
|
5a |
2.94 | 0.565 | 28.3 | 3.53 | 0.406 | 22.5 | 2.68 | 0.537 | 28.1 | 19.9 | |
| boronic esters | 6 | 2.93 | 0.622 | 23.1 | 3.48 | 0.470 | 17.4 | 2.62 | 0.649 | 23.9 | 0.5 |
|
7 |
3.01 | 0.548 | 15.6 | 3.57 | 0.405 | 13.0 | 2.72 | 0.545 | 11.5 | 3.0 | |
|
8 |
3.01 | 0.633 | 20.0 | 3.56 | 0.497 | 23.9 | 2.71 | 0.632 | 15.5 | 2.9 | |
|
9 |
3.03 | 0.597 | 18.2 | 3.59 | 0.453 | 17.7 | 2.73 | 0.592 | 14.0 | 1.2 | |
|
10 |
3.05 | 0.495 | 32.8 | 3.56 | 0.397 | 27.9 | 2.74 | 0.529 | 32.3 | 61.3 | |
| boric acid | 2.46 | 0.304 | 13.3 | 3.04 | 0.235 | 10.2 | 2.24 | 0.300 | 11.4 | 0.0 | |
Corresponds to boronic acid dimer.
Calculated values for boronic acid dimers which take into account hydrogen bonding interactions are included where applicable. Hybrid DFT calculations were performed using the B3LYP functional and the 6-311+G* basis set on all elements. RHF calculations were performed using the 6-311+G* basis set on all elements. ADF calculations were performed using the GGA-revPBE functional and TZP basis set on all atoms. The dihedral angle ϕCCBO is defined in Figure 13. Boric acid is included as the impurity present at 19.6 ppm in compounds 2 and 3.
Optimized with GGA-revPBE/TZP.
Figure 12.
Correlation between the calculated (ADF/GGA-revPBE) and experimental span values (a) and calculated total isotropic shielding and experimental isotropic chemical shift values (b) measured in the solid state for each boronic acid and ester studied. Ω values calculated for the monomer are plotted in all cases. Calculated isotropic shielding constants are for the dimer where applicable. Ω data ((a), diamonds) are described by a R2 value of 0.9818 and a trendline given by y = 1.0536x + 0.482. One data point for boronic acid 1 ((a), square) is not taken into account and is plotted separately. Data in part (b) (diamonds) have a R2 value of 0.9000 with a trendline given by y = −1.0117x + 99.8. One stray data point for boronic acid 2 ((b), square) is not taken into account and is plotted separately.
The GGA-revPBE-calculated values can be used to discuss the impact of hydrogen bonding, electronic substituents, and ϕCCBO on the span. The two hydroxy groups present in boronic acids are capable of engaging in intermolecular hydrogen bonding. Therefore, if hydrogen bonding interactions are present, the boronic acids being considered usually exist as dimers. Only one crystal structure exists for the compounds being studied, that of compound 4, which is a dimer.(43) Boronic acids may also exist as oligomers in the solid state, as discussed, for example, by Maly et al.52,53 We performed calculations on both boronic acid monomers and dimers to assess the impact of hydrogen bonding on the 11B NMR interaction tensors. We find that CQ(11B) generally decreases slightly in the dimers, relative to the monomers. There is no consistent trend in the change of Ω as a result of hydrogen bonding in the dimers. We attribute this observation to the fact that the value of ϕCCBO (as shown in Figure 13) of the optimized structures changes differentially from compound to compound as a result of dimerization, in addition to the simple fact that the hydroxy groups are hydrogen bonded.
Figure 13.
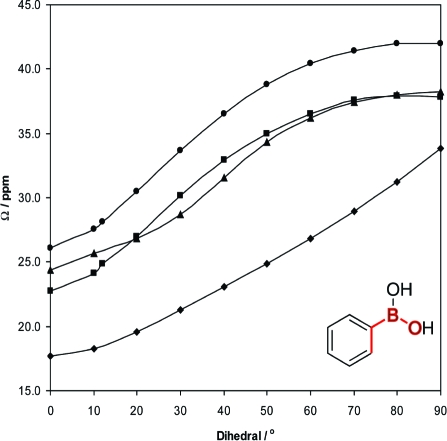
Correlation between the calculated Ω values and ϕCCBO for monomeric and dimeric forms of phenylboronic acid. Shown are results for (diamonds) Gaussian (B3LYP) monomer, (squares) Gaussian (B3LYP) dimer, (triangles) ADF (GGA-revPBE) monomer, and (circles) ADF (GGA-revPBE) dimer. Shown in red are the atoms that define ϕCCBO.
Therefore, we next studied the impact of varying ϕCCBO upon calculated Ω values. Shown in Table 2 are the GGA-revPBE optimized dihedral angles for each boronic acid and ester (see also Figure 13), where the two carbon atoms are located in the aromatic ring, and the boron and oxygen atoms are part of the boronic acid or ester functionality. As noted earlier, ϕCCBO is altered primarily by sterics, and depends on the bulkiness of nearby substituents on the aromatic ring. For example, for every boronic acid and ester possessing bulky substituents on the aromatic ring, particularly in the ortho position, the value of ϕCCBO is always much greater relative to when there is a less bulky substituent. As this angle is systematically varied, the orientations of MOs centered on boron, relative to the aromatic ring, change accordingly. An examination of the correlation between experimental and calculated spans (Figure 12) suggested a potential relationship between ϕCCBO and both the experimental and calculated Ω values. Previous work by Zhang et al. reported a dependence of the computed energy of boronic acids on this dihedral angle.(54) A plot of the value of Ω as a function of the calculated value of ϕCCBO for each compound reveals no clear and direct correlation, which is not surprising, as there are several variables changing simultaneously. For example, boronic acids have hydrogen bonding interactions taking place whereas the esters do not; the aromatic substituents are different on the various compounds, and the dihedral angle changes primarily due to sterics. To determine if there is an underlying fundamental correlation between span and ϕCCBO, phenylboronic acid was chosen as a model system. The structures of both the phenylboronic acid monomer and dimer were optimized computationally. The value of ϕCCBO was then systematically altered from 0 to 90° in 10° steps. For each ϕCCBO, spans were calculated using both B3LYP and GGA-revPBE density functional methods. The resulting variations of the spans with dihedral angle are shown in Figure 13. Two important conclusions may be drawn: (i) for all four data sets, there is a distinct positive correlation between Ω and ϕCCBO; (ii) in all cases, the Ω values are smaller for the phenylboronic acid monomer than for the dimer. It is clear that calculations predict that the presence of the hydrogen bonding interaction results in an increased span. The calculated variation of the span results from small changes (on the order of 1−5 ppm) in the values of the principal components of the magnetic shielding tensor as a result of hydrogen bonding. In no case do the calculations imply that the span varies because of the unilateral change of a single component (see Table S6). It is the combination of these small changes, specifically in σ11 and σ33, rather than a significant change in a single principal component, which leads to variation in the Ω values. The σ33 values become slightly larger, and the σ11 values become smaller, resulting in an increased span overall.
iv. MO Analysis of Boron Shielding Tensors
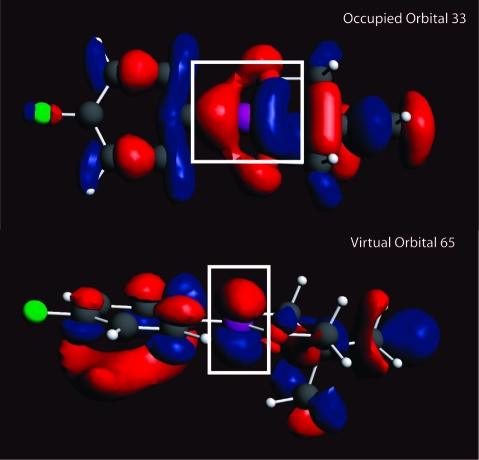
GGA-revPBE calculations for the phenylboronic acid monomer were used to compile shielding tensor magnitude and orientation information at each ϕCCBO. Not surprisingly, the eigenvector corresponding to σ33 remains nearly perpendicular to the boron bonding plane. For phenylboronic acid, σ33 is calculated to intersect the boron bonding plane at an angle ranging from 76 to 90°, depending on the value of ϕCCBO. In addition, for boronic acids and esters 1−10, σ33 remains perpendicular (within 18°) to the boron bonding plane. (Compound 4 is an exception to this rule with σ22 being perpendicular, although compound 4 is also unique in the sense that it is a boronic acid monoester). To relate the MOs to the observed and calculated Ω values, the individual MO contributions to total shielding must first be examined. As previously mentioned, magnetic shielding may be partitioned into σdia and σpara components.28−30 As conventionally partitioned, the paramagnetic shielding term is often the dominant term that contributes to shielding tensor anisotropy.28−30 Consider an occupied MO with strong p character centered on boron. If virtual rotation of this orbital by 90° produces a favorable overlap with a virtual p orbital of the boron atom, the situation results in paramagnetic contributions to the component along the axis of virtual rotation.(50) Consider the action of the angular momentum operator (eq 8) on a given MO wave function that can account for contributions to paramagnetic shielding due to orbital overlap between occupied and virtual states. The action that this angular momentum operator has on a p-character orbital, which is the case for the boron compounds being examined, can be visualized as a 90° rotation of the occupied orbital. If σpara is the dominant contributor to shielding anisotropy, we anticipate that there should be a relationship between the observed Ω and the MOs involved in mixing. To assist in visualization of this concept, consider the pair of MOs which give the greatest contributions to σpara for compound 6 (Figure 14).
Figure 14.
Occupied orbital 33 (HOMO-7) and virtual orbital 65 (LUMO+24) for compound 6. These are the two orbitals involved in mixing which yield the largest contribution to total isotropic σpara. Note the orbital overlap between a 90° virtual rotation of occupied orbital 33 out of the plane of the page and virtual orbital 65. This leads to a paramagnetic shielding contribution along the axis of rotation.
Interestingly, however, when considering compounds 1−10, there is no clear correlation between span and orbital energy gap between the occupied and virtual states that give the largest contribution to the total isotropic σpara. There is also no obvious correlation between the span and total isotropic σpara. From compound to compound, different effects need to be considered, including: hydrogen bonding, ϕCCBO, and varying electronics of the different substituents on the aromatic ring. It is likely a composite of these different effects that clouds the relationship between Ω and orbital energy gap or total isotropic σpara.
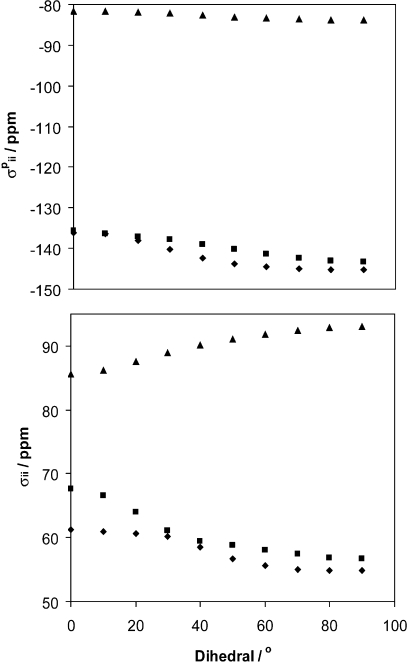
When considering our model phenylboronic acid monomer system, there is a clear correlation between Ω and total isotropic σpara. In addition, when the same pair of occupied and virtual MOs are considered from compound to compound, as the orbital energy gap decreases, the span values increase, which is the expected correlation when the span is dominated by σpara. Both the paramagnetic shielding tensor components as well as the total magnetic shielding components are plotted against ϕCCBO in Figure 15. As ϕCCBO increases from 0 to 90°, the separation between σ11 and σ33 increases, which equates to an increasing span (eq 3). In the plot where the contributions to paramagnetic shielding are plotted against ϕCCBO, the paramagnetic contribution to σ11 becomes increasingly negative with increasing dihedral while the paramagnetic contribution to σ33 also decreases slightly. As a consequence of the paramagnetic contribution to σ11 becoming increasingly negative, the total isotropic σpara will become more negative and the span will increase. However, a plot of total magnetic shielding against ϕCCBO reveals that σ11 shifts in the negative direction, while σ33 becomes more positive as ϕCCBO increases. Consequently, we conclude that diamagnetic shielding contributions play a non-negligible role in determining the span values observed. Numerical values are tabulated in the Supporting Information (see Tables S4 and S5).
Figure 15.
Plot of the ADF/GGA-revPBE calculated total magnetic shielding tensor components (bottom) and total isotropic σpara tensor components (top) versus ϕCCBO for phenylboronic acid. The three data sets on each plot represent σ11 (diamonds), σ22 (squares), and σ33 (triangles).
v. Effect of Substituents
Due to the demonstrated importance of diamagnetic shielding, a brief study was conducted to determine the effects of strong and mild electron-donating and withdrawing groups on the boron shielding tensor. Phenylboronic acid was used as a control molecule, and a steric group (bromine), a mild electron-donating group (carboxylic acid ester), a strong electron-donating group (amine), a mild electron-withdrawing group (carboxyl), and a strong electron-withdrawing group (nitro) were each substituted in the ortho, meta, and para positions of the aromatic ring. Data are tabulated in the Supporting Information (see Table S9). While changes in the isotropic shielding constant are small for all substituents, we find that the presence of electron-withdrawing groups correlates with increases in the calculated Ω values (up to 13.5 ppm), whereas electron-donating groups have less of an effect on the calculated Ω values. For both shifts in σ11 in the negative direction which increase Ω, and shifts in σ11 in the positive direction which decrease Ω, in general, it was σ11 that had the largest change in magnitude as a result of substitution. These results are logical since tricoordinate boron compounds that feature boron atoms bound to multiple oxygen atoms have smaller observed Ω values due to the lone pairs on the oxygen donating electron density to a virtual MO centered on the boron atom.(50)
Conclusions
In this study, 11B CS and EFG tensor information was successfully extracted from the 11B SSNMR spectra acquired for 10 boronic acids and esters. Signal enhancement techniques were successfully applied and enhancement factors of up to 1.42 were achieved for modified-QCPMG, whereas factors of 1.80−2.95 were achieved for DFS modified-QCPMG, relative to the QCPMG sequence alone. The CQ and Ω values were found to be larger, on average, for boronic acids than for esters. For the five boronic acids, the span has an average value of 30.8 ppm, while for the five boronic esters, the average value is 17.8 ppm. In the case of 11B quadrupolar coupling constants, the average value is 3.0 MHz for the boronic acids and 2.8 MHz for the boronic esters. The ranges associated with CQ and δiso are small relative to their absolute magnitudes from compound to compound. However, the CS tensor span exhibits a significant relative range (75%) and is the NMR parameter most characteristic of the molecular and electronic structure for the compounds studied. It has been advantageous to acquire data at high magnetic field strength as the effects of CSA could be more precisely quantified.
Good correlation between experimental and GGA-revPBE calculated spans as well as between the calculated isotropic shielding and experimental chemical shift values was observed. The span was shown to be positively correlated with ϕCCBO in a model boronic acid over the range of 0−90 degrees. This is true regardless of whether hydrogen bonding is taking place, although Ω does not increase as steeply with ϕCCBO when hydrogen bonding is occurring. The hydrogen bonding interaction is correlated with a decrease in the total paramagnetic contribution to the isotropic magnetic shielding and a decrease in the span. Contrary to the situation typically seen for larger spans, the diamagnetic part of the shielding tensor was shown to play a key role in explaining the observed trends in CSA. Finally, the presence of an electron-withdrawing group substituted on a model boronic acid resulted in an increase in the calculated Ω. We have shown that the boron chemical shift tensor in boronic acids, and particularly the span of the CS tensor, is governed by a delicate interplay of several competing factors, including hydrogen bonding, dihedral angle, and the various electron-donating or withdrawing substituents bound to the aromatic ring. We speculate, therefore, that future 11B SSNMR experiments performed on similar materials will be most beneficial in comparative studies, where specific individual changes in structure may be probed and characterized.
Acknowledgments
We are grateful to Dr. Glenn Facey, Dr. Victor Terskikh, and Dr. Eric Ye for technical assistance and helpful comments. D.L.B. thanks the Natural Sciences and Engineering Research Council (NSERC) of Canada and the Canada Foundation for Innovation for generous funding. Access to the 900 MHz NMR spectrometer was provided by the National Ultrahigh-Field NMR Facility for Solids (Ottawa, Canada), a national research facility funded by the Canada Foundation for Innovation, the Ontario Innovation Trust, Recherche Québec, the National Research Council Canada, and Bruker Biospin and managed by the University of Ottawa (www.nmr900.ca). NSERC is acknowledged for a Major Resources Support grant. Thanks to Professor K. Maly for helpful discussions. ADF calculations were carried out using the High Performance Computing Virtual Laboratory.
Supporting Information Available
Figures showing: correlation between 11B boronic acid and ester spans and ϕCCBO; 11B spans and CQ as a function of local boron bonding; relationship between span and σpara; additional QCPMG signal enhancement examples; additional spectra demonstrating the effects of CSA at higher magnetic field; tables summarizing contributions to paramagnetic, diamagnetic, and isotropic shielding; summary of the calculated shielding tensor components for each compound; selected occupied and virtual orbitals responsible for contributions to σpara. This material is available free of charge via the Internet at http://pubs.acs.org.
Supplementary Material
References
- Hall D. G.Boronic Acids. Preparation and Applications in Organic Synthesis and Medicine; Wiley-VCH: Weinheim, 2005. [Google Scholar]
- Sakai M.; Hayashi H.; Miyaura N. Organometallics 1997, 16, 4229–4231. [Google Scholar]
- Takaya Y.; Ogasawara M.; Hayashi T.; Sakai M.; Miyaura N. J. Am. Chem. Soc. 1998, 120, 5579–5580. [Google Scholar]
- Kettner C.; Mersinger L.; Knabb R. J. Biol. Chem. 1990, 265, 18289–18297. [PubMed] [Google Scholar]
- Spencer J.; Burd A. P.; Goodwin C. A.; Mérette S. A. M.; Scully M. F.; Adatia T.; Deadman J. J. Tetrahedron 2002, 58, 1551–1556. [Google Scholar]
- Strynadka N. C. J.; Adachi H.; Jensen S. E.; Johns K.; Sielecki A.; Betzel C.; Sutoh K.; James M. N. G. Nature 1992, 359, 700–705. [DOI] [PubMed] [Google Scholar]
- Flentke G. R.; Munoz E.; Huber B. T.; Plaut A. G.; Kettner C. A.; Bachovchin W. W. Proc. Natl. Acad. Sci. U. S. A. 1991, 88, 1556–1559. [DOI] [PMC free article] [PubMed] [Google Scholar]
- Dunsdon R. M.; Greening J. R.; Jones P. S.; Jordan S.; Wilson F. X. Bioorg. Med. Chem. Lett. 2000, 10, 1577–1579. [DOI] [PubMed] [Google Scholar]
- Bukhtiyarova M.; Rizzo C. J.; Kettner C. A.; Korant B. D.; Scarnati H. T.; King R. W. Antiviral Chem. Chemother. 2002, 12, 367–373. [DOI] [PubMed] [Google Scholar]
- Hiratake J.; Oda J. Biosci. Biotech. Biochem. 1997, 61, 211–218. [Google Scholar]
- Yang W.; Gao X.; Wang B. Med. Res. Rev. 2003, 23, 346–368. [DOI] [PubMed] [Google Scholar]
- Miyaura N.; Suzuki A. Chem. Rev. 1995, 95, 2457–2483. [Google Scholar]
- Suzuki A. J. Organomet. Chem. 1999, 576, 147–168. [Google Scholar]
- Al-Zoubi R. M.; Marion O.; Hall D. G. Angew. Chem., Int. Ed. 2008, 47, 2876–2879. [DOI] [PubMed] [Google Scholar]
- Côté A. P.; Benin A. I.; Ockwig N. W.; O’Keeffe M.; Matzger A. J.; Yaghi O. M. Science 2005, 310, 1166–1170. [DOI] [PubMed] [Google Scholar]
- El-Kaderi H. M.; Hunt J. R.; Mendoza-Cortés J. L.; Côté A. P.; Taylor R. E.; O’Keeffe M.; Yaghi O. M. Science 2007, 316, 268–272. [DOI] [PubMed] [Google Scholar]
- Rambo B. M.; Lavigne J. J. Chem. Mater. 2007, 19, 3732–3739. [Google Scholar]
- Korich A. L.; Iovine P. M. Dalton Trans. 2010, 39, 1423–1431. [DOI] [PubMed] [Google Scholar]
- Adamczyk-Woüniak A.; Cyrański M. K.; Jakubczyk M.; Klimentowska P.; Koll A.; Kołodziejczak J.; Pojmaj G.; Żubrowska A.; Żukowska G. Z.; Sporzyński A. J. Phys. Chem. A 2010, 114, 2324–2330. [DOI] [PubMed] [Google Scholar]
- Sweet W. H.; Javid M. J. Neurosurg. 1952, 9, 200–209. [DOI] [PubMed] [Google Scholar]
- Srivastava R. R.; Kabalka G. W. J. Org. Chem. 1997, 62, 8730–8734. [DOI] [PubMed] [Google Scholar]
- Hawthorne M. F. Mol. Med. Today 1998, 4, 174–181. [DOI] [PubMed] [Google Scholar]
- Valliant J. F.; Schaffer P. J. Inorg. Biochem. 2001, 85, 43–51. [DOI] [PubMed] [Google Scholar]
- Harris R. K.; Becker E. D.; Cabral de Menezes S. M.; Granger P.; Hoffman R. E.; Zilm K. W. Pure Appl. Chem. 2008, 80, 59–84. [Google Scholar]
- Pyykkö P. Mol. Phys. 2008, 106, 1965–1974. [Google Scholar]
- Nöth H.; Wrackmeyer B.. Nuclear Magnetic Resonance Spectroscopy of Boron Compounds; Springer-Verlag: Berlin, 1978. [Google Scholar]
- Kennedy J. D. In Multinuclear NMR; Mason J., Ed.; Plenum Press: New York, 1987; Ch 8. [Google Scholar]
- Ramsey N. F. Phys. Rev. 1950, 77, 567. [Google Scholar]
- Ramsey N. F. Phys. Rev. 1950, 78, 699–703. [Google Scholar]
- Grutzner J. B. In Recent Advances in Organic NMR Spectroscopy; Lambert J. B., Rittner R., Eds.; Norell Press: Landisville, 1987; Ch 2. [Google Scholar]
- Mason J. Solid State Nucl. Magn. Reson. 1993, 2, 285–288. [DOI] [PubMed] [Google Scholar]
- Amoureux J. P.; Fernandez C.; Granger P. In Multinuclear Magnetic Resonance in Liquids and Solids — Chemical Applications, NATO ASI Series C; Granger P.; Harris R. K., Eds.; Kluwer Academic Publishers: Dordrecht, 1990; Vol. 322, Ch XXII. [Google Scholar]
- Hayashi S.; Hayamizu K. Bull. Chem. Soc. Jpn. 1989, 62, 2429–2430. [Google Scholar]
- Freude D.; Haase J. NMR Basic Princ. Prog. 1993, 29, 1. [Google Scholar]
- Hahn E. L. Phys. Rev. 1950, 80, 580–594. [Google Scholar]
- Larsen F. H.; Jakobsen H. J.; Ellis P. D.; Nielsen N. C. J. Phys. Chem. A 1997, 101, 8597–8606. [Google Scholar]
- Siegel R.; Nakashima T. T.; Wasylishen R. E. J. Phys. Chem. B 2004, 108, 2218–2226. [Google Scholar]
- Schurko R. W.; Hung I.; Widdifield C. M. Chem. Phys. Lett. 2003, 379, 1–10. [Google Scholar]
- Siegel R.; Nakashima T. T.; Wasylishen R. E. Concepts Magn. Reson. Part A 2005, 26A, 62–77. [Google Scholar]
- Massiot D.; Fayon F.; Capron M.; King I.; Le Calvé S.; Alonso B.; Durand J.-O.; Bujoli B.; Gan Z.; Hoatson G. Magn. Reson. Chem. 2002, 40, 70–76. [Google Scholar]
- Eichele K.; Wasylishen R. E.. WSOLIDS NMR Simulation Package, version 1.17.30; Dalhousie University: Halifax, 2001. [Google Scholar]
- Alderman D. W.; Solum M. S.; Grant D. M. J. Chem. Phys. 1986, 84, 3717–3725. [Google Scholar]
- Zhdankin V. V.; Persichini III P. J.; Zhang L.; Fix S.; Kiprof P. Tetrahedron Lett. 1999, 40, 6705–6708. [Google Scholar]
- Becke A. D. J. Chem. Phys. 1993, 98, 5648–5652. [Google Scholar]
- Rettig S. J.; Trotter J. Can. J. Chem. 1977, 55, 3071–3075. [Google Scholar]
- Frisch M. J.; Trucks G. W.; Schlegel H. B.; Scuseria G. E.; Robb M. A.; Cheeseman J. R.; Montgomery J. A. Jr.; Vreven T.; Kudin K. N.; Burant J. C.; Millam J. M.; Iyengar S. S.; Tomasi J.; Barone V.; Mennucci B.; Cossi M.; Scalmani G.; Rega N.; Petersson G. A.; Nakatsuji H.; Hada M.; Ehara M.; Toyota K.; Fukuda R.; Hasegawa J.; Ishida M.; Nakajima T.; Honda Y.; Kitao O.; Nakai H.; Klene M.; Li X.; Knox J. E.; Hratchian H. P.; Cross J. B.; Bakken V.; Adamo C.; Jaramillo J.; Gomperts R.; Stratmann R. E.; Yazyev O.; Austin A. J.; Cammi R.; Pomelli C.; Ochterski J. W.; Ayala P. Y.; Morokuma K.; Voth G. A.; Salvador P.; Dannenberg J. J.; Zakrzewski V. G.; Dapprich S.; Daniels A. D.; Strain M. C.; Farkas O.; Malick D. K.; Rabuck A. D.; Raghavachari K.; Foresman J. B.; Ortiz J. V.; Cui Q.; Baboul A. G.; Clifford S.; Cioslowski J.; Stefanov B. B.; Liu G.; Liashenko A.; Piskorz P.; Komaromi I.; Martin R. L.; Fox D. J.; Keith T.; Al-Laham M. A.; Peng C. Y.; Nanayakkara A.; Challacombe M.; Gill P. M. W.; Johnson B.; Chen W.; Wong M. W.; Gonzalez C.; Pople J. A.. Gaussian 03, rev. B.03 and C.02; Gaussian, Inc.: Wallingford, CT, 2004. [Google Scholar]
- te Velde G.; Bickelhaupt F. M.; Baerends E. J.; Fonseca Guerra C.; van Gisbergen S. J. A.; Snijders J. G.; Ziegler T. J. Comput. Chem. 2001, 22, 931–967. [Google Scholar]
- Adiga S.; Aebi D.; Bryce D. L. Can. J. Chem. 2007, 85, 496–505. [Google Scholar]
- Mills I.; Cvitaš T.; Homann K.; Kallay N.; Kuchitsu K.. Quantities, Units and Symbols in Physical Chemistry, 2nd ed.; International Union of Pure and Applied Chemistry Physical Chemistry Division, Blackwell Science: Oxford, 1993. [Google Scholar]
- Bryce D. L.; Wasylishen R. E.; Gee M. J. Phys. Chem. A 2001, 105, 3633–3640. [Google Scholar]
- Ivanov D.; Redfield A. G. J. Magn. Reson. 2004, 166, 19–27. [DOI] [PubMed] [Google Scholar]
- Maly K. E.; Malek N.; Fournier J.-H.; Rodríguez-Cuamatzi P.; Maris T.; Wuest J. D. Pure Appl. Chem. 2006, 78, 1305–1321. [Google Scholar]
- Maly K. E.; Maris T.; Wuest J. D. CrystEngComm 2006, 8, 33–35. [Google Scholar]
- Zhang J.; Cai S.; Chen Z. Magn. Reson. Chem. 2009, 47, 629–634. [DOI] [PubMed] [Google Scholar]
Associated Data
This section collects any data citations, data availability statements, or supplementary materials included in this article.


