

Abstract
Two subspecies of Francisella tularensis are recognized: F. tularensis subsp. tularensis (type A) and F. tularensis subsp. holartica (type B). Type A has been subdivided further into A1a, A1b, and A2, which differ geographically and clinically. The aim of this work was to determine whether or not differences among subspecies and clades translate into distinct ecological niches. We used 223 isolates from humans and wildlife representing all six genotypes (type A, B, A1, A2, A1a, or A1b). Ecological-niche models were built independently for each genotype, using the genetic algorithm for rule-set prediction. The resulting models were compared using a non-parametric multivariate analysis-of-variance method. A1 and A2 are ecologically distinct, supporting the previously observed geographic division, whereas ecological niches for types A and B overlapped notably but A1a and A1b displayed no appreciable differences in their ecological niches.
Introduction
Tularemia is a widespread but uncommon disease caused by Francisella tularensis.1 In animals, it is associated with sudden die offs of lagomorph and rodent populations. Humans become infected in several ways, including receiving arthropod bites, handling infected animal tissues, ingesting contaminated food or water, and inhaling contaminated aerosols. Clinical manifestations of human infection range from indolent skin ulcers to life-threatening pneumonia.2,3
F. tularensis has been divided into subspecies and clades based on phenotypic and genetic features. Two subspecies are recognized as principal causes of human tularemia: F. tularensis subspecies tularensis (herein referred to as type A) and F. tularensis subspecies holarctica (herein referred to as type B).1 Molecular typing methods have been used to divide type A isolates into two clades, called A1 and A2.4–6 More recently, A1 isolates have been separated into two clades, A1a and A1b, based on data from pulsed-field gel electrophoresis (PFGE) and global single nucleotide polymorphism (SNP) analysis.7,8
Although tularemia is known to occur throughout the Northern Hemisphere, F. tularensis subspecies and clades differ with respect to their geographic distribution and severity of infection. Whereas type B strains occur throughout the Holarctic region, type A strains seem restricted to North America.1,9 Within the United States, A1 (A1a and A1b) strains occur primarily in Eastern states, whereas A2 strains have been found exclusively in Western states.4,5,7 Human illness associated with infections caused by type B, A2, A1a, or A1b strains differs markedly with respect to mortality: A1b infections are associated with significantly higher mortality (24%) than infections caused by A1a (4%), A2 (0%), and type B (7%).7
The purpose of this analysis was to compare F. tularensis subspecies (type A and type B) and clades (A1, A2, A1a, A1b) across the United States, in terms of coarse-scale ecological parameters, to determine whether or not the apparent differences in geographic distributions and clinical severity translate into distinct ecological niches. We test the hypothesis that F. tularensis subspecies and clades occur under distinct ecological regimens, which may prove useful in understanding host and environmental associations, modes of transmission, and other dynamics.
Materials
Input data.
F. tularensis isolates (N = 223) from 35 states recovered during 1964–2004 (humans) and 1963–2005 (animals; summarized in Table 1), for which case-exposure locations were specified to the county level or finer (see below), were used for the input occurrence dataset. Isolates were differentiated as type A or type B by glycerol fermentation (Biolog Inc., Hayward, CA) and as A1a, A1b, or A2 by PFGE subtyping with PmeI as described previously.4,7
Table 1.
Numbers of human and animal F. tularensis isolates analyzed by genotype and the precision of geographic referencing grouped by state
| State | A | B | A1 | A2 | A1a | A1b |
|---|---|---|---|---|---|---|
| Arkansas | 11 | 11 | 7 | 3 | ||
| Arizona | 4 | 2 (2) | 4 | |||
| California | 5 | 6 (5) | 4 | 1 | 1 | 3 |
| Colorado | 33 (15) | 12 (11) | 1 | 32 (15) | 1 | |
| Delaware | 2 | 2 | 2 | |||
| Georgia | 3 | 3 | 1 | 2 | ||
| Iowa | 1 | 1 | 1 | |||
| Idaho | 1 | 1 | 1 | |||
| Illinois | 2 | 1 | 2 | 2 | ||
| Indiana | 1 | 2 (1) | 1 | 1 | ||
| Kansas | 14 (12) | 1 (1) | 14 (12) | 7 (7) | 7 (5) | |
| Kentucky | 1 | 6 | 1 | 1 | ||
| Louisiana | 6 | 6 | 2 | 3 | ||
| Massachusetts | 4 (1) | 4 (1) | 1 | 3 (1) | ||
| Maryland | 3 (1) | 3 (1) | 1 | 2 (1) | ||
| Michigan | 1 | 1 | 1 | |||
| Missouri | 5 | 1 | 5 | 5 | ||
| Mississippi | 2 | 1 | 2 | 2 | ||
| North Carolina | 1 | 1 | ||||
| North Dakota | 1 | |||||
| Nebraska | 3 (1) | 3 (1) | 3 (1) | |||
| New Jersey | 1 | 1 | 1 | |||
| New Mexico | 14 (6) | 14 (6) | ||||
| Nevada | 3 (1) | 3 (1) | ||||
| New York | 5 (3) | 1 | 5 (3) | 5 (3) | ||
| Ohio | 1 | 1 | 1 | |||
| Oklahoma | 10 | 10 | 7 | 3 | ||
| Oregon | 5 | 6 (5) | 5 | |||
| Pennsylvania | 1 (1) | 1 (1) | 1 (1) | |||
| South Dakota | 3 | 5 (4) | 3 | |||
| Texas | 3 | 3 | 2 | 1 | ||
| Utah | 7 | 7 | ||||
| Virginia | 7 | 7 | 1 | 6 | ||
| Washington | 1 | |||||
| Wyoming | 12 (3) | 2 | 12 (3) | |||
| Total | 175 | 48 | 97 | 78 | 50 | 44 |
Numbers in parentheses show the number of isolates with geographic localities more specific than county. Note that genotypes are not exclusive: A1a and A1b are part of the A1 genotype, and A1 and A2 make up the A genotype.
Isolate occurrence data were available at two general levels of spatial resolution. For most isolates, the location at which the human or animal likely acquired F. tularensis was specified only to county. For ~25% of isolates, however, more specific locations were available (Table 1). For county-level data, the exposure site within the county is unknown, so these data were included in analyses by creating 25 random points within the county.10 For the more precisely described locations, we plotted a circle of a radius reflecting the approximate dimensions of the location described and again plotted 25 random points within that circle (Figure 1). Hence, in total, we developed 25 data sets for each of six tularemia genotypes (A, B, A1, A2, A1a, A1b); the random points within the polygons reflected the precision of knowledge, permitting us to take into account uncertainty in georeferencing when developing ecological-niche models.
Figure 1.
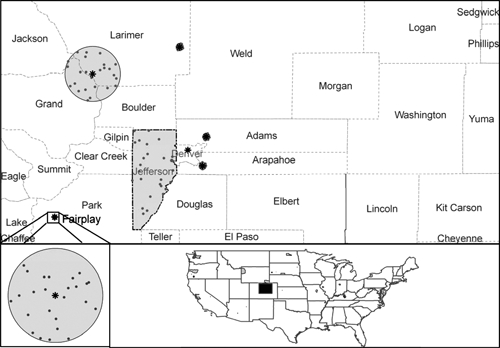
Illustration of methodology used to account for variable precision in geographic referencing of F. tularensis isolates for ecological-niche models. Each isolate is assigned a polygon, which may be the irregular polygon corresponding to a county (top; Jefferson County) or a circle representing the approximate precision of the textual description of the occurrence site (inset, bottom left). Stars indicate the center of these latter sites; black dots show the random points used to create ecological-niche models. The geographic location of the region illustrated in the top panel is shown on the bottom right in relation to the United States.
Environmental data.
We used global climate summaries from the Intergovernmental Panel on Climate Change (IPCC11), which represent interpolations among weather stations globally for the period 1961–1990. The following variables were included in model development: ground frost days, diurnal temperature range, mean annual temperature, annual precipitation, solar radiation, wet-day frequency, maximum temperature, minimum temperature, and vapor pressure; native spatial resolution was 0.5°. To enrich models further, we included variables summarizing topographic characteristics, including elevation, slope, aspect, and compound topographic index with a native spatial resolution of 0.05° (http://usgs.eros.gov).12 To match resolution of the environmental data to the resolution of the isolate occurrence data available, we resampled all environmental variables to an intermediate spatial resolution of 0.1°.
Methods
Ecological-niche modeling.
We used the Genetic Algorithm for Rule-Set Prediction (GARP) to estimate ecological niches. This algorithm searches for non-random associations between environmental variables and occurrence data, as contrasted with environmental characteristics of the overall study area.13,14 The algorithm first creates a set of rules based on four basic types (bioclimatic rules, atomic rules, negated range rules, and logistic regression rules), the performance of which is then evaluated through independent subsets of presence points; predictive accuracy is calculated for each rule, and rules with the highest predictive accuracy are retained in the model. In the next step, rules are perturbed randomly, and predictive accuracy for every rule and combination of rules is reevaluated; changes that improve rule fitness are retained as part of a next generation of rules. This process is repeated up to a maximum number of iterations (1,000 in this case) or until fitness values no longer change appreciably (convergence parameter of 1%).
To take model-to-model variation into account, we developed 100 replicate models for each of the 150 datasets (i.e., 25 random representative sets × 6 genotypes). From each set of 100 replicate models, the 10 models that omitted the lowest number of points from the testing data set were selected. The median proportional area predicted across these models was calculated, and the model showing lowest deviation from the median value was selected.15 Finally, we combined the 25 resulting models for each genotype by summing them, pixel by pixel, to produce final estimates of potential distributions; values 0–25 represent model agreement from complete agreement in prediction of absence (value = 0) to complete agreement in predicting potential for presence (value = 25).
Ecological-niche comparisons.
To simplify the model-agreement surfaces produced, we focused on areas of complete model agreement (value = 25) as areas of predicted presence. To permit visualization of model predictions in ecological dimensions, model predictions were combined with the base environmental layers (see above) for each genotype, producing a table of unique combinations of environmental variables with the associated prediction from the niche model. Pairs of variables were plotted against each other and against the range of conditions across the United States to contrast genotype niches (i.e., A versus B, A1 versus A2, and A1a versus A1b).
To test niche identity among genotypes, we implemented a nonparametric multivariate analysis of variance (MANOVA), in which variances between and within groups are calculated as the sum of squares (SSA and SSW) of distances in multivariate space. We then calculated a pseudo-F statistic using earlier suggestions.16 The pseudo-F approach incorporates bootstrapping to produce a random selection of environmental conditions for each genotype on which to base calculations of statistical significance; we created random subsamples of 1,000 environmentally unique combinations for each F. tularensis genotype, and the pseudo-F was calculated as Fobs = [SSA/(a − 1)]/[SSW/(N − a)], where a is the number of groups and N is the total number of observations. Environmental combinations were then assigned randomly to two new groups of 1,000 combinations, and another pseudo-F (Frand) was calculated. This random assignment was repeated 10,000 times, and the Frand values were averaged for all iterations (F*). In total, we repeated the subsample process 30 times with 10,000 random group assignments for each subsample. Comparisons of observed Fobs with the distribution of Frand were used to estimate statistical significance, and we plotted the F*/Fobs ratio against the corresponding Fobs to visualize niche similarity and difference.
Results
Potential distributions for F. tularensis subspecies and clades across the United States, as predicted by ecological-niche models (Figure 2), showed that predicted distributions of the two subspecies (types A and B) overlap broadly and cover much of the country. A subtle difference is that type B has a somewhat more northerly distribution than type A. Type B is predicted absent from the southern states of Louisiana, Mississippi, Georgia, South Carolina, and Florida. Conversely, type A is predicted absent from the northern states of Maine, Vermont, and New Hampshire as well as Northern New York, Michigan, and Minnesota. Type B is also predicted to have a more patchy distribution in the Western compared with the Eastern United States.
Figure 2.
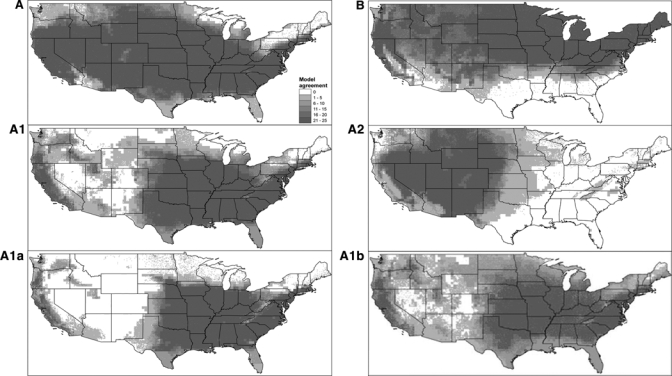
Potential distribution maps for six tularemia genotypes in the United States. White indicates predicted absence, whereas darker shades correspond to higher model agreement in predictions of potential for presence among the 25 replicate models.
At the clade level, distributions predicted for A1 and A2 contrast sharply. A1 is distributed largely in the Central to Southeastern United States with predicted areas of distribution also in California, Oregon, Northern Utah, and Western Idaho, whereas A2 is concentrated in the Western United States, excepting some regions of Southern Arizona, Western California, Western Oregon, Washington, and Northern Idaho. Finally, A1a and A1b are both predicted to occur across the Central and Southeastern United States, plus California, Oregon, Northern Utah, and Western Idaho.
Histograms summarizing the modeled distributions of F. tularensis subspecies and clades relative to selected environmental and topographical factors (Figure 3) show broad overlap in most variables (annual precipitation, slope, topographic index, diurnal temperature range, minimum temperature, and vapor pressure) for type A and type B. Minor differences in maximum temperature, mean temperature, solar radiation, and wet-day frequency suggest that the more northerly type B distribution is linked to cooler, cloudier regions compared with type A. In contrast, the modeled distributions of A1 and A2 strains differ markedly with respect to several variables (elevation, diurnal temperature range, frost-free days, precipitation, minimum temperature, mean temperature, and vapor pressure). Compared with A1 strains, A2 strains occur at higher elevations (usually > 1,000 m) and in areas with less precipitation, lower temperatures, more ground-frost days, and lower vapor pressure. When comparing A1a and A1b strains, no appreciable difference between modeled distributions was noted with respect to any environmental or topographic variable.
Figure 3.
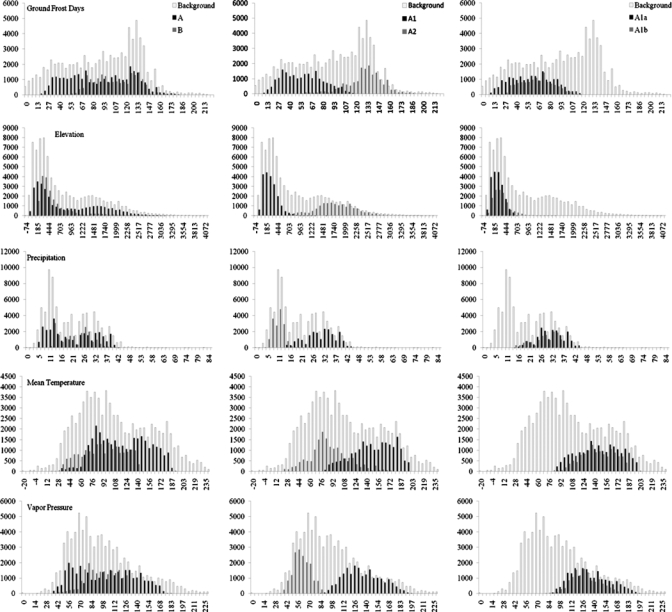
Histograms showing three paired comparisons (first column, type A versus type B; second column, A1 vs. A2; third column, A1a vs. A1b) of the frequency distribution for five environmental variables (rows).
Two-dimensional visualizations of modeled distributions with respect to environmental variables for the different subspecies and clades painted a similar picture. Again, the most dramatic ecological differences were between genotypes A1 and A2 (Figure 4, middle). Types A and B also showed only minor differences in ecological space, and broad overlap was observed between A1a and A1b.
Figure 4.
Scatter plots comparing distributions of F. tularensis genotypes in ecological space based on pairs of environmental variables. Polygons outline the distribution of the general environmental characteristics across the United States.
The MANOVA revealed similar patterns for the ecological-niche comparisons between genotypes. Plotting Fobs and F*/Fobs ratios (Figure 5), similar ecological niches are expected to fall in the upper left-hand corner of the graph, whereas more different ecological niches fall in the lower right-hand corner. It was clear that subtypes A1a and A1b had the highest values of the ratio combined with lower Fobs values, indicating negligible differentiation between them. Types A and B showed only minor differences. However, the comparison of A1 and A2 showed low values for the ratio, combined with the highest values of Fobs, pointing to highly differentiated ecological niches for these two genotypes.
Figure 5.
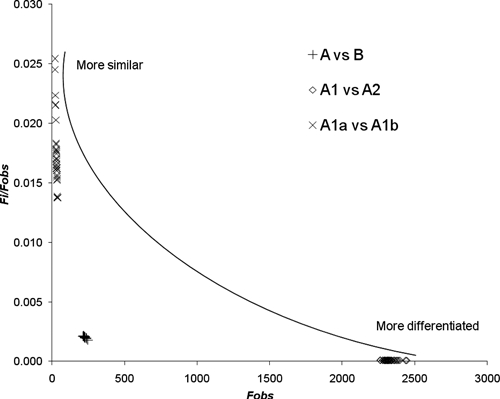
Scatter plot of the values of the F*/Fobs ratio and the Fobs calculated from the non-parametric MANOVA. Values toward the lower right corner show greater differentiation between the compared genotypes, and values toward the upper left corner show more ecological similarity.
Discussion
This work represents a coarse-scale ecological analysis of F. tularensis subspecies and clades and their predicted geographic distributions across the United States. Our results suggest that types A and B overlap broadly with respect to ecological parameters, with only minor differences in predicted ecological niches. In contrast, clades A1 and A2 were found to occupy distinct ecological niches, consistent with marked differences in their known geographic distributions.4,5,7 We found no appreciable differences between predicted A1a and A1b ecological niches.
An important feature of our ecological-niche modeling is the predicted distribution of F. tularensis genotypes in regions of the United States for which no occurrence data were included in model development. The models predict that A1 strains, although principally distributed in the Eastern United States, should nevertheless have the potential to occur in some areas of the intermountain Western United States. Indeed, in a tularemia outbreak in 2007 in North-Central Utah, a region predicted by the models, A1 strains were identified as the cause of the infections.17 Similarly, a tularemia epizootic in lagomorphs caused by A2 strains occurred in Presidio, Jeff Davis, and Potter counties in Texas in 2006 (Centers for Disease Control, unpublished data), regions predicted by the models, but for which isolates were not included in the data set on which the models were based. Finally, although type B isolates from Michigan, Minnesota, and North Dakota were not included in the data set, the model strongly predicted distribution of type B in these areas; indeed, both human and animal infections caused by type B have previously been documented from these regions of the upper Midwest.7
This study highlights the importance of considering strain-differentiation data (subspecies and clades) with respect to ecological-niche modeling. Although predicted ecological niches were found to be overlapping at the subspecies level for F. tularensis (type A versus type B), differences in ecological parameters became marked when comparisons were performed at an intermediate phylogenetic level (A1 versus A2). A2 strains were found to occur at higher elevations (usually > 1,000 m) and in areas with less precipitation, lower temperatures, more ground-frost days, and higher vapor pressure than A1 strains. In addition, comparison of ecological parameters for type B versus A1 or A2 strains paints a different picture than a comparison of type B strains versus all type A strains. Type B and A2 showed similarity with respect to the ground-frost days and mean temperature, whereas type B and A1 showed similarity with respect to elevation and precipitation, suggesting that type B strains share some ecological features with A1 strains and some features with A2 strains (Figure 3).
Differences in clinical severity among F. tularensis subspecies and clades were not obviously correlated to differences in ecological niches. Human mortality rates differ significantly between infections caused by A1 and A2 strains at 14% and 0%, respectively, with these two clades predicted to occupy distinct ecological niches. However, no differences in predicted ecological niches were observed between A1a and A1b strains, despite even greater differences in mortality rates (4% and 24%, respectively). In addition, despite no significant differences in mortality between A2 (0%) and A1a (4%) infections, these two clades occupy distinct ecological niches. Thus, no clear ecological differences that could translate into epidemiologic parameters (e.g., transmission modes associated with differing vectors or hosts) could be readily attributed to F. tularensis subspecies and clades.
Our findings are subject to several limitations. First, type B strains were modeled only at the subspecies level, because PFGE does not provide discrimination of type B strains to a finer level. Because genetic substructuring into subpopulations among type B strains has been shown recently using SNPs and multilocus variable number of tandem repeat analyses,18 ecological-niche models based on these clades will be important for future studies. Second, because of intercorrelations among environmental factors, we cannot ascribe differences among genotypes definitively to any particular environmental dimension; therefore, correlated dimensions exist that could confound associations—this confounding, of course, reflects the complexity of environmental landscapes. In addition, the niche models are relevant only in the environmental dimensions over which the models were trained (i.e., climate and topography) and cannot speak to environmental features that were not considered in the analyses (e.g., soil characteristics).
The methods applied in this paper, combining ecological-niche models with detailed statistical comparisons in ecological dimensions, offer insights into disease ecology.19 The niche concepts on which niche modeling is based conceptually depend on a dual-space manifestation of species' geographic distributions; ecological tolerances and constraints determine a potential distribution that is then further constrained by geographic features.20 The MANOVA test used herein resembles closely the randomization-based approaches recently proposed by Warren and others;21 the latter approaches “randomize” more deeply, to the point of generating new replicate randomized models, whereas our comparisons depend on post hoc comparisons of already generated models. Clearly, methods for comparing and contrasting modeled ecological niches are only beginning to be explored, and considerable testing and exploration are still needed.
In conclusion, we show lack of coarse-resolution differentiation in ecological dimensions among the deepest and finest phylogenetic divisions of F. tularensis but dramatic differentiation in intermediate phylogenetic divisions. These intermediate divisions A1 and A2 are ecologically distinct. Because this differentiation is reflected in geographic differences as well, the question of if geographic or ecologic differences came first needs further consideration. Future analysis should attempt to discern causal associations more precisely, including use of more diverse suites of environmental variables and local-scale niche parameters in model development and study of the biological associations between the different strains and their host species.
Acknowledgments
The authors thank Jorge Soberón for assistance with development of the MANOVA approach. The authors also thank Erin Staples, Kristy Kubota, and state and local health departments.
Footnotes
Financial support: Funding was provided by grants from Microsoft Research, the U.S. Department of Defense, and the Centers for Disease Control and Prevention.
Authors' addresses: Yoshinori Nakazawa, Richard A. J. Williams, and A. Townsend Peterson, University of Kansas, Natural History Museum and Biodiversity Research Center, Lawrence, KS, E-mails: ynakazawa@gmail.com, ricw@ku.edu, and town@ku.edu. Paul S. Mead, Kiersten J. Kugeler, and Jeannine M. Petersen, Centers for Disease Control and Prevention, National Center for Zoonotic, Vector-Borne and Enteric Diseases, Division of Vector-Borne Diseases, Fort Collins, CO 80521, E-mails: pfm0@cdc.gov, bio1@cdc.gov, and JPetersen@cdc.gov.
References
- 1.Sjöstedt A. In: Bergey's Manual of Systematic Bacteriology. Brenner DJ, editor. New York: Springer-Verlag; 2005. (Family XVII. FRANCISELLACEAE, genus I. Francisella). [Google Scholar]
- 2.Dennis DT, Inglesby TV, Henderson DA, Barlett JG, Ascher MS, Eitzen E, Fine AD, Friedlander AM, Hauer J, Layton M, Lillibridge SR, McDade JE, Osterholm MT, O'Toole T, Parker G, Perl TM, Russell PK, Tonat K. Tularemia as a biological weapon—medical and public health management. JAMA. 2001;285:2763–2773. doi: 10.1001/jama.285.21.2763. [DOI] [PubMed] [Google Scholar]
- 3.Ellis J, Oyston PC, Green M, Titball RW. Tularemia. Clin Microbiol Rev. 2002;15:631–646. doi: 10.1128/CMR.15.4.631-646.2002. [DOI] [PMC free article] [PubMed] [Google Scholar]
- 4.Staples JE, Kubota KA, Chalcraft LG, Mead PS, Petersen JM. Epidemiologic and molecular analysis of human tularemia, United States, 1964–2004. Emerg Infect Dis. 2006;12:1113–1118. doi: 10.3201/eid1207.051504. [DOI] [PMC free article] [PubMed] [Google Scholar]
- 5.Farlow J, Wagner DM, Dukerich M, Stanley M, Chu M, Kubota K, Petersen J, Keim P. Francisella tularensis in the United States. Emerg Infect Dis. 2005;11:1835–1841. doi: 10.3201/eid1112.050728. [DOI] [PMC free article] [PubMed] [Google Scholar]
- 6.Johansson A, Farlow J, Larson P, Dukerich M, Chambers E, Bystrom M, Fox J, Chu M, Forsman M, Sjöstedt A, Keim P. Worldwide genetic relationships among Francisella tularensis isolates determined by multiple-locus variable-number tandem repeat analysis. J Bacteriol. 2004;186:5808–5818. doi: 10.1128/JB.186.17.5808-5818.2004. [DOI] [PMC free article] [PubMed] [Google Scholar]
- 7.Kugeler KJ, Mead PS, Janusz AM, Staples JE, Kubota KA, Chalcraft LG, Petersen JM. Molecular epidemiology of Francisella tularensis in the United States. Clin Infect Dis. 2009;48:863–870. doi: 10.1086/597261. [DOI] [PubMed] [Google Scholar]
- 8.Pandya GA, Holmes MH, Petersen JM, Pradhan S, Karamycheva SA, Wolcott MJ, Molins C, Jones M, Schriefer ME, Fleischmann RD, Peterson SN. Whole genome single nucleotide polymorphism based phylogeny of Francisella tularensis and its application to the development of a strain typing assay. BMC Microbiol. 2009;9:213. doi: 10.1186/1471-2180-9-213. [DOI] [PMC free article] [PubMed] [Google Scholar]
- 9.Jellison WL. Tularemia in North America, 1930–1974. Missoula, MT: University of Montana; 1974. [Google Scholar]
- 10.Nakazawa Y, Williams R, Peterson AT, Mead P, Staples E, Gage KL. Climate change effects on plague and tularemia in the United States. Vector Borne Zoonotic Dis. 2007;7:529–540. doi: 10.1089/vbz.2007.0125. [DOI] [PubMed] [Google Scholar]
- 11.New M, Hulme M, Jones PD. Representing twentieth century space-time climate variability. Part 1: development of a 1961–90 mean monthly terrestrial climatology. J Clim. 1999;12:829–856. [Google Scholar]
- 12.USGS . Hydro1K Elevation Derivative Database. Washington, DC: U.S. Geological Survey; 2001. [Google Scholar]
- 13.Stockwell D. The GARP modeling system: problems and solutions to automated spatial prediction. Int J Geogr Inf Sci. 1999;13:143–158. [Google Scholar]
- 14.Stockwell DRB, Noble IR. Introduction of sets of rules from animal distribution data: a robust and informative method of data analysis. Math Comput Simul. 1992;33:385–390. [Google Scholar]
- 15.Anderson RP, Lew D, Peterson AT. Evaluating predictive models of species' distributions: criteria for selecting optimal models. Ecol Modell. 2003;162:211–232. [Google Scholar]
- 16.Anderson MJ. A new method for non-parametric multivariate analysis of variance. Austr Ecol. 2001;26:32–46. [Google Scholar]
- 17.Petersen JM, Carlson JK, Dietrich G, Eisen RJ, Coombs J, Janusz AM, Summers J, Beard CB, Mead PS. Multiple Francisella tularensis subspecies and clades, tularemia outbreak, Utah. Emerg Infect Dis. 2008;14:1928–1930. doi: 10.3201/eid1412.080482. [DOI] [PMC free article] [PubMed] [Google Scholar]
- 18.Vogler AJ, Birdsell D, Price LB, Bowers JR, Beckstrom-Stenberg SM, Auerbach RK, Beckstrom-Stenberg JS, Johansson A, Clare A, Buchhagen JL, Petersen JM, Pearson T, Vaissaire J, Dempsey MP, Foxall P, Engelthaler DM, Wagner DM, Keim P. Phylogeography of Francisella tularensis: global expansion of a highly fit clone. J Bacteriol. 2009;191:2474–2484. doi: 10.1128/JB.01786-08. [DOI] [PMC free article] [PubMed] [Google Scholar]
- 19.Peterson AT. Biogeography of diseases: a framework for analysis. Naturwissenschaften. 2008;95:483–491. doi: 10.1007/s00114-008-0352-5. [DOI] [PMC free article] [PubMed] [Google Scholar]
- 20.Soberón J, Peterson AT. Interpretation of models of fundamental ecological niches and species' distributional areas. Biodiversity Informatics. 2005;2:1–10. [Google Scholar]
- 21.Warren DL, Glor RE, Turelli MN. Environmental niche equivalency versus conservatism: quantitative approaches to niche evolution. Evolution. 2008;62:2868–2883. doi: 10.1111/j.1558-5646.2008.00482.x. [DOI] [PubMed] [Google Scholar]