

Abstract
A combination of the extended multiscale model, new image processing algorithms, and biological experiments is used for studying the role of Factor VII (FVII) in venous thrombus formation. A detailed submodel of the tissue factor pathway of blood coagulation is introduced within the framework of the multiscale model to provide a detailed description of coagulation cascade. Surface reactions of the extrinsic coagulation pathway on membranes of platelets are studied under different flow conditions. It is shown that low levels of FVII in blood result in a significant delay in thrombin production, demonstrating that FVII plays an active role in promoting thrombus development at an early stage.
Introduction
To prevent the loss of blood after a break in blood vessels, components in blood and the vessel wall interact rapidly to form a thrombus, or clot, to limit hemorrhage. This hemostatic response is rapid to limit bleeding, and is also regulated to prevent excessive clotting that can limit blood flow. Thrombogenesis involves multiple molecular and cellular components in the blood and interactions among multiple processes ranging from coagulation, and platelet biology, to hemodynamics. Given the complexity of the thrombus formation process, computational modeling is becoming a very important complementary tool for traditional laboratory studies. The successful development of a computational predictive model of thrombogenesis—a model able to integrate processes occurring at different scales—is still a challenge.
In Xu et al. (1,2) a two-dimensional multiscale model of the developing thrombus was introduced that included components for modeling viscous, incompressible blood plasma; nonactivated and activated platelets; other blood cells; activating factors; fibrinogen; and the blood vessel wall. Macroscale dynamics of the blood flow was described by the continuum Navier-Stokes equations. Microscale interactions among activated platelets, platelets and fibrin(ogen), and platelets and the vessel wall were described through an extended stochastic discrete cellular Potts model (CPM). A coagulation pathway submodel has been recently added to the model in Xu et al. (3).
In this article, the two-dimensional multiscale model of thrombus formation is extended by including surface-mediated control of the coagulation pathway resulting in detailed modeling of the impact of all major coagulation and anticoagulation factors on thrombin generation. The novelty of the approach is in representing each platelet as an extended object with the boundary changing volume, and modeling in detail the production of thrombin by each individual platelet. In addition, the clot is treated as a porous medium. New image analysis tools introduced in Mu et al. (4,5) are used to estimate model parameter values (see Supporting Material for details).
The extended two-dimensional multiscale computational model was used to simulate thrombus formation in normal mice and mice with limited levels of factor VII (FVII). Simulation predictions have been compared with experimental results involving thrombogenesis after laser-induced injury of venules in wild-type and FVII deficient mice to gain improved understanding of coagulation factors and the role of hydrodynamics. It was shown that low level of FVII significantly delayed the rise in thrombin concentration. Comparison with experimental data suggests that this delay affects the final structure of the clot—which has significant biomedical implications.
This article is organized as follows. Biological and Modeling Background is provided in the next section. Materials and Methods describes the experimental materials and methods used, and Extended Multiscale Model presents the new extended multiscale model with surface-mediated control of the blood coagulation cascade. We then provide our simulation and experimental results. The article ends with our Conclusions. Image analysis algorithms used in the article as well as detailed description of the biochemical reactions submodel equations including protein C pathway (PC) component and CPM are described in detail in the Supporting Material.
Biological and Modeling Background
Given space limitations, the following description of thrombus generation is simplified. The subject is described in more detail in several recent reviews (6–9).
After vascular injury, blood is exposed to prothrombotic environments that promote rapid thrombus formation. Thrombus formation is the result of two interrelated processes—platelet interactions and coagulation pathway activation. Immediately after vessel damage, platelets adhere to the site of vessel injury forming a single cell layer by the binding of platelet receptors gpIb/IX to von Willebrand factor (vWF) and gpIa/IIa and gpVI to collagen in the subendothelial matrix of the vessel wall (10). Subsequently, platelets adhere to each other and form multicellular aggregates mediated by the binding of the platelet gpIIb/IIIa receptor to fibrin(ogen). In addition, platelets undergo activation involving significant morphological changes, i.e., the exposure of new proteins on the platelet surface and the extracellular release of contents of α- and dense granules found in resting platelets. Activated platelets also expose negatively charged phospholipids that promote surface-dependent coagulation reactions. It is generally accepted that the coagulation cascade is initiated when coagulation factor VII in the blood is exposed to its cellular receptor, the tissue factor (TF), which is expressed on endothelial cells in the vessel wall (11). The TF/VIIa complex catalyzes the conversion of factor X to Xa directly or via an IXa/VIIIa intermediary step. Activated factor Xa combines with its protein cofactor, factor Va, on the surfaces of platelets to form prothrombinase (FVa/FXa complex), which, in turn, converts prothrombin (II) to thrombin (IIa) through an intermediate meizothrombin (mIIa). This intermediate (mIIa) is transient, and is rapidly converted to IIa in the presence of factor Va and procoagulant lipids. Factor V is activated to its active form Va by both factor Xa and IIa. Thrombin activates platelets; converts fibrinogen to fibrin; and activates factors V, VIII, and XI, which provide a positive feedback loop propagating the production of thrombin. Thrombin is also a potent activator of resting platelets and thus mediates recruitment of resting platelets flowing nearby in the blood. The activated platelets provide a procoagulant surface that promotes coagulation enzyme activity. The formation and activity of the VIIIa/IXa and Va/Xa complexes are dependent on the availability of phospholipid binding sites. These binding sites are only present on surfaces of activated platelets.
Several anticoagulant components in blood inhibit different targets of the coagulation complexes. Tissue factor pathway inhibitor (TFPI) forms a quaternary complex with factor Xa, TF, and VIIa, effectively inhibiting TF/VIIa initiation of the coagulation cascade. The procoagulant activities of thrombin, IXa, and Xa, are inhibited by antithrombin III (ATIII), whose inhibitory activity is enhanced by binding glycosamine glycans exposed on the resting endothelium. Additionally, Protein C (PC) is activated to active Protein C (APC) by thrombomodulin and thrombin complex to form a negative feedback loop. The blood flow substantially affects growth and development of thrombus. Platelet receptors (gpIba) and ligands (vWF) form catch-slip bonds, so shear has an effect on the strength of adhesive forces tethering platelets to the vessel wall. Gene expression patterns of endothelial cells cultured under flow or stasis are also different. Inflammatory markers are expressed by cells growing under static conditions.
The first systematic model of the coagulation pathway was introduced in Jones et al. (12) and Lawson et al. (13). Recently, this model has been extended to include inhibitors that are recognized as integral parts of the coagulation system (14). Bungay et al. (15) proposed a comprehensive model for the dynamics of thrombin formation for vascular and nonvascular systems that distinguished reactions on cell membrane and in bulk flow. Both of these models assume a uniformly mixed, static fluid environment and an unlimited supply of phospholipid. The role of phospholipid surfaces in controlling coagulation was not addressed. McGee and Chou (16) studied initial surface reactions of the extrinsic coagulation pathway on live cell membranes under flow conditions. Several other models have been developed in an attempt to integrate some of the subprocesses involved in thrombus formation. A model described in Kuharsky and Fogelson (17) includes the transport of blood flow and a finite number of surface binding sites. However, the flow transport and reactant diffusion were incorporated into the model by using empirical parameters. Newtonian fluid models have been described in Fogelson (18) and Sorensen et al. (19) in the form of coupled convection-reaction-diffusion equations. (See (20–22) for other related articles.)
Materials and Methods
We have used multiphoton intravital microscopy to monitor thrombus development in mouse venules (diameter being ∼100 μm). C57Bl/5 mice, 6-8 weeks of age (Harlan, Indianapolis, IN) and low FVII mice (maintained in the animal facilities at the Indiana University School of Medicine) were used in accordance with National Institutes of Health guidelines and approval of the Institutional Animal Care and Use Committee of the Indiana University School of Medicine. The mesentery vascular bed surrounding the intestines were surgically externalized from an anesthetized mouse and positioned under a model No. LSM-510 Meta Confocal/Multiphoton microscope (Carl Zeiss, Oberkochen, Germany) so one could monitor blood flow through blood vessels.
Mice were injected with labeled dextran (Molecular Probes, Eugene, OR) to detect plasma (Enzyme Research Labs, South Bend, IN), anti-CD41 antibody to monitor platelets (Emfret, Würzburg, Germany) and labeled fibrinogen (Enzyme Research Labs) that enabled one to monitor the incorporation of major components into the growing thrombus. After laser-induced injury to the venule wall, vertical stacks of images of developing thrombi were collected continuously for 30 min, enabling one to generate three-dimensional reconstructions of the developing thrombus in vivo (see Kamocka et al. (27) for details). Using the image processing algorithms described in the Supporting Material, we quantitated the changing composition of specific domains during thrombus development.
Extended Multiscale Model
The multiscale model introduced in Xu et al. (1,2) is extended in this article by including a detailed submodel of surface-mediated control of blood coagulation and by treating the blood clot as a porous medium. It includes the following components and processes at different scales: platelets and other blood cells; blood plasma; subendothelial cells; blood vessel wall; injury; platelet-platelet adhesion; activation; blood plasma flow; an extrinsic coagulation pathway that takes into account solution phase and membrane-phase enzymes and zymogens; coagulation inhibitors; and diffusion of solution-phase reactants. Specific submodels for processes involving components described above are as follows:
Biochemical reactions submodel
Systems of ordinary differential equations (ODEs) and partial differential equations (PDEs) are used to describe the coagulation cascade.
Cell submodel
Discrete stochastic CPM represents different types of cells as well as describes cell-cell and platelet-injury adhesion, platelet activation, cell movements, cell state changes and platelet aggregation.
Flow submodel
Incompressible Navier-Stokes (NS) equations and Darcy's law describe dynamics of viscous blood plasma.
Cellular Potts model
The cellular Potts model (CPM) for modeling blood clot formation consists of a list of generalized cells on a lattice, a set of chemical diffusants, and local rules describing their biological and physical behaviors. Interactions of CPM components are embodied in the effective cell energy, coupled to auxiliary equations to describe absorption and secretion of diffusants and extracellular materials, state changes within cells, and the behavior of extracellular diffusants. Each platelet or other blood cell is represented in the CPM by a cluster of lattice sites. Distribution of multidimensional indices associated with lattice sites determines current system configuration. The Metropolis dynamics algorithm, based on the Monte Carlo Boltzmann acceptance rule, is used to determine CPM configuration. The effective CPM energy of the thrombus mixes true energies, such as platelet-platelet adhesion, and terms that mimic energies, e.g., the response of a cell to the flow pressure, and area and shape constraints. Biochemical reactions as well as chemical production are modeled on the surface of each cell. (The details can be found in Xu et al. (1,2) and in this article's Supporting Material.)
All the different components of the multiscale model, including the ones modeled by the CPM, are indicated in Fig. 1. In the simulation, platelets can get activated and adhere to each other and to the injury site. New inactivated platelets are introduced in the simulation domain from the inlet—the left side of a domain at a specified rate, and are carried by the flow to the right.
Figure 1.
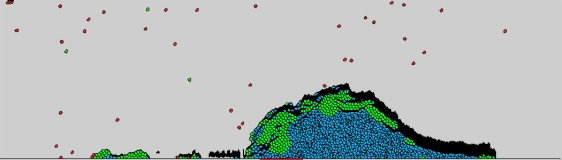
Snapshot of a clot formation simulation obtained using multiscale model. (Black) Cells made of the fibrin network; these cells are termed “fibrin cell”. (Red) Cells that are inactive platelets. (Green) Cells representing platelets right after activation (<1 min from exposure to activating thrombin concentration). (Blue) Cells representing late-activated platelets that can support coagulation reactions and bind fibrin(ogen).
Blood flow submodel
The blood clot is treated in this article as a porous medium to account for the transport property of blood flow. In the case of vein thrombus formation studied in this article, the Reynolds number of the blood flow is ≤O(1). Therefore, we describe the blood flow within the clot by Darcy's law. A complete flow submodel consists of the combination of the NS equations (Eq. 1) and Darcy's law (Eq. 2). Namely, we solve NS equations outside the clot, use Darcy's law within the clot, and then couple them using the domain decomposition approach,
| (1) |
| (2) |
where ρ is the fluid density, u and p are volume-averaged velocity and pressure, respectively, and ν is the shear viscosity. The permeability k of the blood clot is related to porosity by the Davies' equation presented by Dullien (23). Blombäck et al. (24) correlated this equation with the data for permeability measurements made on fibrin gels polymerized under various thrombin concentrations. Because we model clots largely made of platelets, we use the Davies' equation for larger porosity,
where ε is a porosity.
Coagulation pathway submodel
We extend the approach of Hockin et al. (14) by including in the model both solution-phase and membrane-phase reactions with concentrations of membrane-binding sites being limited and treated as control variables. In addition, factor XI is included in the model because it provides a positive feedback loop for coagulation:
The resulting coagulation submodel consists of 22 PDEs and 23 ODEs without considering the Protein C pathway (see Supporting Material). The discussion of the PC pathway is given separately, below, in Protein C Pathway Component. The PDEs describe rates of change of the concentration of each solution-phase factor or complex; and the ODEs describe rates of change of the concentration of each membrane-phase factor or complex. The model variables include the following 22 solution-phase factors and complexes:
VII, VIIa, Xa, II, IIa, X, IX, IXa, VIII, VIIIa, VIIIa1L, VIIIa2, V, Va, mIIa, TFPI, Xa:TFPI, ATIII, Xa:ATIII, mIIa:ATIII, IXa:ATIII, and IIa:ATIII,
and membrane-phase factors and complexes:
TF, TF:VIIm, TF:VIIam, TF:VIIma:X, TF:VIIma:Xa, TF:VIIma:IX, IXa:VIIIa, IXa:VIIIa:Xm, Xa:Va, Xa:Va:IIm, TF:VIIma:Xa:TFPI, TF:VIIma:ATIII, Xam, IIma, Xm, IXm, IXam, IIm, VIIIm, VIIIma, Vm, Vma, and mIIma.
The membrane-phase reactants are indicated by a superscript m except for TF, which only occurs on subendothelial cells, tenase IXa:VIIIa, and prothrombinase Xa:Va.
Submodel assumptions
Platelets in resting state can be activated in our model in three ways:
Assumption 1. By binding to subendothelial cells.
Assumption 2. By getting in contact with activated platelets.
Assumption 3. By exposure to high concentration of thrombin (IIa).
Production of chemicals such as ADP secreted by platelets is not included in the current model. The effect of ADP is modeled through platelet activation resulting from a contact with already-activated platelets.
Activated platelets provide membrane-binding sites where surface-binding zymogens and enzymes react. We assume that factors X and Xa directly bind to factor VIIa without first binding to the subendothelium. Following Hockin et al. (14), activation of factor V is due to IIa. Activation of factor VIII is assumed to be through IIa as well. We also assume that the chemical mechanism of factor VIIIa losing activity results from spontaneous A2 domain dissociation. VIIIa1L and VIIIa2 are assumed to exist in liquid only, for the simplicity of computation. (We assume that the existence of VIIIa1L and VIIIa2 on platelet membrane is transient, and therefore find it justifiable to include only their liquid phase form into the model.)
Description of the coagulation submodel
The submodel is described in detail in the Supporting Material. Dynamics of plasma-phase thrombin is represented by the following PDE (Eq. S4.7) in the Supporting Material:
where the term k2on[IIa](p2 – emtot2 – zmtot2) is the rate at which plasma-phase thrombin binds to the surface of an activated platelet, p2 is the volume concentration of binding sites for platelet-bound thrombin (IIa), prothrombin (II), and meizothrombin (mIIa) on an activated platelet, and zmtot2 and emtot2 are the concentrations of platelet-bound prothrombin (II), and thrombin (IIa), and meizothrombin (mIIa), respectively, on an activated platelet, together with their platelet-bound complexes. The expression k2off[IIam] is the rate of dissociation of thrombin from a platelet surface and k41[IIa][ATIII] is the rate at which plasma-phase thrombin and plasma-phase anti-thrombin III bind to form IIa/ATIII complex. The expressions u × ∇[IIa] and represent convection and diffusion of plasma-phase thrombin.
The following system of ODEs (Eq. S4.36) describes dynamics of platelet-bound thrombin,
where k16[Xam][IIm] is the rate of conversion of platelet-bound prothrombin (IIm) to platelet-bound thrombin (IIam) by platelet-bound Xma.
Note that convection and diffusion terms are neglected in Eqs. S4.1–S4.50 in the Supporting Material. Resulting system of ODEs called modified Mann's ODE model, was used to estimate some parameter values for the multiscale model.
Estimation of parameter values
Most of the reaction rates were taken from Hockin et al. (14), where experimentally measured values of rate constants were used. The on-rates (kon) and off-rates (koff) of binding reactions were taken from Kuharsky and Fogelson (17). It is not possible at the moment to measure volume concentration of membrane binding-sites for all surface-dependent factors (i.e., p2 in Eq. S4.7). Instead, we converted numbers of membrane binding-sites on single platelet from Kuharsky and Fogelson (17) to values of volume concentration obtained by using numerical experiments. (See Results for details.) The average values of porosity of blood clots were obtained using image analysis (see Supporting Material for details).
Protein C pathway component
It is commonly agreed that thrombin and thrombomodulin (TM) on endothelial cells bind to form TM-IIa complex (25). Protein C (PC) is activated to APC by TM-IIa to form a negative feedback loop in which APC inactivates factors (FV and FVIII) that are essential for continued thrombin generation. (For further discussion of the APC, see Supporting Material.) Although our model is two-dimensional, we assume an extension of the simulation domain in the lateral direction perpendicular to the flow to describe the protein C mechanism. We assume that thrombin (IIa) generated in the thrombus can diffuse laterally onto the endothelium. APC is also delivered to the thrombus through the diffusion process. APC can be carried away by the flow as well. (A similar approach has been used in Fogelson and Tania (26).)
The dynamics of the concentration of the thrombin over endothelial IIaEC is described by Eq. S4.46. Note that:
[TM] is the total concentration of thrombomodulin on endothelial cells.
is the diffusion of IIa onto endothelial surfaces.
ktmon[IIaEC]([TM] – [TM:IIa] – [TM:IIa:PC]) is the binding of IIa to TM.
ktmoff[TM:IIa] represents the dissociation of the TM-IIa complex.
Production of APC on endothelial cells is modeled by Eq. S4.49. Produced APC diffuses into the clot and binds to factor VIIIam and Vam, which is described by Eq. S4.50. Because we do not have the true third dimension in the model, the flow velocity over endothelial cells is approximated by u0, which is the averaged flow velocity in the simulation domain.
Integration of submodels into a multiscale model
We assume that the thrombus is not changing while updating the blood flow velocity field during one time step. Convection-reaction-diffusion equations are solved by using an operator splitting approach, i.e., an intermediate chemical field is calculated by ignoring reaction terms in the equations. Then this field is used as initial condition for the system of ODEs that contain only reaction terms of the original equations.
During each numerical step (after retrieving the thrombus-plasma interface from the CPM grid), the NS equations, Darcy's law, and convection-reaction components of convection-reaction-diffusion equations for the flow and chemical distributions are solved simultaneously. After the PDE step described above, the biochemical reaction submodel is used, i.e., the reaction parts of convection-reaction-diffusion equations and ODEs are solved for each activated platelet to simulate surface-mediated coagulation. The result in turn is used in the subsequent CPM updates of cell positions, cell shapes, and types. It is also assumed that, during the CPM iteration, flow conditions (velocity and pressure) remain unchanged. After the CPM step is finished, the latest CPM data (interface geometry and chemical concentrations) provide updated boundary and initial conditions for the continuous model. The flow energy term in the CPM Hamiltonian is used to describe the impact of the blood flow on the cells (see Supporting Material for details).
Results
Preliminary simulations
We first calibrated the coagulation submodel by simulating the role of factor XI (see Supporting Material).
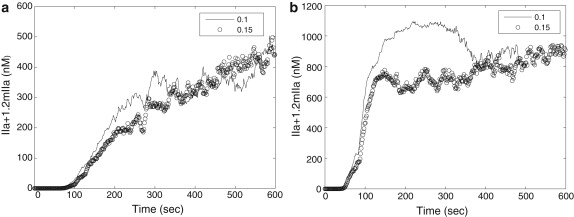
Impact of clot porosity on thrombin production
Analysis of experimental three-dimensional images of a growing clot demonstrated that clot porosity was ∼0.22, 0.15, and 0.08 at the initial, intermediate, and late stages of clot development, respectively. Fig. 2 shows the effect of porosity on thrombin generation. Fig. 2 a compares thrombin concentration when porosity = 0.1, and 0.15, respectively, for flow velocity = 0.05 mm/s. We see similar trend in thrombin generation regardless of porosity. Fig. 2 b compares thrombin concentration with porosity = 0.1, and 0.15, respectively, and flow velocity = 0.5 mm/s. The maximum of thrombin concentration is reached when the time is ∼250 s for porosity = 0.1 followed by a slight decrease. Nevertheless, both cases show similar thrombin production after 400 s. We therefore conclude that thrombin production is similar for different porosity values (at least in the later time) and that using a fixed average porosity value for all times is justified.
Figure 2.
Total thrombin generation with porosity = 0.1 and 0.15. (a) Flow velocity = 0.05 mm/s; (b) flow velocity = 0.5 mm/s.
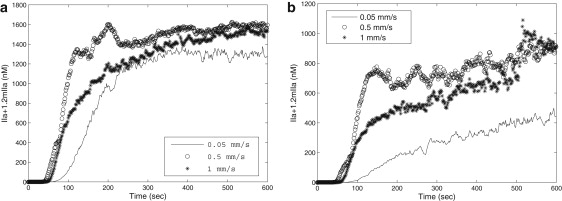
Impact of blood flow on the coagulation
Fig. 3 shows average values of thrombin production within simulated clots with respect to time. Comparison between Fig. S2 b in the Supporting Material and Fig. 3 in the article demonstrates the impact of blood flow as well as coagulation factor binding site on platelet surface on thrombin production and clot formation. Thrombin production displays qualitatively different behavior under static (modeled by ODE) and flow (simulated by the multiscale model) conditions. Comparison clearly shows that in multiscale model simulations, even with anticoagulants, thrombin concentration remains almost constant within the clot, whereas in the ODEs model/or under static condition simulations, thrombin is deactivated quickly after it reaches the peak value because of anticoagulants. There are several reasons contributing to these differences. The PDE submodel takes into account spatial variation of chemical concentration and blood flow effect. In addition, the multiscale model takes into account a finite number of binding sites on platelet surface for factors V, IX, X, VIII, etc., whereas the ODE model assumes an infinite supply of these binding sites. Therefore, in the multiscale model, the coagulation reaction on platelet surface is actually regulated by the available binding sites.
Figure 3.
Total thrombin generation in simulations with flow velocity = 0.05 mm/s, 0.5 mm/s, and 1 mm/s, respectively. (a) Total thrombin generation without inhibitors ATIII and TFPI. (b) Total thrombin generation with inhibitors ATIII and TFPI.
Role of the factor VII
Experimental results
We have compared thrombus development in wild-type and genetically modified mice expressing very low levels of coagulation FVII (0.1–1% of wild-type levels) by the technique developed in Rosen et al. (28). After laser-induced injury, the growth characteristics of thrombi in low FVII and wild-type mice are markedly different. With the injury parameters used in this study, wild-type thrombi grow rapidly. The second structure of the series has the largest volume, indicating the thrombus reaches peak size between 2 and 3 min after injury. After peaking, the volume of the wild-type thrombus decreases by ∼50% and reaches a stable conformation by the fifth-to-seventh structure (7–9 min after injury). In contrast, low FVII mice form unstable thrombi. Platelets accumulate immediately after injury, but the volumes decreases as platelets detach from the structure. The volume of the thrombi then slowly increases, reaching ∼70% of the volume of a wild-type clot (see Fig. 4). We hypothesize that this apparently novel experimental observation is related to the delayed thrombin generation, which is predicted from our simulations (see Fig. 5 a). However, the actual biological mechanism leading to this behavior is not fully understood and is subject to future study.
Figure 4.
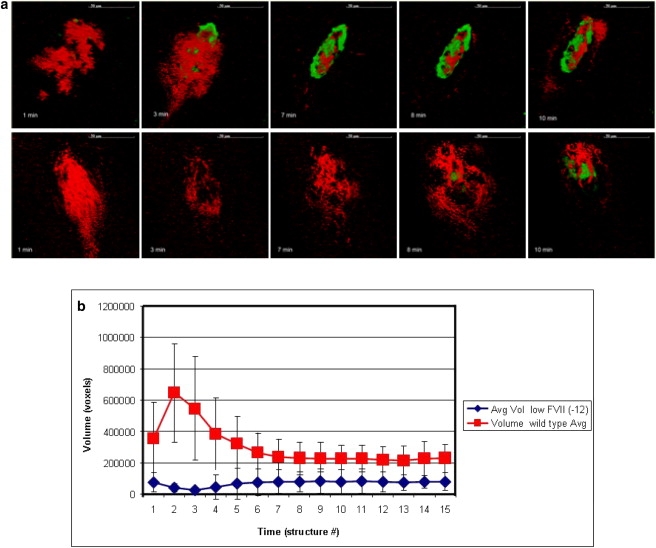
(a) Time sequences of experimental cross-section images taken close to lumen, representing structures 1, 2, 3, 8, and 10 in the image series taken for each injury. (Top and bottom) Images of thrombi in wild-type and low FVII cases, respectively. Each structure takes ∼80 s to acquire. (Green) Voxels made of fibrinogen only, (red) made of platelets only, and (black) with exclusion of all probes. (b) Diagram demonstrating growth of wild-type and low FVII thrombi obtained using analysis algorithms of three-dimensional reconstructed experimental images. Average volume of thrombi (vertical remixes) were determined by the number of voxels in a three-dimensional reconstructed images.
Figure 5.
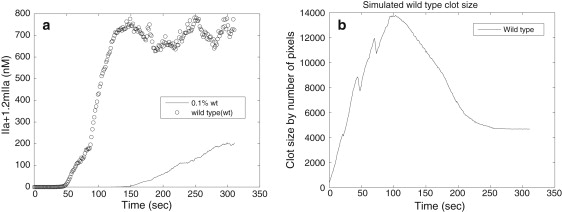
(a) Total amount of thrombin generated in simulations with concentration of FVII = 1.0, 0.1% of normal concentration. (b) Simulated wild-type clot size in numbers of pixels of cells.
Simulation results
Using simulations with an estimated 0.1% of normal concentration of FVII, we showed that there was a significant time delay in thrombin production reaching its peak value. The total thrombin concentration in the case of 0.1% of normal concentration of FVII was, after reaching the peak, approximately one-third of the concentration obtained in the case of the normal levels of the FVII (see Fig. 5 a).
The simulation predicts that thrombin generation is delayed, and the thrombin concentration is lower in low FVII thrombi, compared to wild-type (see Fig. 5 a).
In the experimental system, initially the wild-type thrombus grows rapidly, reaching peak volume at 2–3 min, and then decreases in size, reaching a stable volume at 6–9 min (see Fig. 4 b). This phenomenon most probably results from the decrease in platelet volume that occurs at the end of the activation process. Although resting platelets are discoid, initially after activation they become spherical with irregular protrusion and release contents of α- and dense granules. With the extension of filipodia attaching to matrix components within the thrombus, the platelets then spread and flatten. These initial increases are followed by decreases in volume of platelets during activation—which most probably contributes to the rapid increase and then decrease in thrombus volume that one sees in the experimental results. We incorporated initial increase followed by decrease in volume of platelets in the CPM model by adjusting target cell volume with time (see Supporting Material). Simulations demonstrated the clot size reaching peak value at 3 min and then dropping and stabilizing (see Fig. 5 b), which is consistent with the experimental observations presented in Fig. 4 b.
One feature of the growth pattern of low FVII, which the simulation does not predict at this time, is the dip in volume observed in developing low FVII thrombi. As the initial adhesion of platelets to the injury site is mediated by platelet attachment to collagen and vWF in the exposed subendothelial matrix, we expect platelets in low FVII and wild-type mice to initially bind similarly. However, in the experimental system the number of platelets accumulated in low FVII mice is less than that of wild-type at the earliest time point, which indicates some unknown biological mechanisms. Furthermore, that initial adhesion is transient, as the volume of the FVII thrombus dips in low FVII thrombi. This experimental result suggests that thrombin generation is necessary for stable platelet adhesion as well as continued platelet aggregation. We, therefore, plan to modify the model to include thrombin-mediated stabilization of the initial platelet-vessel wall interaction in our future study.
Role of the APC
Fig. 6 shows average values of thrombin production within simulated clots with respect to time when PC pathway is included in the coagulation model. Fig. 6 a compares the thrombin production when the PC pathway is included, with that of the case without inclusion of PC pathway, for flow velocity = 0.05 mm/s; and Fig. 6 b compares the thrombin production when the PC pathway is included, with that of the case without inclusion of PC pathway, for flow velocity = 0.5 mm/s. Although for both simulations, the cases with inclusion of PC pathway show a reduction in the amount of thrombin production, thrombin production displays qualitatively similar behavior under different flow conditions regardless of PC. Moreover, thrombin concentration is still far above the threshold value (1 nM) to activate resting platelets. Because we model the early development stage of clot formation, we conclude that PC is not important at the early stage.
Figure 6.
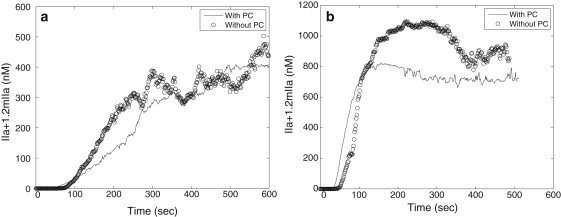
The effect of PC on thrombin generation in simulations with different flow velocities. (a) Flow velocity = 0.05 mm/s; (b) flow velocity = 0.5 mm/s.
How might one explain the epidemiological evidence that low levels of PC are associated with thrombosis (29)? Conceivably, PC might not play a major role stopping the growth of a developing thrombus but inhibit the initiation of coagulation caused by endothelial cell activation or dysfunction. This might result from PC inhibition of thrombin generation initiated on endothelium that is activated by reduced flow, hypoxia, or inflammatory signals. Additionally, it has recently been appreciated that PC has antiinflammatory and cytoprotective functions independent of its inactivation of FVa and FVIIIa, which have led to the use of APC in the treatment of severe sepsis (30). However, endothelial activation by inflammatory signals is not the situation in our experimental and computational model because we are using a laser-induced injury to induce an acute endothelial injury that disrupts endothelial cells.
Conclusions
In this article, a two-dimensional multiscale model is described that includes submodels of extended discrete cell representation, continuous blood flow, and the surface-mediated coagulation pathway. The results of simulations obtained using this model have been compared with results from an experimental model of laser-induced vessel injury in mice. Using intravital multiphoton microscopy, vertical stacks of images of developing thrombi were generated and analyzed using novel image processing algorithms.
Because our model is two-dimensional, some three-dimensional effects, such as turbulent flow, cannot be described. However, turbulence is not a concern for our study of venous thrombus development, because the blood flow is rather slow. Under the assumption of flow being laminar, our model is capable of simulating a two-dimensional slice from the middle of the clot and capturing important characteristics of the clot formation. For instance, in our previous articles (28,29), we correctly simulated the dependence of clot size on the flow rate. Moreover, the reaction rates of coagulation pathway, i.e., the physical scales (units) of clot formation processes such as activation of platelets by thrombin and the delay time for forming firm bonds between pairs of platelets, do not depend on the dimension.
Comparing results from the multiscale simulations and experimental models, we are able to estimate parameter values used in the simulations and to study roles of coagulation factors quantitatively. Moreover, these comparisons enable us to validate the multiscale model, and they suggest the inclusion of new components in the model so that the roles of hemostatic factors can be analyzed in silico. Additionally, simulations correctly predict the growth characteristics of wild-type thrombi.
Initial simulations examining the role of coagulation FVII are consistent with the quantitative results generated by the experimental injury model. The delay in thrombin generation at very low levels of FVII predicted in the simulations is consistent with the reduced stability at early times after injury of thrombi developing in FVII-deficient mice compared to those in wild-type. After injury, the exposure of platelets in blood to the damaged vessel wall leads to platelet adhesion to the injury site. Thus, the initial structures of thrombi in both wild-type and low FVII mice show significant platelet accumulation. However, whereas wild-type thrombi grow rapidly after injury, thrombi in FVII-deficient mice get smaller, consistent with the multiscale model prediction that there is a prolonged delay before significant accumulation of thrombin in low FVII mice. Because thrombin is a potent platelet activator, the delay in thrombin generation potentially leads to delayed platelet activation and reduced adhesiveness and aggregation. Furthermore, delayed thrombin generation also results in delayed accumulation of fibrin (which is a provider of structural stability to the thrombus). Thus, the delayed thrombin accumulation predicted for low FVII is consistent with the reduced stability of thrombi in low FVII mice after the initial adhesion of platelets at the injury site.
In the experimental system, there are greater fluctuations in the volume of thrombi in the low FVII mice compared to those in wild-type. This is because the experimental model incorporates the development of matrix cells composed of polymerized fibrin. To refine the simulation model to account for this observation, we are currently working on modeling the development of matrix cells that are composed of polymerized fibrin. These fibrin cells will stabilize the clot structure by inhibiting embolization while interfering with coagulation reactions on the surface of activated platelets. Presumably, because there is delayed and reduced thrombin generation in mice with low FVII levels, we expect to accumulate less fibrin after a longer delay than predicted in wild-type animals, which would result in delayed and reduced fibrin generation. This delayed and reduced fibrin generation will result in compromised structural integrity as well as reduced interference with platelet-surface-mediated coagulation, leading to cycles of embolization and thrombus regrowth.
Simulations suggest that appreciable changes in the delay of thrombin generation are first observed at very low levels of FVII (0.1–1.0% of wild-type). These predictions are consistent with observations comparing survival of FVII−/− null and FVIItta/− mice. Although FVII−/− mice die embryonically when sired by mothers with reduced FVII level, most FVIItta/− mice survive >3 months. This suggests that FVII levels in FVIItta/− mice, which are <1.0%, are above a threshold that permits survival. These results are consistent with the simulation indicating that only when one gets to FVII levels <1% is there a significant difference in the dynamics of thrombin generation.
We have demonstrated that the multiscale computational model could provide a valuable tool in the study of thrombosis. For instance, although specific thrombotic risk factors have been identified, the consequences to individuals with aberrant risk factor levels are often variable, and probably depend upon the variation of other hemostatic components. Although it is impractical to study how the variation of multiple parameters influences the risk of thrombosis in experimental systems, such studies can be done in silico. Thus, validated simulations can generate biomedically meaningful predictions from analysis of variation of multiple factors, which can then can lead to hypotheses that can be tested in vivo. The integration of coupled experimental and validated computational models will lead to more accurate and personalized assessments of disease risk.
Supporting Material
Two tables, two figures, and 53 equations are available at http://www.biophysj.org/biophysj/supplemental/S0006-3495(10)00139-6.
Supporting Material
Acknowledgments
We express our gratitude to Chris Sweet for his help in computational implementation of the CPM code.
This research was supported in part by National Science Foundation grants No. DMS-0800612, No. CCF-0515203, and No. CCF-0916606; National Institutes of Health grant No. HL073750-01A1; the INGEN Initiative to Indiana University School of Medicine; and a graduate fellowship from the Center for Applied Mathematics, University of Notre Dame.
References
- 1.Xu Z.-L., Chen N., Alber M. A multiscale model of thrombus development. J. R. Soc. Interface. 2008;5:705–722. doi: 10.1098/rsif.2007.1202. [DOI] [PMC free article] [PubMed] [Google Scholar]
- 2.Xu Z.-L., Chen N., Alber M. Study of blood flow impact on growth of thrombi using a multiscale model. Soft Matter. 2009;5:769–779. [Google Scholar]
- 3.Xu, Z.-L., J. Lioi, …, M. Alber. 2009. Combined experimental and simulation study of blood clot formation. Proc. IEEE TIC-STH-SENCS. Sep 26–27, Toronto, Canada (to appear).
- 4.Mu, J., X.-M. Liu, …, D. Chen. 2009. Segmentation, reconstruction, and analysis of blood thrombi in two-photon microscopy images. Proc. 2009 22nd IEEE Int. Symp. CBMS. Albuquerque, NM, August 3–4, DOI:10.1109/CBMS.2009.5255347.
- 5.Mu J., Liu X.-M., Chen D. Segmentation, reconstruction, and analysis of blood thrombi formation in two-photon microscopy images. EURASIP J. Adv. Signal Proc. 2010 [Google Scholar]
- 6.Engelmann B. Initiation of coagulation by tissue factor carriers in blood. Blood Cells Mol. Dis. 2006;36:188–190. doi: 10.1016/j.bcmd.2005.12.020. [DOI] [PubMed] [Google Scholar]
- 7.Furie B.B., Furie B.C. In vivo thrombus formation. J. Thromb. Haemost. 2007;1:12–17. doi: 10.1111/j.1538-7836.2007.02482.x. [DOI] [PubMed] [Google Scholar]
- 8.Gailani D., Renné T. The intrinsic pathway of coagulation: a target for treating thromboembolic disease? J. Thromb. Haemost. 2007;5(6):1106–1112. doi: 10.1111/j.1538-7836.2007.02446.x. [DOI] [PubMed] [Google Scholar]
- 9.Schenone M., Furie B.C., Furie B. The blood coagulation cascade. Curr. Opin. Hematol. 2004;11:272–277. doi: 10.1097/01.moh.0000130308.37353.d4. [DOI] [PubMed] [Google Scholar]
- 10.Grüner S., Prostredna M., Nieswandt B. Multiple integrin-ligand interactions synergize in shear-resistant platelet adhesion at sites of arterial injury in vivo. Blood. 2003;102:4021–4027. doi: 10.1182/blood-2003-05-1391. [DOI] [PubMed] [Google Scholar]
- 11.Nemerson Y. The tissue factor pathway of blood coagulation. Semin. Hematol. 1992;29:170–176. [PubMed] [Google Scholar]
- 12.Jones K.C., Mann K.G. A model for the tissue factor pathway to thrombin. II. A mathematical simulation. J. Biol. Chem. 1994;269:23367–23373. [PubMed] [Google Scholar]
- 13.Lawson J.H., Kalafatis M., Mann K.G. A model for the tissue factor pathway to thrombin. I. An empirical study. J. Biol. Chem. 1994;269:23357–23366. [PubMed] [Google Scholar]
- 14.Hockin M.F., Jones K.C., Mann K.G. A model for the stoichiometric regulation of blood coagulation. J. Biol. Chem. 2002;277:18322–18333. doi: 10.1074/jbc.M201173200. [DOI] [PubMed] [Google Scholar]
- 15.Bungay S.D., Gentry P.A., Gentry R.D. A mathematical model of lipid-mediated thrombin generation. Math. Med. Biol. 2003;20:105–129. doi: 10.1093/imammb/20.1.105. [DOI] [PubMed] [Google Scholar]
- 16.McGee M.P., Chou T. Surface-dependent coagulation enzymes. Flow kinetics of factor Xa generation on live cell membranes. J. Biol. Chem. 2001;276:7827–7835. doi: 10.1074/jbc.M003275200. [DOI] [PubMed] [Google Scholar]
- 17.Kuharsky A.L., Fogelson A.L. Surface-mediated control of blood coagulation: the role of binding site densities and platelet deposition. Biophys. J. 2001;80:1050–1074. doi: 10.1016/S0006-3495(01)76085-7. [DOI] [PMC free article] [PubMed] [Google Scholar]
- 18.Fogelson A.L. Continuum models of platelet aggregation: mechanical properties chemically induced phase transitions. Contemp. Math. 1993;141:279–294. [Google Scholar]
- 19.Sorensen E.N., Burgreen G.W., Antaki J.F. Computational simulation of platelet deposition and activation: I. Model development and properties. Ann. Biomed. Eng. 1999;27:436–448. doi: 10.1114/1.200. [DOI] [PubMed] [Google Scholar]
- 20.Fogelson A.L., Guy R.D. Platelet-wall interactions in continuum models of platelet thrombosis: formulation and numerical solution. Math. Med. Biol. 2004;21:293–334. doi: 10.1093/imammb21.4.293. [DOI] [PubMed] [Google Scholar]
- 21.Anand M., Rajagopal K., Rajagopal K.R. A model for the formation and lysis of blood clots. Pathophysiol. Haemost. Thromb. 2005;34:109–120. doi: 10.1159/000089931. [DOI] [PubMed] [Google Scholar]
- 22.Lobanov A.I., Starozhilova T.K. The effect of convective flows on blood coagulation processes. Pathophysiol. Haemost. Thromb. 2005;34:121–134. doi: 10.1159/000089932. [DOI] [PubMed] [Google Scholar]
- 23.Dullien F. 2nd Ed. Academic Press; New York: 1992. Porous Media: Fluid Transport and Pore Structure. [Google Scholar]
- 24.Blombäck B., Carlsson K., Aslund N. Native fibrin gel networks observed by 3D microscopy, permeation and turbidity. Biochim. Biophys. Acta. 1989;997:96–110. doi: 10.1016/0167-4838(89)90140-4. [DOI] [PubMed] [Google Scholar]
- 25.Van de Wouwer M., Collen D., Conway E.M. Thrombomodulin-protein C-EPCR system: integrated to regulate coagulation and inflammation. Arterioscler. Thromb. Vasc. Biol. 2004;24:1374–1383. doi: 10.1161/01.ATV.0000134298.25489.92. [DOI] [PubMed] [Google Scholar]
- 26.Fogelson A.L., Tania N. Coagulation under flow: the influence of flow-mediated transport on the initiation and inhibition of coagulation. Pathophysiol. Haemost. Thromb. 2005;34:91–108. doi: 10.1159/000089930. [DOI] [PubMed] [Google Scholar]
- 27.Kamocka M.M., Zu M., Rosen E.D. Two-photon intravital imaging of thrombus development. J. Biomed. Opt. 2010 doi: 10.1117/1.3322676. [DOI] [PMC free article] [PubMed] [Google Scholar]
- 28.Rosen E.D., Xu H., Castellino F.J. Generation of genetically altered mice producing very low levels of coagulation factor VII. Thromb. Haemost. 2005;94:493–497. [PubMed] [Google Scholar]
- 29.Marlar R.A., Mastovich S. Hereditary protein C deficiency: a review of the genetics, clinical presentation, diagnosis and treatment. Blood Coagul. Fibrinolysis. 1990;1:319–330. [PubMed] [Google Scholar]
- 30.Esmon C.T. Inflammation and the activated protein C anticoagulant pathway. Semin. Thromb. Hemost. 2006;32(Suppl 1):49–60. doi: 10.1055/s-2006-939554. [DOI] [PubMed] [Google Scholar]
Associated Data
This section collects any data citations, data availability statements, or supplementary materials included in this article.