

Abstract
The staphylococcal α-hemolysin (αHL) protein nanopore is under investigation as a fast, cheap detector for nucleic acid analysis and sequencing. Although discrimination of all four bases of DNA by the αHL pore has been demonstrated, analysis of single-stranded DNAs and RNAs containing secondary structure mediated by basepairing is prevented because these nucleic acids cannot be translocated through the pore. Here, we show that a structured 95-nucleotide single-stranded DNA and its RNA equivalent are translocated through the αHL pore in the presence of 4 M urea, a concentration that denatures the secondary structure of the polynucleotides. The αHL pore is functional even in 7 M urea, and therefore it is easily stable enough for analyses of challenging DNA and RNA species.
Introduction
Individual single-stranded DNA (ssDNA) and RNA (ssRNA) molecules can be detected by single-channel electrical recording when they are driven through the Staphylococcus aureus α-hemolysin (αHL) nanopore (1). αHL is a mushroom-shaped protein pore containing a constriction with a diameter of 1.4 nm that divides the interior of the pore into the vestibule and the barrel compartments (Fig. 1) (2). The diameters at the top of the vestibule (the cis entrance) and the bottom of the barrel (the trans entrance) are ∼2.6 nm and 2.2 nm, respectively. During the electrophoretic cis-to-trans translocation of DNA through the αHL pore, there is a blockade of the ionic current carried by the pore. The magnitudes of the current blockades and the translocation times are different for polynucleotides of various compositions (e.g., poly dA, poly dC, and poly dAdC) (3–6). These findings have led to mounting interest in the development of a fast, inexpensive method for sequencing ssDNA by identifying bases as the DNA moves through the pore (7). Indeed, individual bases can be distinguished at specific sites within ssDNA, but only when the DNA is immobilized within the pore (8,9). Free ssDNA is translocated too rapidly for base discrimination, and therefore methods are being developed to slow the speed at which DNA moves (10,11).
Figure 1.
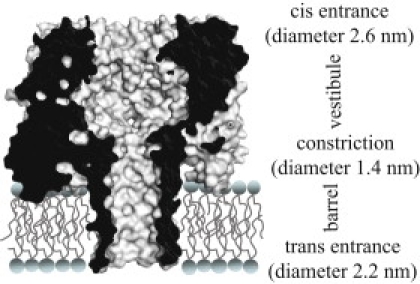
Cross section of the WT-αHL heptamer (PDB: 7AHL). The constriction (diameter: 1.4 nm) divides the pore into the cap domain, which is located on the cis side of the lipid bilayer and contains the vestibule, and the β-barrel, which is located within the bilayer.
Another difficulty in single-stranded polynucleotide analysis and sequencing with nanopores is the secondary structure mediated by basepairing that is prevalent in natural polynucleotides (12–15). The hairpins formed by ssDNA or ssRNA are too large to pass through the entrances of the αHL pore. Therefore, these DNAs and RNAs cannot be translocated through the pore without unzipping the hairpin structures (16,17). A possible solution to this difficulty would be to denature the DNA or RNA while leaving the protein pore in a functional state.
Although the mechanism by which urea acts as a denaturant remains under debate (18–20), it has been used for decades to eliminate the secondary structure of single-stranded polynucleotides (21–23). For example, polyacrylamide gel electrophoresis (PAGE) in the presence of 7 M urea is used to analyze and separate single-stranded nucleic acids (24). In this work, we used urea to eliminate the secondary structure of a 95-nucleotide (nt) ssDNA and the equivalent ssRNA to facilitate their translocation through the αHL pore. We also determined the effect of urea on the structure of the αHL pore in solution by using circular dichroism (CD), intrinsic tryptophan fluorescence emission (ITFE) spectroscopy, and sodium dodecyl sulfate (SDS)-PAGE.
Materials and Methods
Single-stranded polynucleotide preparation
Desalted ssDNA of 100 nt (A30C70, presumed to contain no basepair-mediated secondary structure) and 95 nt (5′ GGGAGACCACAACGGTTTCCCTCTAGAAATAATTTTGTTTAACTTTAAGAAGGAGATATACATATGGCAGATTCTGATATTAATATTAAAAGGCC 3′, containing secondary structure; see below) were purchased from Sigma-Aldrich. The ssDNAs were purified with 8% polyacrylamide gels containing 7 M urea. After electrophoresis, the DNA was stained with ethidium bromide (10 μg mL−1) and visualized under a UV Transilluminator 2000 (Bio-Rad, Hertfordshire, UK). The desired band of polyacrylamide was cut out and water (100 μL) was added. The gel was crushed and separated from the eluted ssDNA by means of a Micro-Spin chromatography column (Bio-Rad). DNA concentrations were determined with a NanoDrop ND-1000 spectrophotometer (Labtech, East Sussex, UK).
To prepare a 95-nt RNA with a sequence corresponding to the 95-nt ssDNA (5′ GGGAGACCACAACGGUUUCCCUCUAGAAAUAAUUUUGUUUAACUUUAAGAAGGAGAUAUACAUAUGGCAGAUUCUGAUAUUAAUAUUAAAAGGCC 3′), a pT7 vector containing the T7 promoter followed by the sequence GGGAGACCACAACGGTTTCCCTCTAGAAATAATTTTGTTTAACTTTAAGAAGGAGATATACATATGGCAGATTCTGATATTAATATTAAAAGGCC was digested with AgeI to make linear double-stranded DNA for in vitro transcription with the T7 RiboMAX Express Large Scale RNA Production System (catalog No. P1320; Promega, Southampton, UK). The transcription reaction contained linear DNA template (10 μL, 85 ng μL−1), 2X buffer (20 μL), nuclease-free water (8 μL), and enzyme mix (2 μL). After 2 h at 37°C, the DNA template was digested with RQ1RNase-Free DNase. The remaining RNA was purified with the miRNeasy Mini Kit (catalog No. 1038703; Qiagen, West Sussex, UK). RNA concentrations were measured with a Nanodrop ND-1000 spectrophotometer. The purity of the RNA was analyzed with a 1.0% agarose gel in Tris-acetate-EDTA buffer and an 8.0% urea-polyacrylamide gel in Tris-borate-EDTA buffer. The equipment used for RNA preparation was cleaned with RNaseZap (Ambion, Warrington, UK) to ensure it was RNase-free. The purified RNA (2 mg mL−1 in 50 μL sterile water) was stored at −20°C.
Protein preparation
Wild-type (WT) αHL was used unless otherwise stated. αHL proteins for single-channel recording were expressed by in vitro transcription and translation by using the Escherichia coli T7-S30 extract system for circular DNA (Promega). The monomeric αHL proteins were assembled and purified as previously described (25).
For CD and fluorescence studies, αHL was obtained from the Wood 46 strain of Staphylococcus aureus. A fraction of heptameric protein was separated and purified from the secreted monomeric protein by gel filtration and SDS-PAGE as previously described (26). The heptamer was exchanged into 20 mM Na phosphate, 150 mM NaCl, 0.3% (w/v) SDS, pH 8.0, containing 0–8 M urea by using P6 microcentrifuge columns (732-6221; Bio-Rad) spun at 2000 × g (5417R; Eppendorf). The protein was diluted to 100 μg mL−1 at each urea concentration.
SDS-PAGE analysis
After ∼10 h of incubation in 20 mM sodium phosphate, 150 mM NaCl, pH 8.0, containing 0–8 M urea, the protein samples were separated by analytical 10% Tris-Bis SDS-PAGE. The heptamer was diluted 1:2 with loading buffer (XT sample buffer; Bio-Rad) and loaded onto Criterion XT Bis-Tris 10% gels (Bio-Rad). Precision Plus protein markers (161-0374; Bio-Rad) were used to locate the heptamer after electrophoresis. The gels were run at 200 V for 55 min with 1X MOPS (Bio-Rad) as the running buffer. The gels were then stained overnight with Instant Blue buffer (No. ISB01L; Expedeon Protein Solutions) and then washed thoroughly with water. The bands that corresponded to the heptameric (232.4 kD) and monomeric (33.2 kDa) αHL protein were imaged and quantified by using Quantity one 4.6.1 (Bio-Rad).
CD measurements
CD measurements were carried out at 24°C (Chirascan; Applied Photophysics Ltd.) in a 1 mm path-length quartz cuvette (Hellma UK). The spectra were collected over a wavelength range of 200–250 nm at 0.5 nm intervals at 1 s per point. In each experiment, a minimum of five spectra were collected for each sample at each urea concentration. Three independent experiments were conducted in this manner. The spectra were averaged and smoothed with the Chirascan Pro Data Viewer program. The data were converted to mean residue molar ellipticity values (Θ) by the same program. To examine the denaturation of the αHL heptamer, the protein (100 μg mL−1) was incubated for 6 h in 150 mM NaCl, 20 mM sodium phosphate, 0.3% (w/v) SDS, pH 8.0, with various concentrations of urea (0–8 M). Once the CD spectra had been obtained, the mean residue molar ellipticity at 218 nm was plotted and fitted to a sigmoidal curve.
For ssDNA and RNA analysis, the spectra were collected over a wavelength range of 220–280 nm at 0.5 nm intervals for 1 s per point. The 95-nt ssDNA or RNA (2.0 μg mL−1) was incubated in 1 M KCl, 5 mM HEPES, pH 7.5, with various concentrations of urea (0–8 M) for 2 min before measurements were taken. In each experiment, a minimum of five spectra were collected for each sample. Three independent experiments were conducted in this manner. Once the CD spectra had been obtained, the values in mdeg at 260 nm were plotted and fitted to a sigmoidal curve.
ITFE spectroscopy
All fluorescence measurements were carried out in a 10 mm path-length quartz cuvette (Hellma) with a temperature-controlled Cary Eclipse fluorescence spectrophotometer (Varian) at 24°C. The excitation wavelength was set at 280 nm. The emission wavelength range was 300–500 nm, and a slit width of 5 nm was used. αHL heptamer (100 μg mL−1) was subjected to buffer exchange with 20 mM sodium phosphate, 150 mM NaCl, 0.3% (w/v) SDS, pH 8.0, containing various concentrations of urea (0–8 M), by using Micro-Spin chromatography columns (Bio-Rad). In each experiment, the protein sample was incubated for 6 h before measurements were taken, and a minimum of 10 spectra were collected. Data from three independent experiments were acquired in this manner, and the average emission maximum (λemmax) versus the urea concentration was plotted and fitted to a sigmoidal curve.
Single-channel recording and data analysis
All experiments were performed on single αHL pores in planar phospholipid bilayers comprising 1,2-diphytanoyl-sn-glycero-3-phosphocholine (Avanti Polar Lipids). The two chambers of the apparatus were separated by a 25-μm-thick Teflon film with a 100-μm-diameter orifice. The orifice was pretreated with hexadecane in pentane (1:10). Ag/AgCl electrodes were used with bridges made from 3.0% agarose containing 3 M KCl. The heptameric αHL protein was added to the cis chamber. A positive potential (+100 mV) was applied and the solution was stirred until a channel inserted. Positive and negative potentials (+150 mV and −150 mV) were then applied to check the ionic current asymmetry and hence the orientation of the pore. Then A30C70 or the 95-nt DNA or RNA was added to the cis chamber (final concentration: 1 μM) and a positive voltage (+150 mV or +180 mV) was applied to drive the polynucleotide through the pore.
The ionic current was filtered at a bandwidth of 50 kHz with a low-pass Bessel filter and sampled at 250 kHz with a computer equipped with a Digidata 1440 A digitizer (Molecular Devices). Analysis of interevent intervals, translocation times, and current amplitude changes was performed with Clampfit 10.0 (Axon Instruments).
Conductivity measurements
The conductivities of 0.3 M, 0.5 M, and 1.0 M KCl, 5 mM HEPES, pH 7.5, containing various concentrations of urea (0–8 M) were measured with a conductivity meter at room temperature (model No. 19820-10; Cole-Parmer Instrument).
Results
Effect of urea on the ionic current passing through the pore
Urea has been reported to decrease the specific conductivity of aqueous solutions of potassium chloride (27,28). Accordingly, we found that the conductivity of buffers containing KCl (0.3, 0.5, and 1.0 M), 5 mM HEPES, pH 7.5, decreased linearly as a function of urea concentration at 4.8% M−1 (see Fig. S1 in the Supporting Material). The effects of urea can be accounted for by assuming that the conductivity at a fixed temperature is proportional to the reciprocal of the solution viscosity (29) (data not shown). We normalized the unitary conductance values of αHL pores in 1 M KCl at various urea concentrations (gurea; Fig. S2) to the values that would be obtained if the conductivity of the solution were that of 1 M KCl without urea, and expressed the result as a percentage of the measured unitary conductance of the αHL pore in the absence of urea (g0):
| (1) |
where σ0 is the conductivity of the recording buffer without urea, and σurea is the conductivity of the buffer at the urea concentration under consideration (0–8 M). When gnorm (%) was plotted against the urea concentration, we found a sigmoidal relationship showing that the conductance was reduced by more than would be expected from the effect of viscosity alone (Fig. 2). The midpoint urea concentration is 2.4 ± 0.3 M. We found similar sigmoidal relationships for the mutant homoheptameric αHL pore M113R7 (midpoint, 2.2 ± 0.2 M).
Figure 2.
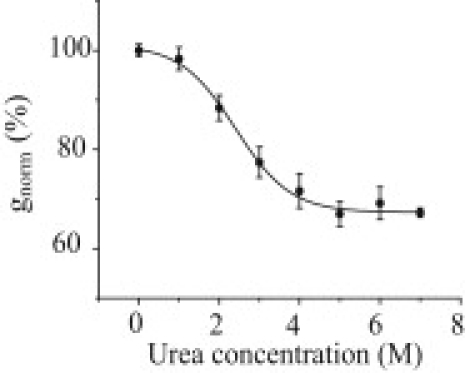
Effect of urea on gnorm (%), the normalized ionic current, passing through the αHL pore at +150 mV in 1 M KCl, 5 mM HEPES, pH 7.5. The black line indicates a sigmoidal fit with a midpoint at 2.4 ± 0.3 M urea.
Effect of urea on the secondary and tertiary structures of the αHL heptamer
The structure and stability of the WT αHL heptamer was examined in the presence of 0.3% (w/v) SDS and various concentrations of urea. SDS-PAGE analysis was used to detect the dissociation of αHL heptamers. We observed an increase in the intensity of the monomer band and a decrease in the intensity of the heptamer band when the urea concentration was increased. The percentages of monomer in 0 M and 8 M urea were 13% and 62%, respectively (Fig. 3 D).
Figure 3.
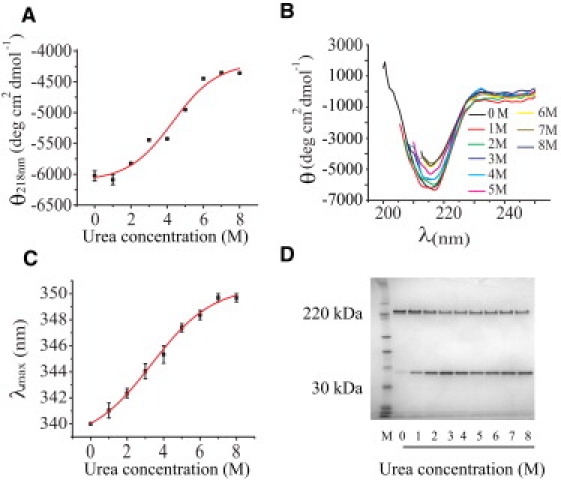
Effect of urea on the structure of the heptameric αHL pore. The CD and fluorescence spectroscopy studies were conducted after the heptamer had been incubated for 6 h in 20 mM sodium phosphate, 150 mM NaCl, 0.3% (w/v) SDS, pH 8.0, containing 0–8 M urea. (A) Change in the CD signal of the heptamer measured at 218 nm versus the urea concentration. The midpoint of the sigmoidal fit is at 4.3 ± 0.2 M. (B) CD spectra of the αHL heptamer measured at 200–250 nm at various urea concentrations. (C) Dependence of the fluorescence emission maximum (λmaxem, excitation at 280 nm) of the αHL heptamer as a function of urea concentration. The midpoint of the sigmoidal fit is at 3.3 ± 0.1 M. (D) SDS-PAGE shows the extent of dissociation of the αHL heptamer to monomer after 10 h of incubation at various urea concentrations.
Secondary-structure changes in the αHL heptamer (100 μg μL−1) upon incubation with urea were detected by using CD. The αHL cap contains the majority of the β-sheet content (69%) of the protein, and large changes in the CD spectra are unlikely to reflect the state of the stem domain. We observed changes in the mean residue molar ellipticity at 218 nm (Fig. 3 B), which is representative of β-sheet structure (30), with increasing concentrations of urea. The midpoint of the change occurred at a urea concentration of 4.3 ± 0.2 M (Fig. 3 A). A large fraction of the initial β-sheet structure (73%) remained in 8 M urea. Combined with the SDS-PAGE results, these data suggest that much of the heptamer remains stable at high concentrations of urea. The change that is observed in the CD can be attributed to the fraction of heptamer that dissociates (Fig. 3 D), which unfolds in 8 M urea (M. Henricus, unpublished data).
The effect of urea on the structure of the αHL heptamer was also investigated by means of ITFE spectroscopy, which detects changes in the fluorescence emission of tryptophan residues (280 nm). When the concentration of urea was increased from 0 M to 8 M, there was a red shift in the maximum of the fluorescence emission spectrum from 340 nm to 350 nm, reflecting transfer of the tryptophan residues to a more polar environment (31,32). The fluorescence signal showed a sigmoidal relationship to the concentration of urea, with a midpoint at a urea concentration of 3.3 ± 0.1 M (Fig. 3 C). However, the residues, which are all in the cap domain (W80, W167, W265, W286, W179, W187, W260, and W274), do not become completely exposed, considering the value of λemmax of 358 nm for N-acetyltryptophanamide in aqueous solution (26,33). Again, the changes that are observed in the ITFE can be attributed to the fraction of heptamer that dissociates and unfolds in urea.
Effect of urea on DNA translocation through the αHL pore
The addition of A30C70 (0.5–1 μM) to the cis compartment of the bilayer chamber caused current blockades arising from the reduced flux of ions while DNA passes through the pore. Events shorter than 10 μs, representing transient collisions of DNA with the mouth of the pore (1), were ignored in our analysis. Five patterns of ionic current blockade, similar to those seen in previous studies (6,34), were observed. The first blockade type was a simple low-amplitude event with ∼75–90% current block; such events were interpreted as DNA translocation events. The second event type was a simple mid-amplitude event with ∼45–75% current block; such events were interpreted as vestibule events in which DNA enters the vestibule and exits the pore from the cis side. The other three event types, which were found in only 10% of our experiments, were a mid-amplitude signal followed by a low-amplitude signal, a low-amplitude signal followed by a mid-amplitude signal, and a mid-amplitude signal followed by a low-amplitude signal followed by a second mid-amplitude signal. In our analysis, we considered only the two major types of events (i.e., translocation and vestibule events).
When the frequency of occurrence of DNA translocation events was plotted versus urea concentration at a constant voltage of +150 mV, a sigmoidal curve was observed (sigmoidal curve in Fig. 4) with a midpoint of 3.2 ± 0.4 M urea. No translocations were observed in the range of 5–7 M urea, the highest concentrations tested. At a constant current of +153 pA, the frequency of DNA translocation increased slightly as a function of urea concentration.
Figure 4.
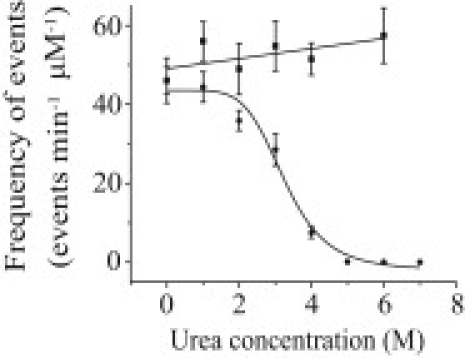
Effect of urea on the frequency of occurrence of DNA translocation through the αHL pore in 1 M KCl, 5 mM HEPES, pH 7.5. The circles indicate the frequency of DNA translocation at a constant voltage of +150 mV. The squares indicate the frequency of DNA translocation at a constant current of +153 pA (+210 mV at 6 M urea). The sigmoidal fit of the frequency of DNA translocation at a constant voltage has a midpoint at 3.2 ± 0.5 M urea. The linear line shows the trend of the frequency of DNA translocation at a constant current.
The most probable DNA translocation times (tp) through the αHL pore in 1 M KCl, 5 mM HEPES, pH 7.5, were similar at ∼125 μs at all urea concentrations between 0 and 4 M, whether the experiments were carried out at a constant voltage of +150 mV or a constant current of +153 pA (Table S1).
Effect of urea on the vestibule events
When A30C70 was threaded through the αHL pore in 1 M KCl, 5 mM HEPES, pH 7.5, in 0 M and 4 M urea, at +150 mV, translocation events (75–90% block) and vestibule events (45–75% block) were observed in both 0 M and 4 M urea (Fig. 5). In the absence of urea, the pore yielded 45% vestibule events and 55% translocation events (Fig. 5 A). By contrast, we observed only 20% vestibule events and 80% translocation events in the same buffer containing 4 M urea (Fig. 5 B).
Figure 5.
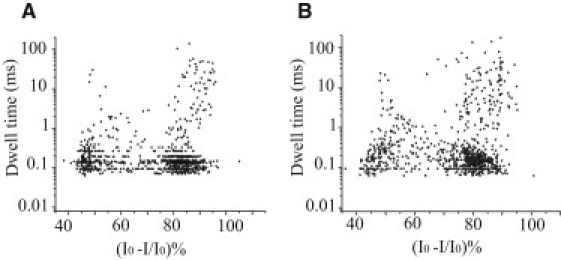
Effect of urea on the current blockades caused by the unstructured 100-nt ssDNA A30C70 with the αHL pore. (A) Scatter plot of the ionic current blockades, (I0 − I)/I0 (%), and dwell times for current blockades in the absence of urea, where I0 is the current through the open pore and I is the current during a DNA blockade. (B) Scatter plot of the ionic current blockades, (I0 − I)/I0 (%), and dwell times for current blockades in the presence of 4 M urea. Blockades < 75% represent vestibule events, and blockades > 75% represent translocation events.
Effect of urea on the secondary structures of ssDNA and ssRNA
We examined a 95-nt ssDNA (5′ GGGAGACCACAACGGTTTCCCTCTAGAAATAATTTTGTTTAACTTTAAGAAGGAGATATACATATGGCAGATTCTGATATTAATATTAAAAGGCC 3′) and a 95-nt ssRNA with the corresponding sequence. To prevent unzipping by the nanopore in the absence of urea (35), these nucleic acids have hairpins at both the 5′ and 3′ ends. The secondary structures were predicted with the Mfold program, version 3.2 (36–38). The folding temperature was 25°C, and 1 M sodium ions was selected. Mfold predicted that the ssDNA and ssRNA would form secondary structures with free energies of −12.4 kcal mol−1 and −31.8 kcal mol−1, respectively (Fig. 6, A and B).
Figure 6.
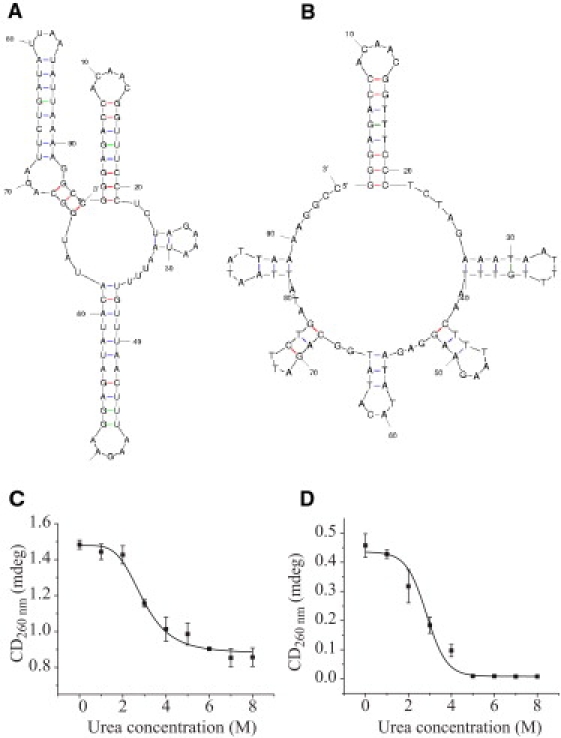
Properties of the 95-nt ssRNA and ssDNA used in this study. (A) The secondary structure of the 95-nt RNA predicted by Mfold (ΔG = −31.8 kcal mol−1). (B) The secondary structure of the 95-nt ssDNA predicted by Mfold (ΔG = −12.4 kcal mol−1). (C) The CD signal (mdeg) at 260 nm of the 95-nt RNA in 1 M KCl, 5 mM HEPES, pH 7.50, as a function of the urea concentration. The sigmoidal fit has a midpoint at 2.9 ± 0.1 M urea. (D) The CD signal (mdeg) at 260 nm of the 95-nt ssDNA, under the same conditions as in C. The sigmoidal fit has a midpoint at 2.8 ± 0.2 M urea.
The effect of urea on the secondary structures of the 95-nt ssDNA and the 95-nt ssRNA were determined by using CD. The change in the CD signal at various urea concentrations (0–8 M) in 1 M KCl, 5 mM HEPES, pH 7.5, was measured at 260 nm, which is the base stacking signal of the duplex form (22). We observed decreases of the signals with increasing urea, with midpoints at 2.9 ± 0.1 M urea for ssRNA and 2.8 ± 0.2 M urea for ssDNA (Fig. 6, C and D).
Effect of urea on the translocation of structured ssDNA and ssRNA through the αHL pore
Since translocation events for A30C70 were not observed at urea concentrations higher than 5 M, 4 M urea was used to study the effects of urea on the translocation of the secondary structure-containing ssDNA and ssRNA. At +180 mV in 1 M KCl, 5 mM HEPES, pH 7.50, in the absence of urea, the 95-nt ssDNA and 95-nt ssRNA gave very long or permanent blockades (∼70% block; Fig. 7, A and B). However, when the same DNA and RNA samples were presented to the αHL pore in the presence of 4 M urea in the same buffer, translocation events were observed, with 75–95% current blockades and translocation times similar to those of the 100-nt ssDNA with no secondary structure (A30C70; Fig. 7, C, D, and H). The translocation frequency of the 95-nt ssDNA at +180 mV was 4.2 ± 1.2 events min−1 μM−1, and tp was 153 ± 21 μs. Similarly, the translocation frequency of the 95-nt ssRNA was 3.8 ± 0.5 events min−1 μM−1, and tp was 163 ± 18 μs (Fig. 7, E, F, and H). The tp values for the ssDNA and ssRNA depended on the applied potential (Fig. 7 G). At applied potentials below +200 mV, the tp values for the 95-nt RNA were greater than those for the 95-nt ssDNA.
Figure 7.
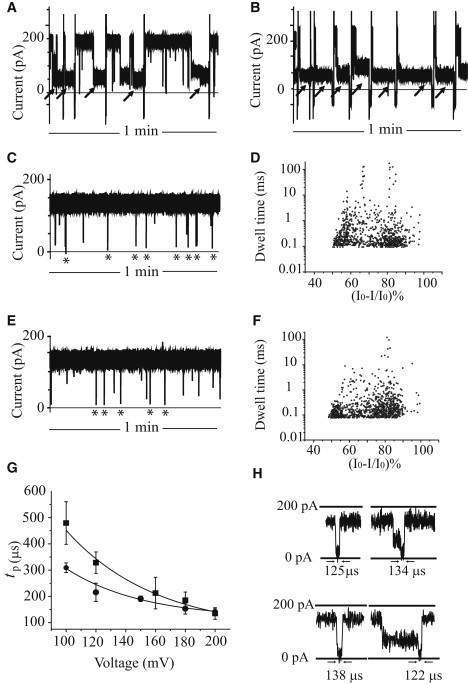
Effect of urea on the interactions of the 95-nt ssDNA and ssRNA with the αHL pore. (A) Current blockades induced by the 95-nt ssDNA in 1 M KCl, 5 mM HEPES, pH 7.5. (B) Current blockades induced by the 95-nt ssRNA in the same buffer. The very long blockades (black arrows) most likely do not correspond to DNA and RNA translocation events. The occluded pores were reopened by ramping the potential to a negative value and then back to a positive value. (C) Current blockades induced by the 95-nt ssDNA in the presence of 4 M urea. The short blockades (asterisks, 75–95% current block) represent the translocation of ssDNA. (D) Scatter plot of the ionic current blockades and dwell times for blockades induced by the 95-nt ssDNA in the presence of 4 M urea. (E) Current blockades induced by the 95-nt RNA in the presence of 4 M urea. The asterisks indicate the translocation events. (F) Scatter plot of the ionic current blockades and dwell times for blockades induced by the 95-nt RNA in the presence of 4 M urea. (G) Voltage dependence of the most probable translocation times, tp, for the 95-nt ssDNA (circles) and 95-nt ssRNA (squares) at +100 mV to +200 mV. The buffer was 1 M KCl, 5 mM HEPES, pH 7.5, containing 4 M urea. (H) Selected translocation events for the 95-nt ssDNA and RNA. (Top) 95-nt ssDNA in the presence of 4 M urea. The left-hand event is a simple low-amplitude event, which is a direct translocation of ssDNA through the pore. The right-hand event shows a mid-amplitude signal followed by a low-amplitude signal, which represents a sojourn of ssDNA in the vestibule, followed by translocation through the pore. (Bottom) 95-nt ssRNA in the presence of 4 M urea. The left-hand event shows direct translocation of ssRNA through the pore, and the right-hand event represents a sojourn in the vestibule followed by translocation.
Discussion
The purpose of this work was to devise a way in which DNA and RNA containing secondary structure might be denatured in the presence of the αHL nanopore and driven through it by an applied potential. The ability to do this would expand the range of applications for DNA analysis in which the protein pore might be used. ssDNA and ssRNA containing hairpin structures have dimensions that prevent their translocation through the αHL pore unless they are unzipped (16,17,35). We supposed that a denaturant, such as urea, could be used to unfold polynucleotides, thereby allowing their translocation. In this work, we found that a 95-nt ssDNA with extensive secondary structure in the absence of denaturants and its RNA equivalent were translocated through the pore in the presence of 4 M urea at +180 mV, but not in the absence of urea. The DNA and corresponding RNA yielded similar event frequencies and translocation times, despite the different predicted secondary structures and greater calculated stability of the RNA, suggesting that both are fully denatured under the conditions of our experiments (Fig. 6, A and B). The αHL pore remained active in up to 7 M urea, and DNA translocation could also be observed at higher urea concentrations when higher potentials were applied.
To back up our observations on nucleic acid translocation, we examined the effects of urea on the structure of the αHL pore by using various biochemical and biophysical approaches. The SDS-PAGE results suggest that a substantial fraction (30–45%) of the heptamers were unstable in 1–2 M urea, but the rest remained as heptamer even in 8 M urea. CD measurements showed a loss of β-structure with increasing urea concentration, with a midpoint at 4.3 M urea, but this loss was incomplete (27%) and substantial β-structure remained in 8 M urea. Given that monomeric αHL is completely unfolded by urea with a midpoint of 3.4 ± 0.1 M urea (M. Henricus, unpublished data), this result is consistent with the idea that it is the dissociated heptamer that unfolds, whereas the CD spectrum of the remaining intact heptamer is largely unchanged. Measurements of intrinsic tryptophan fluorescence support this view. A shift in λemmax was observed with a midpoint at 3.3 M urea, which is in keeping with the unfolding of monomer (M. Henricus, unpublished data). Two peaks of λemmax were not apparent at 8 M urea, because the λemmax of the heptamer is similar to that of unfolded monomer (M. Henricus, unpublished data). The occurrence of vestibule events during the translocation of DNA in 4 M urea also supports the notion that the cap is largely intact. Overall, these observations suggest that there is a large stable fraction of heptamer in 8 M urea, and that the structure of this heptamer is for the most part unchanged compared to the structure in the absence of urea.
Pastoriza-Gallego et al. (39,40) also examined denaturation of the αHL pore in urea. Based on an examination of the rectification characteristics of the pore in a planar bilayer, they concluded that the cap domain unfolded at 3.6 M urea, where a step change in the current asymmetry appeared to occur. We have been unable to reproduce this result, and note that the authors examined a ratio of two currents determined with significant error, with no correction for solution conductivity. Beyond this, there is little evidence for cap denaturation. For example, the authors found that the translocation times of dextran sulfate were much the same in the presence and absence of 4 M urea, and that the event frequency was only halved in 4 M urea (40). These results are similar to our findings on the transport of nucleic acids, and we therefore suggest that the αHL pore remains mostly folded in 4 M urea. It should be noted that we would expect the pore to be even more stable in a bilayer than in detergent solution (41).
It is interesting to attempt to rationalize the effects of urea on the αHL pore and nucleic acid translocation through it. We observed a reduction in the unitary conductance of the pore with increasing urea concentration, even after correction for electrolyte conductivity (Fig. 2). As noted above, we do not believe that this results from a whole-scale unfolding of the cap domain. More likely, it results from a small change in the conformation of the pore that is not detected by CD, or perhaps from an effect of urea on the lipid bilayer (42,43). It is also possible that urea binds to the surface of the lumen of the pore in a saturable manner, thereby reducing the effective cross section available for the migration of hydrated ions. The frequency of nucleic acid translocation events decreases dramatically with increased urea concentration at +180 mV. At >4 M urea, no events can be observed whether the nucleic acid has secondary structure or not, which is reminiscent of the voltage threshold for DNA translocation through the WT-αHL pore in the absence of urea (34). However, if a constant current is maintained in elevated urea, which requires an increased applied potential, translocation events are observed. During a translocation event, the majority of the current is carried by K+ ions moving in the opposite direction to the DNA, whereas in the open pore, which is weakly anion-selective, both K+ and Cl− ions carry current. It is not immediately obvious why the frequency of translocation should mirror the open-pore current. We also noted that the fraction of vestibule events found with A30C70 decreased in the presence of urea, most probably due to a decrease in the tendency of this nucleic acid to form secondary structure that is not mediated by basepairing, such as helices (44–46).
Conclusions
The translocation of single-stranded polynucleotides through protein nanopores such as the staphylococcal α-hemolysin heptamer is of interest for the further development of nucleic acid analysis and sequencing. We have demonstrated here that urea can eliminate the secondary structure of ssDNA and ssRNA, allowing it to be electrically driven through the αHL pore. The αHL pore is resistant to denaturation by urea and remains fully functional under the conditions of our experiments.
Supporting Material
One table and two figures are available at http://www.biophysj.org/biophysj/supplemental/S0006-3495(10)00146-3.
Supporting Material
Acknowledgments
We thank the referees for helpful comments.
This work was supported by grants from the European Commission's Seventh Framework Programme (FP7) READNA Consortium and the National Human Genome Research Institute, National Institutes of Health. D.J. and M.H. received graduate fellowships from the Royal Thai Government and Thailand National Science and Technology Development Agency, and the Merage Foundation, respectively.
References
- 1.Kasianowicz J.J., Brandin E., Deamer D.W. Characterization of individual polynucleotide molecules using a membrane channel. Proc. Natl. Acad. Sci. USA. 1996;93:13770–13773. doi: 10.1073/pnas.93.24.13770. [DOI] [PMC free article] [PubMed] [Google Scholar]
- 2.Song L., Hobaugh M.R., Gouaux J.E. Structure of staphylococcal α-hemolysin, a heptameric transmembrane pore. Science. 1996;274:1859–1866. doi: 10.1126/science.274.5294.1859. [DOI] [PubMed] [Google Scholar]
- 3.Henrickson S.E., Misakian M., Kasianowicz J.J. Driven DNA transport into an asymmetric nanometer-scale pore. Phys. Rev. Lett. 2000;85:3057–3060. doi: 10.1103/PhysRevLett.85.3057. [DOI] [PubMed] [Google Scholar]
- 4.Meller A., Nivon L., Branton D. Rapid nanopore discrimination between single polynucleotide molecules. Proc. Natl. Acad. Sci. USA. 2000;97:1079–1084. doi: 10.1073/pnas.97.3.1079. [DOI] [PMC free article] [PubMed] [Google Scholar]
- 5.Kasianowicz J.J., Henrickson S.E., Robertson B. Simultaneous multianalyte detection with a nanometer-scale pore. Anal. Chem. 2001;73:2268–2272. doi: 10.1021/ac000958c. [DOI] [PubMed] [Google Scholar]
- 6.Butler T.Z., Gundlach J.H., Troll M. Ionic current blockades from DNA and RNA molecules in the α-hemolysin nanopore. Biophys. J. 2007;93:3229–3240. doi: 10.1529/biophysj.107.107003. [DOI] [PMC free article] [PubMed] [Google Scholar]
- 7.Branton D., Deamer D.W., Schloss J.A. The potential and challenges of nanopore sequencing. Nat. Biotechnol. 2008;26:1146–1153. doi: 10.1038/nbt.1495. [DOI] [PMC free article] [PubMed] [Google Scholar]
- 8.Stoddart D., Heron A.J., Bayley H. Single-nucleotide discrimination in immobilized DNA oligonucleotides with a biological nanopore. Proc. Natl. Acad. Sci. USA. 2009;106:7702–7707. doi: 10.1073/pnas.0901054106. [DOI] [PMC free article] [PubMed] [Google Scholar]
- 9.Purnell R.F., Schmidt J.J. Discrimination of single base substitutions in a DNA strand immobilized in a biological nanopore. ACS Nano. 2009;3:2533–2538. doi: 10.1021/nn900441x. [DOI] [PubMed] [Google Scholar]
- 10.Benner S., Chen R.J.A., Akeson M. Sequence-specific detection of individual DNA polymerase complexes in real time using a nanopore. Nat. Nanotechnol. 2007;2:718–724. doi: 10.1038/nnano.2007.344. [DOI] [PMC free article] [PubMed] [Google Scholar]
- 11.Cockroft S.L., Chu J., Ghadiri M.R. A single-molecule nanopore device detects DNA polymerase activity with single-nucleotide resolution. J. Am. Chem. Soc. 2008;130:818–820. doi: 10.1021/ja077082c. [DOI] [PMC free article] [PubMed] [Google Scholar]
- 12.Berman H.M., Olson W.K., Schneider B. The nucleic acid database. A comprehensive relational database of three-dimensional structures of nucleic acids. Biophys. J. 1992;63:751–759. doi: 10.1016/S0006-3495(92)81649-1. [DOI] [PMC free article] [PubMed] [Google Scholar]
- 13.Brown J.W. The Ribonuclease P Database. Nucleic Acids Res. 1999;27:314. doi: 10.1093/nar/27.1.314. [DOI] [PMC free article] [PubMed] [Google Scholar]
- 14.Andersen E.S., Rosenblad M.A., Zwieb C. The tmRDB and SRPDB resources. Nucleic Acids Res. 2006;34(Database issue):D163–D168. doi: 10.1093/nar/gkj142. [DOI] [PMC free article] [PubMed] [Google Scholar]
- 15.Andronescu M., Bereg V., Condon A. RNA STRAND: the RNA secondary structure and statistical analysis database. BMC Bioinformatics. 2008;9:340. doi: 10.1186/1471-2105-9-340. [DOI] [PMC free article] [PubMed] [Google Scholar]
- 16.Lakatos G., Chou T., Patey G.N. First passage times of driven DNA hairpin unzipping. Phys. Biol. 2005;2:166–174. doi: 10.1088/1478-3975/2/3/004. [DOI] [PubMed] [Google Scholar]
- 17.DeGuzman V.S., Lee C.C., Vercoutere W.A. Sequence-dependent gating of an ion channel by DNA hairpin molecules. Nucleic Acids Res. 2006;34:6425–6437. doi: 10.1093/nar/gkl754. [DOI] [PMC free article] [PubMed] [Google Scholar]
- 18.Hayashi Y., Katsumoto Y., Yasuda A. Liquid structure of the urea-water system studied by dielectric spectroscopy. J. Phys. Chem. B. 2007;111:1076–1080. doi: 10.1021/jp065291y. [DOI] [PubMed] [Google Scholar]
- 19.Zangi R., Zhou R., Berne B.J. Urea's action on hydrophobic interactions. J. Am. Chem. Soc. 2009;131:1535–1541. doi: 10.1021/ja807887g. [DOI] [PubMed] [Google Scholar]
- 20.Lim W.K., Rösgen J., Englander S.W. Urea, but not guanidinium, destabilizes proteins by forming hydrogen bonds to the peptide group. Proc. Natl. Acad. Sci. USA. 2009;106:2595–2600. doi: 10.1073/pnas.0812588106. [DOI] [PMC free article] [PubMed] [Google Scholar]
- 21.Levine L., Gordon J.A., Jencks W.P. The relationship of structure to the effectiveness of denaturing agents for deoxyribonucleic acid. Biochemistry. 1963;2:168–175. doi: 10.1021/bi00901a030. [DOI] [PubMed] [Google Scholar]
- 22.Shelton V.M., Sosnick T.R., Pan T. Applicability of urea in the thermodynamic analysis of secondary and tertiary RNA folding. Biochemistry. 1999;38:16831–16839. doi: 10.1021/bi991699s. [DOI] [PubMed] [Google Scholar]
- 23.Koculi E., Hyeon C., Woodson S.A. Charge density of divalent metal cations determines RNA stability. J. Am. Chem. Soc. 2007;129:2676–2682. doi: 10.1021/ja068027r. [DOI] [PMC free article] [PubMed] [Google Scholar]
- 24.Sambrook J., Russell D.W. Cold Spring Harbor Laboratory Press; Cold Spring Harbor, NY: 2001. Molecular Cloning. A Laboratory Manual. [Google Scholar]
- 25.Cheley S., Braha O., Bayley H. A functional protein pore with a “retro” transmembrane domain. Protein Sci. 1999;8:1257–1267. doi: 10.1110/ps.8.6.1257. [DOI] [PMC free article] [PubMed] [Google Scholar]
- 26.Maglia G., Henricus M., Bayley H. DNA strands from denatured duplexes are translocated through engineered protein nanopores at alkaline pH. Nano Lett. 2009;9:3831–3836. doi: 10.1021/nl9020232. [DOI] [PubMed] [Google Scholar]
- 27.Tonomura T., Okamoto K. The viscosity and conductivity of aqueous solutions of electrolytes mixed with glycine and urea. Bull. Chem. Soc. Jpn. 1966;39:1621–1627. [Google Scholar]
- 28.Phang S. The viscosity and conductivity of potassium chloride and potassium iodide in glycine and urea solutions. Aust. J. Chem. 1972;25:1575–1578. [Google Scholar]
- 29.Kawahara K., Tanford C. Viscosity and density of aqueous solutions of urea and guanidine hydrochloride. J. Biol. Chem. 1966;241:3228–3232. [PubMed] [Google Scholar]
- 30.Greenfield N.J. Analysis of circular dichroism data. Methods Enzymol. 2004;383:282–317. doi: 10.1016/S0076-6879(04)83012-X. [DOI] [PubMed] [Google Scholar]
- 31.Swaminathan R., Krishnamoorthy G., Periasamy N. Similarity of fluorescence lifetime distributions for single tryptophan proteins in the random coil state. Biophys. J. 1994;67:2013–2023. doi: 10.1016/S0006-3495(94)80685-X. [DOI] [PMC free article] [PubMed] [Google Scholar]
- 32.Vivian J.T., Callis P.R. Mechanisms of tryptophan fluorescence shifts in proteins. Biophys. J. 2001;80:2093–2109. doi: 10.1016/S0006-3495(01)76183-8. [DOI] [PMC free article] [PubMed] [Google Scholar]
- 33.Lotte K., Plessow R., Brockhinke A. Static and time-resolved fluorescence investigations of tryptophan analogues—a solvent study. Photochem. Photobiol. Sci. 2004;3:348–359. doi: 10.1039/b312436c. [DOI] [PubMed] [Google Scholar]
- 34.Maglia G., Restrepo M.R., Bayley H. Enhanced translocation of single DNA molecules through α-hemolysin nanopores by manipulation of internal charge. Proc. Natl. Acad. Sci. USA. 2008;105:19720–19725. doi: 10.1073/pnas.0808296105. [DOI] [PMC free article] [PubMed] [Google Scholar]
- 35.Mathé J., Visram H., Meller A. Nanopore unzipping of individual DNA hairpin molecules. Biophys. J. 2004;87:3205–3212. doi: 10.1529/biophysj.104.047274. [DOI] [PMC free article] [PubMed] [Google Scholar]
- 36.Walter A.E., Turner D.H., Zuker M. Coaxial stacking of helixes enhances binding of oligoribonucleotides and improves predictions of RNA folding. Proc. Natl. Acad. Sci. USA. 1994;91:9218–9222. doi: 10.1073/pnas.91.20.9218. [DOI] [PMC free article] [PubMed] [Google Scholar]
- 37.Mathews D.H., Sabina J., Turner D.H. Expanded sequence dependence of thermodynamic parameters improves prediction of RNA secondary structure. J. Mol. Biol. 1999;288:911–940. doi: 10.1006/jmbi.1999.2700. [DOI] [PubMed] [Google Scholar]
- 38.Zuker M. Mfold web server for nucleic acid folding and hybridization prediction. Nucleic Acids Res. 2003;31:3406–3415. doi: 10.1093/nar/gkg595. [DOI] [PMC free article] [PubMed] [Google Scholar]
- 39.Pastoriza-Gallego M., Oukhaled G., Pelta J. Urea denaturation of α-hemolysin pore inserted in planar lipid bilayer detected by single nanopore recording: loss of structural asymmetry. FEBS Lett. 2007;581:3371–3376. doi: 10.1016/j.febslet.2007.06.036. [DOI] [PubMed] [Google Scholar]
- 40.Pastoriza-Gallego M., Gibrat G., Pelta J. Polyelectrolyte and unfolded protein pore entrance depends on the pore geometry. Biochim. Biophys. Acta. 2009;1788:1377–1386. doi: 10.1016/j.bbamem.2009.03.011. [DOI] [PubMed] [Google Scholar]
- 41.Kang X.F., Gu L.-Q., Bayley H. Single protein pores containing molecular adapters at high temperatures. Angew. Chem. Int. Ed. Engl. 2005;44:1495–1499. doi: 10.1002/anie.200461885. [DOI] [PubMed] [Google Scholar]
- 42.Feng Y., Yu Z.W., Quinn P.J. Effect of urea, dimethylurea, and tetramethylurea on the phase behavior of dioleoylphosphatidylethanolamine. Chem. Phys. Lipids. 2002;114:149–157. doi: 10.1016/s0009-3084(01)00198-0. [DOI] [PubMed] [Google Scholar]
- 43.Costa-Balogh F.O., Wennerström H., Sparr E. How small polar molecules protect membrane systems against osmotic stress: the urea-water-phospholipid system. J. Phys. Chem. B. 2006;110:23845–23852. doi: 10.1021/jp0632440. [DOI] [PubMed] [Google Scholar]
- 44.Akeson M., Branton D., Deamer D.W. Microsecond time-scale discrimination among polycytidylic acid, polyadenylic acid, and polyuridylic acid as homopolymers or as segments within single RNA molecules. Biophys. J. 1999;77:3227–3233. doi: 10.1016/S0006-3495(99)77153-5. [DOI] [PMC free article] [PubMed] [Google Scholar]
- 45.Mills J.B., Vacano E., Hagerman P.J. Flexibility of single-stranded DNA: use of gapped duplex helices to determine the persistence lengths of poly(dT) and poly(dA) J. Mol. Biol. 1999;285:245–257. doi: 10.1006/jmbi.1998.2287. [DOI] [PubMed] [Google Scholar]
- 46.Seol Y., Skinner G.M., Halperin A. Stretching of homopolymeric RNA reveals single-stranded helices and base-stacking. Phys. Rev. Lett. 2007;98:158103. doi: 10.1103/PhysRevLett.98.158103. [DOI] [PubMed] [Google Scholar]
Associated Data
This section collects any data citations, data availability statements, or supplementary materials included in this article.