Abstract
Objective: To explore the mechanisms of fulminant hepatitis (FH) in the early stages, and to determine the critical pathways in its initiation and progression. Methods: Twelve BALB/c mice were divided into four groups: one group left as negative control and sacrificed immediately after injection of phosphate-buffered saline (PBS), and another three groups with concanavalin A (Con A) administration sacrificed at 1, 3, and 6 h after injection. Affymetrix GeneChip® Mouse 430 2.0 Array was employed to evaluate the expression profile of each of the 12 samples. Further analysis was done on the microarray data to extract the genes that were differentially expressed. Enrichment analysis was carried out to determine relevant pathways within which regulated genes were significantly enriched. Results: A total of 393, 8354 and 11 344 differentially expressed genes were found, respectively, at three time points. During 0–1 h and 1–3 h, most of the pathways enriched with regulated genes were related to immune response and inflammation, among which Toll-like receptor (TLR) signaling and mitogen-activated protein kinase (MAPK) signaling appeared during both phases, while cytokine-cytokine receptor interaction, apoptosis, T cell receptor signaling, and natural killer (NK) cell-mediated cytotoxicity pathways emerged during the second phase. Pathways found to be significant during 3–6 h were mostly related to metabolic processes. Conclusion: The TLR signaling pathway dominates the early responses of Con A-induced FH in mice. It stimulates the production of type I cytokines, therefore recruiting and activating T/NK cells. Activated T/NK cells exert their cytotoxicity on hepatocytes through inducing death receptor-intermediated apoptosis, resulting in liver injury.
Keywords: Concanavalin A, Fulminant hepatitis, Microarray, Expression profile, Pathway analysis
1. Introduction
Fulminant hepatitis (FH) is a devastating inflammatory disease of the liver. It is characterized by severe deterioration in liver function with associated symptoms, including hepatic encephalopathy, jaundice, or even acute hepatic failure (Ichai and Samuel, 2008). FH usually begins with a sudden onset and progresses rapidly, leaving little time for effective treatment. Therefore it is associated with a significant mortality rate. Massive destruction of hepatocytes is commonly regarded as the direct cause of FH symptoms, and the disease may be triggered by viral hepatitis, autoimmune hepatitis, hepatotoxins or alcohol-induced liver disease. Despite its varied etiologies, the most common cause of FH in China is viral hepatitis, because China is a hepatitis B virus (HBV)-endemic country, where approximately 130 million people are living with HBV infection, among which about 1% develop FH (Sorrell et al., 2009). Although great progress has been made in the diagnosis and treatment of FH, its prognosis remains poor (Wang and Tang, 2009): a considerable proportion of patients still die or require liver transplantation. There is a limited understanding of underlying molecular mechanisms of FH (Liang, 2009), especially those at the early, initial stage of this acute inflammation process. Once we have determined the key factors and pathways that dominate the early development of FH, it might be possible to predict prognosis, or even provide early interventions.
Several animal models have already been applied in FH studies (Ning et al., 2002), and concanavalin A (Con A)-induced hepatitis in mice is a commonly used model (Kaneko et al., 2000). It is known that Con A-induced hepatitis resembles FH in many aspects (Miyazawa et al., 1998), such as severe acute liver failure, massive hepatocellular degeneration, infiltration of lymphocytes in liver, activation of T and natural killer (NK) cells (Tiegs et al., 1992), and elevated expression of various cytokines like interferon-γ (IFN-γ) and interleukin-6 (IL-6). Therefore, Con A-induced FH in mice greatly mimics the immune and inflammatory response of FH in humans. In this study, microarray experiments were undertaken to explore the expression profile of this model at multiple time points.
With the ability to interrogate the abundance of thousands of transcripts simultaneously on a genome-wide scale, microarrays are increasingly used to obtain a comprehensive insight of biological processes (Deyholos and Galbraith, 2001). Owing to the state-of-the-art commercialized microarray technology, currently, a well designed and carefully implemented array experiment can reliably screen out regulated gene sets from a biological system under investigation. This feature assists in identifying genes whose transcription profiles are responsive to Con A stimulation. Moreover, the generated list of genes exhibiting statistically significant changes in expression can be reviewed within the context of biological process/genetic network (Ashburner et al., 2000), thereby facilitating the identification of pivotal molecules and functional pathways essential to the process.
The objective of this study was to identify the affected pathways within the context of Con A-induced FH and to investigate how the changes of expression profiles forge the origination and progression of this acute inflammation process. A time-series experiment was conducted to measure the expression profiles on multiple time points and to compare the differences among them, investigating the shifts of activated molecules and pathways along the timeline and providing a picture of FH from a functional genomics view.
2. Materials and methods
2.1. Animals and treatment
Twelve 8- to 10-week-old wild-type male BALB/c mice, provided by the Animal Center, Zhejiang Academy of Medical Sciences, were housed in pathogen-free barrier facilities, with a temperature at 22 °C, relative humidity of 55%, 12-h day/night shift and free access to food and water. All 12 mice were divided into four groups randomly, three of which were tail vein-injected with Con A (type V, Sigma Chemical Co., USA) diluted in 100 μl phosphate-buffered saline (PBS), at a dosage of 20 mg/(kg body weight). The last group was injected with 100 μl PBS only, as a negative control, in the tail vein. Three Con A-treated groups were sacrificed at 1, 3, and 6 h successively after injection, while the control group was sacrificed right after injection. Liver tissues were collected and kept in liquid nitrogen for further use in microarray experiments. All animals received humane care according to the guidelines established by the National Science Council of the People’s Republic of China.
2.2. Pathologic evaluation
Small parts of the livers which were sampled at 1, 6, 12, and 24 h after Con A administration, were fixed in 4% (w/v) phosphate-buffered para-formaldehyde and embedded in paraffin. Tissue sections (4-µm thick) were prepared and stained with hematoxylin/eosin. Slides were viewed under light microscopy (magnification ×200) to investigate the inflammatory condition.
2.3. Biochemical detection
The extent of liver injury for each group was also assessed by determining serum alanine aminotransferase (ALT) level using the standard Reitman-Frankel method.
2.4. Microarray experiment
A 100-mg sample of ground liver tissue from each mouse was sent to Shanghai Biochip Co., Ltd. for RNA isolation, cDNA synthesis/labeling and array hybridization on GeneChip® platform (Affymetrix, Inc., USA). The procedures were performed according to manufacturer’s guidelines. In brief, tissues were added to pre-chilled TRIzol reagent (Invitrogen, USA), and RNA was extracted using standard Affymetrix protocols and further purified by passing through RNeasy mini-columns (QIAGEN, USA). The RNA samples isolated were run on agarose gels to examine the bands, and measured by the bioanalyzer (Agilent, USA) for quantification and quality assessment. Total RNA was reversely transcribed at first, and then transformed into biotinylated cRNA via in-vitro transcription. After a fragmentation step, the cRNA was hybridized to 12 individual Affymetrix GeneChip® Mouse 430 2.0 Arrays for 16 h. This product analyzes the expression level for over 39 000 transcripts, including over 34 000 well-substantiated mouse genes. The hybridized arrays were then linked with streptavidin phycoerythrin and stained with biotinylated anti-streptavidin antibody prior to scanning. Array scanning was the last procedure before the generation of raw image file for each chip.
2.5. Microarray data analysis
2.5.1. Array quality assessment
The microarray analysis software package Affymetrix Expression Console (AEC, Affymetrix Inc., USA) was employed to inspect the GeneChip® quality report indices. A detailed list of these measures is described in GeneChip® Data Analysis Fundamentals.
2.5.2. Absolute expression index
To convert the pixel intensity information in the array image into numerical values representing transcript abundance, we employed Robust Multi-chip Analysis (RMA) algorithm (Irizarry et al., 2003), as it is implemented in AEC. Since the method of percentile normalization is intrinsically embedded in RMA, array raw data were automatically normalized across all experimental replicates during this procedure. Normalized expression values for all experimental samples have been deposited into the National Center for Biotechnology Information (NCBI) Gene Expression Omnibus (GEO) database, under accession ID GSE17184.
2.5.3. Array correlating and clustering
Clustering of all array experiments was done using Java TreeView, and the algorithm of hierarchical clustering average linkage was employed (Eisen et al., 1998). Also, a correlation coefficient was calculated for each pair among the 12 arrays, using Pearson’s correlation algorithm. Then, a correlation heat map, representing the degree of closeness among all specimens in a matrix layout, was plotted in AEC.
2.5.4. Identification of differentially expressed genes
Array samples of any two consecutive time points were compared to filter out the up- or down-regulated genes. According to the experimental design, there are three pairs of comparisons (1 h vs. 0 h, 3 h vs. 1 h, and 6 h vs. 3 h). Statistical analysis of expression was done using significance analysis of microarrays (SAM) (Tusher et al., 2001) with the following parameter settings: test statistic=T-test; number of permutations=200, false discovery rate (FDR) threshold=0.05. SAM uses FDR as the cutoff threshold in multiple hypotheses testing to mitigate the tendency that numerous individual T-tests significantly enhance the family-wise error rate.
2.5.5. Gene functional annotation
Functional annotation and clustering of up- or down-regulated genes discovered in the above procedure was carried out by querying database for annotation, visualization and integrated discovery (DAVID) (Huang et al., 2009). Simultaneously, pathways that were enriched with up- or down-regulated genes were extracted out in this procedure. The FDR threshold for enrichment test was also 0.05.
2.5.6. Pathway analysis
Charts of affected pathways discovered in the procedure above were collected from Kyoto Encyclopedia of Genes and Genomes (KEGG) (Kanehisa et al., 2010), and expression data were then manually mapped to their corresponding pathway charts.
3. Results
3.1. Pathologic evaluation
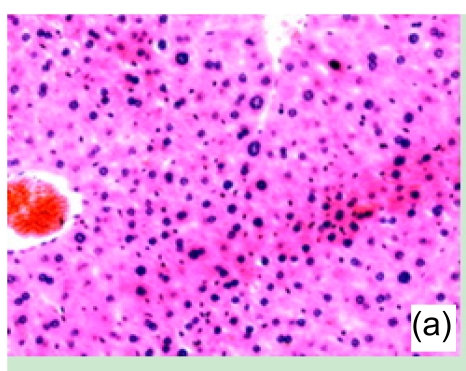
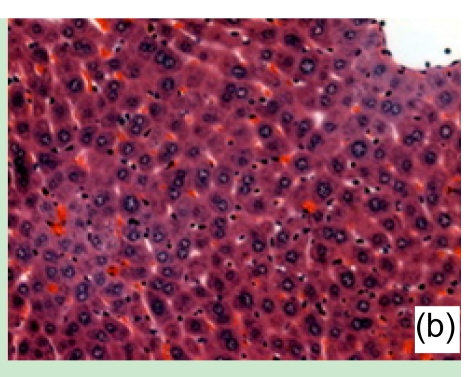
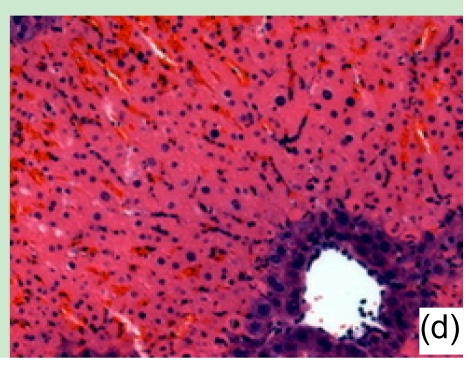
Con A-induced severe liver damage was manifested as shown in Fig. 1. At 1 h after Con A administration, lymphocyte infiltration could be seen locally around the central veins, accompanied with moderate cell swelling. At 6 h, scattered necrosis loci began to emerge, also a small quantity of congestion occurred. At 12 h, the tissue section was characterized by massive amounts of necrosis appearing around centrilobular area, and infiltrated inflammation cells markedly increased. At 24 h, the view of the liver section was full-filled with necrosis tissue.
Fig. 1.
Liver tissue sections under microscopic view (haematoxylin/eosin staining)
(a) 1 h, (b) 6 h, (c) 12 h, and (d) 24 h after Con A administration. Results presented here were representatives selected from multiple replicates
3.2. Biochemical assessment
Liver damage was also evaluated by the serum level of ALT. After Con A administration, ALT level increased by 1.7-fold at 3 h after injection, and at 6 h, by 27.9-fold (Table 1).
Table 1.
The ALT level in mouse serum after Con A administration
P<0.05, compared with 0 h group
3.3. Array correlating and clustering
Once the expression indices have been generated, the expression values of any two samples could be correlated in terms of each individual gene, one by one, to evaluate the overall similarity of their expression profile. A heat map, representing the correlation matrix of each sample pair among the total 12 arrays, is shown in Fig. 2. Here, samples from each group (treatment or control) are seen to have formed a red block of their own, implying dramatic consistency in expression profile for all replicates within the same group; whereas, different groups could also be clearly identified through their difference in color gradient. Additionally, the correlation coefficient between treatment and control groups continued decreasing as the sampling time of the treatment group increased, which means the expression profiles were more and more biased from the original over time.
Fig. 2.
Heat map for array correlation matrix
C: negative control group; T1h: treatment group (1 h); T3h: treatment group (3 h); T6h: treatment group (6 h). The following ‘1’, ‘2’ and ‘3’ denote the three biological replicates of each group. The scale bar on the right side represents the correlation coefficient. The red end implicates higher value, while the blue end implicates the opposite
Clustering provides another way of measuring array similarity, and the results are shown in Fig. 3. Replicates within each group formed tight clusters of their own, with the distances between clusters maximized, or in other words, different experimental groups neatly located on different branches of the tree.
Fig. 3.
Array clustering results displayed in TreeView
C: negative control group; T1h: treatment group (1 h); T3h: treatment group (3 h); T6h: treatment group (6 h). The following ‘1’, ‘2’ and ‘3’ denote the three biological replicates of each group
3.4. Differential expression
Significance testing of differentially expressed genes was carried out using SAM software. Each pair of experimental groups sampled at two consecutive time points was compared and the number of differentially expressed genes that underwent the significant analysis during three phases is listed in Table 2.
Table 2.
Number of differentially expressed genes during all three phases
| Phase | Number of differentially expressed genes |
|
| Up | Down | |
| 0–1 h | 314 | 79 |
| 1–3 h | 3422 | 4932 |
| 3–6 h | 6026 | 5318 |
During 0–1 h, the number of genes with altered expression level is small, just more than 300 genes were up-regulated, and this number largely exceeded the number of down-regulated. After 1 h, the numbers of both up- and down-regulated genes were markedly increased, and the number of down-regulated ones outnumbered or became close to the number of up-regulated ones.
3.5. Enrichment analysis of regulated genes
The above procedure of identifying differential expression ended up generating several lists of genes with changed expression pattern. In order to investigate their biological meaning or function, DAVID, an integrated biological knowledgebase and analytic tool, was used. Term-based singular enrichment analysis was carried out on the output gene lists to identify associated annotation terms which are enriched with regulated genes in our biological process. To view each individual gene and its relation in a comprehensive picture, pathways among all available annotation terms were concentrated upon. Pathways that are enriched with up- or down-regulated genes during the three phases are listed in Table 3.
Table 3.
Pathways enriched with differentially expressed genes during all three phases
| Phase | Change | Pathway | FDR |
| 0–1 h | Up | Toll-like receptor signaling pathway | 1.27E−4 |
| MAPK signaling pathway | 1.98E−2 | ||
| Down | None | ||
| 1–3 h | Up* | Cytokine-cytokine receptor interaction | 7.88E−6 |
| Apoptosis | 3.04E−4 | ||
| Toll-like receptor signaling pathway | 1.24E−3 | ||
| T cell receptor signaling pathway | 1.27E−3 | ||
| NK cell mediated cytotoxicity | 2.22E−3 | ||
| Acute myeloid leukemia | 2.48E−3 | ||
| Jak-STAT signaling pathway | 3.41E−3 | ||
| B cell receptor signaling pathway | 2.12E−2 | ||
| Type I diabetes mellitus | 2.73E−2 | ||
| MAPK signaling pathway | 3.09E−2 | ||
| Down | None | ||
| 3–6 h | Up | Aminoacyl-tRNA biosynthesis | 5.06E−5 |
| Protein export | 7.95E−3 | ||
| Proteasome | 8.70E−3 | ||
| Ubiquitin mediated proteolysis | 1.22E−2 | ||
| Down# | Valine, leucine and isoleucine degradation | 2.47E−5 | |
| Fatty acid metabolism | 3.33E−5 | ||
| Oxidative phosphorylation | 3.64E−5 | ||
| Butanoate metabolism | 7.18E−5 | ||
| Lysine degradation | 3.89E−4 | ||
| Porphyrin and chlorophyll metabolism | 4.63E−4 | ||
| Bile acid biosynthesis | 9.48E−4 | ||
| Fatty acid elongation in mitochondria | 1.13E−3 | ||
| Pentose and glucuronate interconversion | 1.18E−3 | ||
| Citrate cycle (TCA cycle) | 1.32E−3 | ||
FDR: false discovery rate
In this section total 12 pathways met the FDR threshold (<0.05), in brief only the top 10 in FDR were displayed
In this section total 19 pathways met the FDR threshold (<0.05), in brief only the top 10 in FDR were displayed
The number of significant pathways found during each phase continued increasing with time, largely consistent with the change of gene number in Table 2. From 0 to 3 h, most of the pathways involved were related to immune response and inflammation. During 0–1 h, only Toll-like receptor (TLR) and mitogen-activated protein kinase (MAPK) signaling emerged, while during 1–3 h, immune cells (NK, T and B cells) got involved, together with cytokine and apoptosis related pathways. Also worth mention was the absence, in both periods, of pathways enriched with down-regulated genes.
There is, however, an alteration of pathway type: after 3 h, almost all significant pathways had something to do with metabolism, most of which were enriched with down-regulated genes. What is more, none of the pathways that acted during 0–3 h continued to appear.
3.6. Pathway mapping
Given the significant pathways of the biological process under study, the expression profile of each individual gene was further mapped onto the pathway map to take advantage of the time-series experimental design. For a pathway that was found significant, the expression pattern for each of its resident genes was depicted on the pathway map. Thus, the expression profile change of related pathway elements could be visually summarized and mined, helping to reveal the interactions among them.
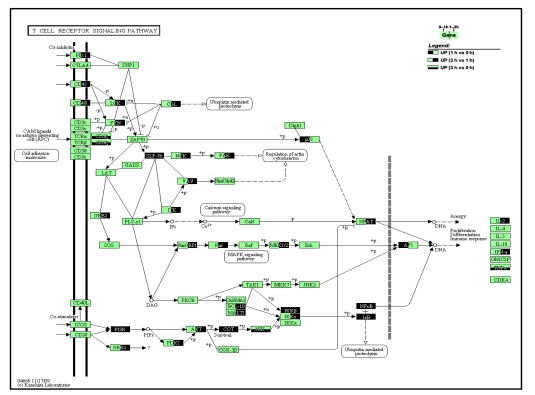
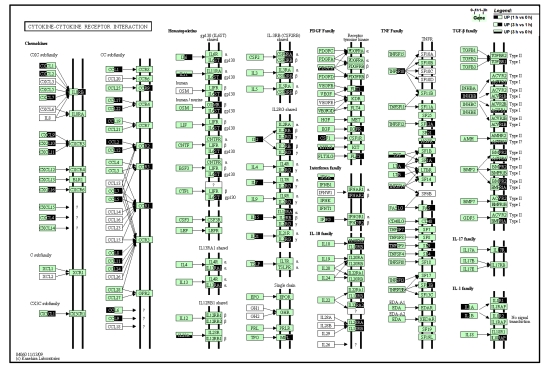
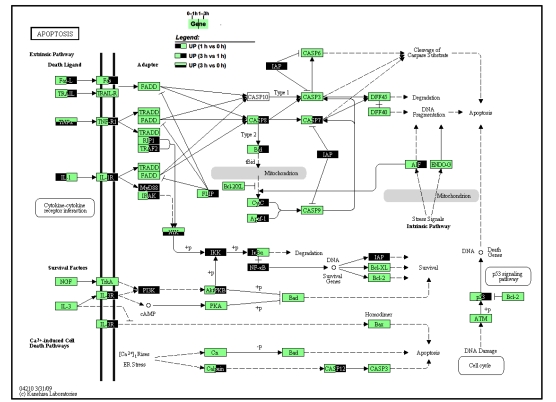
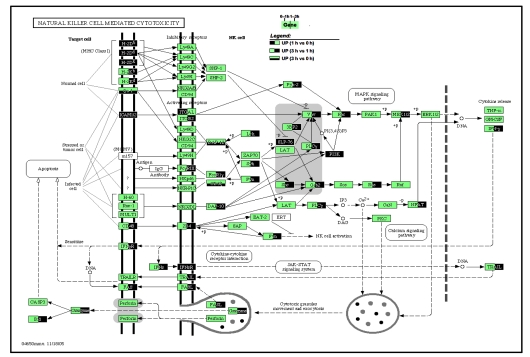
Because our primary goal is to discovery the underlying mechanisms that dominate the early initial stage of FH and there was no immune pathway found during 3–6 h (Table 3), we only mapped those pathways which were related to immune response with significant FDR during 0–1 and 1–3 h. They were depicted in Figs. 4–8.
Fig. 4.
Pathway map of Toll-like receptor signaling
Genes that were up-regulated during any phases of 0–3 h are highlighted. Left half in dark color: up-regulated between 1 h group vs. 0 h group comparison; Right half in dark: up-regulated between 3 h vs. 1 h; Lower half in dark: up-regulated between 3 h vs. 0 h
Fig. 8.
Pathway map of T cell receptor signaling
Genes that were up-regulated during any phases of 0–3 h are highlighted. Left half in dark color: up-regulated between 1 h group vs. 0 h group comparison; Right half in dark: up-regulated between 3 h vs. 1 h; Lower half in dark: up-regulated between 3 h vs. 0 h
On the pathway map of TLR signaling (Fig. 4), TLR2 and cluster of differentiation 14 (CD14) are the only two frontend receptors that were elevated at the very beginning, and their rising trend continued during 1–3 h. A universal adaptor molecule, myeloid differentiation factor 88 (MyD88), which plays a key role in transmitting TLR signaling, was also significantly up-regulated during both 0–1 and 1–3 h. Another set of components involved in early response included nuclear factor kappa-B (NF-κB) and related molecules: nuclear factor of kappa light polypeptide gene enhancer in B-cells inhibitor alpha (IκBα) and I kappa B kinase (IKK), all of which underwent a significant enhance during 0–1 h, and the latter two continued increasing during the consecutive phase. During 1–3 h, most pathway components were up-regulated, including receptors (TLR3, TLR4, and TLR9) and lipopolysaccharide-binding protein (LBP), intermediate molecules in NF-κB signaling cascade (interleukin receptor-associated kinase-4 (IRAK-4) and tumor necrosis factor (TNF)-receptor-associated factor-6 (TRAF-6)), and interferon regulatory factors (IRF-5 and IRF-7). Another character of TLR signaling activation is a universal up-regulation of its end effectors during 1–3 h mostly, including proinflammatory cytokines (IL-1β, IL-6, and TNF-α), chemotactic cytokines for NK cells (regulated upon activation, normal T cell expressed and secreted (RANTES), macrophage inflammatory protein-1α/β (MIP-1α/β)) and T cell (interferon-inducible protein-10 (IP-10), monokine induced by interferon gamma (MIG), and interferon-inducible T cell alpha chemoattractant (I-TAC)), T cell costimulatory molecules (CD40, CD86), and IFNs.
On the pathway map of cytokines’ interaction with their receptors (Fig. 5), expression levels of a bunch of CXC and CC subfamily chemokines were co-elevated with their receptors, including CXCL-1/Gro-α, CXCL-2/Gro-β, CCL-19/MIP-3β during 0–1 h, and CXCL-9/MIG, CXCL-10/IP-10, CCL-5/RANTES, CCL-7/monocyte chemotactic protein (MCP)-3, CCL-8/MCP-2, CCL-11/eotaxin-1, CCL-12/MCP-5, CCL-24/eotaxin-2 during 1–3 h, and CCL-2/MCP-1 during both phases. For interleukins that were activated, most of them had their levels significantly elevated during 1–3 h, including IL-2, IL-6, IL-15, and IL-21, while IL-1 was an exception, which was up-regulated during 0–1 h only. For the interferon family, IFN-α was regarded as up-regulated when the 3 h group was directly compared with 0 h, and the IFN-γ level was elevated during 1–3 h, together with their receptors. For the TNF family, TNF was found up-regulated through comparison of 3 h vs. 0 h, and TNFsf10/tumor necrosis factor-related apoptosis-inducing ligand (TRAIL) was up-regulated during 1–3 h. Still, there were other TNF family members including TNFsf7, TNFsf9, TNFsf10, TNFsf13, and TNFsf14, which were elevated with their corresponding receptors. For the transforming growth factor β (TGF-β) family, only one kind of ligand, inhibin beta-B (INHBB), was up-regulated along with a wide spectrum of receptors. Overall, a notable feature of cytokine secretion is that most up-regulated cytokines were type I, as the levels of IL-2, IFN-γ, and TNF-α were all elevated during 1–3 h, but was not for IL-4.
Fig. 5.
Pathway map of cytokine-cytokine receptor interaction
Genes that were up-regulated during any phases of 0–3 h are highlighted. Left half in dark color: up-regulated between 1 h group vs. 0 h group comparison; Right half in dark: up-regulated between 3 h vs. 1 h; Lower half in dark: up-regulated between 3 h vs. 0 h
On the pathway map of apoptosis (Fig. 6), extensive activation of apoptosis was manifested during 1–3 h. Three pairs of death ligands-receptors, FasL-Fas, TRAIL-TRAILR, and TNFα-TNFR, all of which have been directly linked to apoptosis process in FH (Song et al., 2003; Hatano, 2007; Ding and Yin, 2004), had either their ligand or receptor, or both, highly expressed. In the downstream, the activation along the axis of caspase-8–Bid–cytochrome C/Apaf-1–caspase-9–caspase-7 was eminent, while most of the relevant intermediate molecules were up-regulated, during 1–3 h. Besides the extrinsic pathway for apoptosis, some molecules in intrinsic pathway also were up-regulated, like p53 and apoptosis-inducing factor (AIF). Although the activation of NF-κB signaling was evident, which should have stimulated the transcription of survival genes, two important survival factors, Bcl-2/XL, remained unchanged.
Fig. 6.
Pathway map of apoptosis
Genes that were up-regulated during any phases of 0–3 h are highlighted. Left half in dark color: up-regulated between 1 h group vs. 0 h group comparison; Right half in dark: up-regulated between 3 h vs. 1 h; Lower half in dark: up-regulated between 3 h vs. 0 h
In the NK cell-mediated cytotoxicity pathway (Fig. 7), inter-cellular adhesion molecule 1/2 (ICAM 1/2) and CD48 were up-regulated with their receptors, integrin alpha L (ITGAL)/integrin beta 2 (ITGB2) and 2B4, respectively. So were receptor complexes FcγRIII, FcεR1γ, and CD3ζ. Most of the intracellular intermediate molecules were up-regulated during 1–3 h, and they ultimately stimulated the transcription of IFN-γ. There is a clear illustration of NK cell exerting its cytotoxicity, as IFN-γ is bound to its receptor to enhance the expression of FasL, or acts through the Jak-STAT pathway to induce TRAIL, both of which are ligands to death receptor and induce apoptosis as mentioned previously. Moreover, NK cell activation could act through calcium or MAPK signaling pathways, and facilitate the exocytosis of cytotoxic granules, which secret granzyme to induce apoptosis. Here, IFN-γ and IFNsR, TRAIL, Fas and FasL, granzyme were all significantly high expressed during 1–3 h.
Fig. 7.
Pathway map of natural killer cell-mediated cytotoxicity
Genes that were up-regulated during any phases of 0–3 h are highlighted. Left half in dark color: up-regulated between 1 h group vs. 0 h group comparison; Right half in dark: up-regulated between 3 h vs. 1 h; Lower half in dark: up-regulated between 3 h vs. 0 h
In the T cell receptor signaling pathway (Fig. 8), some adhesion molecules, like CD45, CD4 and CD8, were up-regulated, as was the CD3ζ component of T cell receptor (TCR). Similarly, most of the intermediate molecules along the signaling cascade were also up-regulated, and the pathway ended up with activation of transcription regulators, nuclear factor of activated T-cells (NFAT), activator protein-1 (AP-1), and NF-κB, which further stimulated the expression of molecules related to immune responses, including IL-2, IFN-γ, and TNF-α.
4. Discussion
Using microarray technology, a time-series study was conducted to explore the molecular mechanisms of FH during its very early stage. Through enrichment analysis of regulated genes, a series of biological pathways were discovered, related to FH initiation and progression. One pathway that played a key role in this process is the TLR signaling pathway, which enhanced the production of T helper 1 (Th1) cytokines, recruited cytotoxic T lymphocytes (CTLs) and NK cells, and stimulated their cytotoxicity, resulting in apoptosis of hepatocytes, followed by massive liver injury. A more detailed discussion of the significance of these findings follows.
1. Characteristics of differential expression in FH
The application of high throughput methods, such as microarray, is more frequent nowadays for obtaining a comprehensive understanding of certain biological process. It is only be possible to accomplish this goal, however, when experimental qualities are well controlled. Otherwise, further analysis on microarray data afterwards would become totally meaningless. In this experiment, not only did all quality control indices match Affymetrix’s own criteria, but also the correlation heat map (Fig. 2) and clustering dendrogram (Fig. 3) displayed expected grouping patterns. Moreover, the expression profiles became more and more biased from the original over time since injection, which is typical for an acute disease process. All these signs indicate a well controlled variability from non-biological sources. Therefore it is quite reasonable to conclude that the microarray data in this study provide accurate biological data.
As an acute inflammatory process, the ‘fulminant’ feature of FH was well reflected in analysis from a genomic point of view. As can be seen in Table 2, a large amount of genes were differentially expressed (up to several thousands), and the number of regulated genes remarkably increased between consecutive phases (up to a 10-fold change). The same conclusion could be reached through comparing the number of discovered pathways between different phases. All these significant alterations, which coincided with the rapid and drastic changes in morphology and ALT level, imply the cascade-like nature of FH; that is, the process is initiated at the very beginning with only a few and faint changes, and however, they trigger a bunch of downstream genes and pathways rapidly and simultaneously, creating a drastic change of the whole expression profile. This further emphasizes the need to explore the early events of the FH process.
It is an interesting observation that during 3–6 h, only metabolism-related pathways were found significant, while immune pathways no longer appeared anymore. For some metabolism-related genes, their expression changes were also proved at protein level (Tan et al., 2010). We believe the reason for this is that accumulated liver injury at that time was significant enough to alter its normal physiological condition; therefore, since the liver’s primary function is metabolic regulation, the consequence of liver dysfunction was finally manifested as an altered expression level of metabolic genes. This speculation is also supported by the alteration of serum ALT level, as seen in Table 1, where the fold change of ALT level increased mostly during 3–6 h. Moreover, the pathological indicators of inflammation also began to show up at 6 h.
2. Outline of pathway activation and interaction
In this study, different signaling pathways enriched with regulated genes emerged during different phases of disease, enabling us to inspect the outline of its intrinsic mechanism. From Table 3, we can see not only what had happened, but also in what sequence.
During 0–1 h, the numbers of both differentially expressed genes and significant pathways were relatively small, because that was only the first hour after Con A injection, most pathophysiologic reactions just beginning to start. At this stage, the TLR pathway was the more significant one of the two pathways. Known to be a central part of the innate immune system in mammals, the TLR system facilitates the first round of host defense response against foreign objects, and also it is rapid in onset, initiating over minutes to hours (Testro and Visvanathan, 2009). Therefore, it is natural for the TLR signaling pathway to become the first responder, mediating the early immediate responses. Since the up-regulated TLR types (TLR2, TLR3, TLR4, and TLR9) in Fig. 4 exactly matched the ones that are specifically expressed by Kupffer cells (Preiss et al., 2008), we believe the major cell type for the TLR signaling cascade to take place is the Kupffer cell. Its significant presence in the liver and role in early immune responses (Gao et al., 2002) could explain the severity and rapid onset of inflammation in this model. The question remains, however, about the reason for TLR’s full scale activation under Con A stimulation, especially in the background that TLRs in the liver usually exist in a state of reversible tolerance (Crispe, 2009). We deduced that the answer might be one of the following: (1) Rapid and continuous up-regulation of multiple kinds of TLRs (Fig. 4) reversed the tolerance. (2) The levels of endogenous host ligands were elevated, due to spreading liver damage and enhanced expression of several heat shock proteins (HSPs) (Seki and Brenner, 2008), which were found elevated in our expression profile. (3) The development of liver dysfunction will eventually lead to increased intestinal permeability, resulting uplifted lipopolysaccharide (LPS) level in portal circulation, or even endotoxemia. After receptor enhancement, TLR pathway acted through MAPK signaling to activate NF-κB, p38, and AP-1, as shown in Fig. 4, which could explain MAPK’s appearance during 0–1 h.
The consecutive phase (1–3 h) was when the immune process occurred, and pathways representing cytokine-receptor interaction (most significant one in FDR value), T cell receptor signaling and NK cell-mediated cytotoxicity emerged, together with apoptosis signaling (secondary in FDR), while the TLR pathway continued to exist and rank high. A most probable sequence of their activation would be this: continuous activation of TLR signaling cascade resulted in up-regulation of inflammatory cytokines (Th1 and T cell chemotactic cytokines mostly) and IFNs (as illustrated in the rightmost section of Fig. 4 and Fig. 5), which further facilitated recruitment of T and NK cells (Leifeld et al., 2003; Lauzon et al., 2006). These myeloid cells, gathering in liver tissue, ignited apoptosis process of hepatocytes, followed by liver injury. In this way, events happening during 1–3 h could be construed as NK and T cells exerting their cytotoxicity on hepatocytes under stimulation of abundant type I cytokines, after having been initiated by TLR system.
5. Conclusion
After all, we could see that the whole process was started with TLR signaling, through which different immune pathways were interconnected. Actually, TLR signaling has long been found to be related to immune tolerance in hepatitis. In HBV infection, for instance, impaired TLR function tends to induce chronic infection, and reduced TLR levels can protect patients against excessive inflammation (Liang, 2009; Wang and Tang, 2009). In this experiment, however, it seems that enhanced TLR activity drove the response to the other extreme.
In conclusion, suppressing the excessive TLR activity or blocking pivotal nodes in apoptosis pathway might be promising methods for FH interventions. Further analysis will concentrate on determining the binding profile of transcription factors/regulators in this process with the chromatin immunoprecipitation-sequencing (ChIP-seq) method. In this way, the reasons for differential expression may be discovered, thereby continuing to improve our understanding of its intrinsic mechanism.
Acknowledgments
We thank Prof. Xiaole Shirley LIU (Dana-Farber Cancer Institute, Harvard School of Public Health, USA) for her helpful discussion of the paper. We also thank Mr. Dong-cheng LIU (the First Affiliated Hospital, School of Medicine, Zhejiang University, China) for his help in data submission.
Footnotes
Project supported by the National Natural Science Foundation of China (No. 30771918), the National Basic Research Program (973) of China (No. 2007CB512905), and the State S & T Projects (11th Five Year) (No. 2008ZX10002-007) of China
References
- 1.Ashburner M, Ball CA, Blake JA, Botstein D, Butler H, Cherry JM, Davis AP, Dolinski K, Dwight SS, Eppig JT, et al. Gene ontology: tool for the unification of biology. Nat Gene. 2000;25(1):25–29. doi: 10.1038/75556. [DOI] [PMC free article] [PubMed] [Google Scholar]
- 2.Crispe IN. The liver as a lymphoid organ. Annu Rev Immunol. 2009;27(1):147–163. doi: 10.1146/annurev.immunol.021908.132629. [DOI] [PubMed] [Google Scholar]
- 3.Deyholos MK, Galbraith DW. High-density microarrays for gene expression analysis. Cytometry. 2001;43(4):229–238. doi: 10.1002/1097-0320(20010401)43:4<229::AID-CYTO1055>3.3.CO;2-U. [DOI] [PubMed] [Google Scholar]
- 4.Ding WX, Yin XM. Dissection of the multiple mechanisms of TNF-α-induced apoptosis in liver injury. J Cell Mol Med. 2004;8(4):445–454. doi: 10.1111/j.1582-4934.2004.tb00469.x. [DOI] [PMC free article] [PubMed] [Google Scholar]
- 5.Eisen MB, Spellman PT, Brown PO, et al. Cluster analysis and display of genome-wide expression patterns. Proc Natl Acad Sci USA. 1998;95(25):14863–14868. doi: 10.1073/pnas.95.25.14863. [DOI] [PMC free article] [PubMed] [Google Scholar]
- 6.Gao LF, Liu JY, Tang HM, Xiao WJ. Effect of Con A on macrophage activity. Chin J Cell Mol Immunol. 2002;18(2):104–106. (in Chinese) [Google Scholar]
- 7.Hatano E. Tumor necrosis factor signaling in hepatocyte apoptosis. J Gastroenterol Hepatol. 2007;22(S1):S43–S44. doi: 10.1111/j.1440-1746.2006.04645.x. [DOI] [PubMed] [Google Scholar]
- 8.Huang DW, Sherman BT, Lempicki RA. Systematic and integrative analysis of large gene lists using DAVID Bioinformatics Resources. Nature Protoc. 2009;4(1):44–57. doi: 10.1038/nprot.2008.211. [DOI] [PubMed] [Google Scholar]
- 9.Ichai P, Samuel D. Etiology and prognosis of fulminant hepatitis in adults. Liver Transpl. 2008;14(S2):S67–S79. doi: 10.1002/lt.21612. [DOI] [PubMed] [Google Scholar]
- 10.Irizarry RA, Bol BM, Collin F, Cope LM, Hobbs B, Speed TP. Summaries of Affymetrix GeneChip probe level data. Nucleic Acids Res. 2003;31(4):e15. doi: 10.1093/nar/gng015. [DOI] [PMC free article] [PubMed] [Google Scholar]
- 11.Kanehisa M, Goto S, Furumichi M, Tanabe M, Hirakawa M. KEGG for representation and analysis of molecular networks involving diseases and drugs. Nucleic Acids Res. 2010;38(database):D355–D360. doi: 10.1093/nar/gkp896. [DOI] [PMC free article] [PubMed] [Google Scholar]
- 12.Kaneko Y, Harada M, Kawano T, Yamashita M, Shibata Y, Gejyo F, Nakayama T, Taniguchi M. Augmentation of Valpha14 NKT cell-mediated cytotoxicity by interleukin 4 in an autocrine mechanism resulting in the development of concanavalin A-induced hepatitis. J Exp Med. 2000;191(1):105–114. doi: 10.1084/jem.191.1.105. [DOI] [PMC free article] [PubMed] [Google Scholar]
- 13.Lauzon NM, Mian F, MacKenzie R, Ashkar AA. The direct effects of Toll-like receptor ligands on human NK cell cytokine production and cytotoxicity. Cell Immunol. 2006;241(2):102–112. doi: 10.1016/j.cellimm.2006.08.004. [DOI] [PubMed] [Google Scholar]
- 14.Leifeld L, Dumoulin FL, Purr I, Janberg K, Trautwein C, Wolff M, Manns MP, Sauerbruch T, Spenfler U. Early up-regulation of chemokine expression in fulminant hepatic failure. J Pathol. 2003;199(3):335–344. doi: 10.1002/path.1298. [DOI] [PubMed] [Google Scholar]
- 15.Liang TJ. Hepatitis B: the virus and disease. Hepatology. 2009;49(S5):S13–S21. doi: 10.1002/hep.22881. [DOI] [PMC free article] [PubMed] [Google Scholar]
- 16.Miyazawa Y, Tsutsui H, Mizhhara H, Fujiware H, Kaneda K. In development of intrasinusoidal hemostasis in the development of concanavalin A-induced hepatic injury in mice. Hepatology. 1998;27(2):497–506. doi: 10.1002/hep.510270225. [DOI] [PubMed] [Google Scholar]
- 17.Ning Q, Yang DL, Luo XP, Hao LJ, Levy G. Fulminant viral hepatitis: mice model and its clinical implications. Chin J Hepatol. 2002;10(3):224–226. (in Chinese) [PubMed] [Google Scholar]
- 18.Preiss S, Thompson A, Chen C, Rodgers S, Markovska V, Desmond P, Visvanathan K, Li K, Locarnini S, Revill P. Characterization of the innate immune signaling pathways in hepatocyte cell lines. J Viral Hepat. 2008;15(12):888–900. doi: 10.1111/j.1365-2893.2008.01001.x. [DOI] [PubMed] [Google Scholar]
- 19.Seki E, Brenner DA. Toll-like receptors and adaptor molecules in liver disease: update. Hepatology. 2008;48(1):322–325. doi: 10.1002/hep.22306. [DOI] [PubMed] [Google Scholar]
- 20.Song E, Lee SK, Wang J, Ince N, Ouyang N, Min J, Chen J, Shankar P, Lieberman J. RNA interference targeting Fas protects mice from fulminant hepatitis. Nat Med. 2003;9(3):347–351. doi: 10.1038/nm828. [DOI] [PubMed] [Google Scholar]
- 21.Sorrell MF, Belongia EA, Costa J, Gareen IF, Grem JL, Inodomi JM, Kern ER, Mchugh JA, Petersen GM, Rein MF, et al. National Institutes of Health consensus development conference statement: management of hepatitis B. Ann Intern Med. 2009;150(2):104–110. doi: 10.7326/0003-4819-150-2-200901200-00100. [DOI] [PubMed] [Google Scholar]
- 22.Tan XF, Chen F, Wu SS, Shi Y, Liu DC, Chen Z. Proteomic analysis of differentially expressed proteins in mice with concanavalin A-induced hepatitis. J Zhejiang Univ-Sci B (Biomed & Biotechnol) 2010;11(3):221–226. doi: 10.1631/jzus.B0900351. [DOI] [PMC free article] [PubMed] [Google Scholar]
- 23.Testro AG, Visvanathan K. Toll-like receptors and their role in gastrointestinal disease. J. Gastroenterol . Hepatol. 2009;24(6):943–954. doi: 10.1111/j.1440-1746.2009.05854.x. [DOI] [PubMed] [Google Scholar]
- 24.Tiegs G, Hentschel J, Wendel A. A T cell-dependent experimental liver injury in mice inducible by concanavalin A. J Clin Invest. 1992;90(1):196–203. doi: 10.1172/JCI115836. [DOI] [PMC free article] [PubMed] [Google Scholar]
- 25.Tusher VG, Tibshirani R, Chu G. Significance analysis of microarrays applied to the ionizing radiation response. Proc Natl Acad Sci USA. 2001;98(9):5116–5121. doi: 10.1073/pnas.091062498. [DOI] [PMC free article] [PubMed] [Google Scholar]
- 26.Wang YM, Tang YZ. Antiviral therapy for hepatitis B virus associated hepatic failure. Hepatobiliary Pancreat Dis Int. 2009;8(1):17–24. [PubMed] [Google Scholar]


