

Abstract
Neurotensin (NT) is a tridecapeptide that acts as a neuromodulator in the central nervous system mainly through two NT receptors, NTS1 and NTS2. The functional-anatomical interactions between NT, the mesotelencephalic dopamine system, and structures targeted by dopaminergic projections have been studied. The present study was conducted to determine the effects of NT receptor subtypes on dopaminergic function with the use of mice lacking either NTS1 (NTS1−/−) or NTS2 (NTS2−/−). Basal and amphetamine-stimulated locomotor activity was determined. In vivo microdialysis in freely moving mice, coupled with HPLC-ECD, was used to detect basal and d-amphetamine-stimulated striatal extracellular dopamine levels. In vitro radioligand binding and synaptosomal uptake assays for the dopamine transporters were conducted to test for the expression and function of the striatal pre-synaptic dopamine transporter. NTS1−/− and NTS2−/− mice had higher baseline locomotor activity and higher basal extracellular dopamine levels in striatum. NTS1−/− mice showed higher locomotor activity and exaggerated dopamine release in response to d-amphetamine. Both NTS1−/− and NTS2−/− mice exhibited lower dopamine D1 receptor mRNA expression in the striatum relative to wild type mice. Dopamine transporter binding and dopamine reuptake in striatum were not altered. Therefore, lack of either NTS1 or NTS2 alters the dopaminergic system. The possibility that the dysregulation of dopamine transmission might stem from a deficiency in glutamate neurotransmission is discussed. The data strengthen the hypothesis that NT receptors are involved in the pathogenesis of schizophrenia and provide a potential model for the biochemical changes of the disease.
Keywords: neurotensin receptors, knockout mice, dopamine receptors, dopamine transporters, amphetamine, schizophrenia
1. Introduction
The interaction between neurotensin (NT) and dopamine (DA) has been implicated in the pathogenesis and treatment of schizophrenia (Nemeroff et al., 1983b). The involvement of the dopaminergic system in the behavioral effects of schizophrenia has emerged from the observations that drugs used to treat schizophrenia act through blocking DA receptors (Carlsson and Lindqvist, 1963) and that DA agonists such as d-amphetamine, provoke certain psychotic reactions in normal humans and exacerbate some psychotic symptoms in schizophrenics (Gainetdinov et al., 2001).
NT is a neuropeptide that is co-localized with, and is expressed throughout the brain within the nigrostriatal and mesolimbic DA system (Jennes et al., 1982; Leeman and Carraway, 1982) modulating DA neurotransmission (Fuxe et al., 1992b; Kitabgi et al., 1989; Lambert et al., 1995). Additionally, NT and NT agonists exhibit neuroleptic-like properties in DA-mediated animal models of psychosis, such as amphetamine-induced locomotor activity, apomorphine-induced climbing, and drug-induced disruption of prepulse inhibition (PPI) (Boules et al., 2001; Cusack et al., 2000; Ervin et al., 1981; Feifel et al., 1999; Ford and Marsden, 1990; Jolicoeur et al., 1983; Jolicoeur et al., 1993; Kalivas et al., 1983; Kalivas et al., 1984; Nemeroff et al., 1983a; Sarhan et al., 1997; Shilling et al., 2003). Hence, NT has been labeled the endogenous neuroleptic (Nemeroff, 1980).
NT mediates its effects through its receptors that were first identified by radioligand binding techniques. The two, most widely studied receptors are: the high affinity, levocabastine-insensitive NT receptor subtype 1 (NTS1) (Tanaka et al., 1990; Vita et al., 1993) and the low affinity, levocabastine-sensitive subtype 2 receptor (NTS2) (Chalon et al., 1996; Mazella et al., 1996). NTS1 is localized both pre- and post-synaptically with DA D2 receptors (Delle Donne et al., 2004) in the striatum, ventral midbrain, and nucleus accumbens. Its activation stimulates Ca++ release (Beauregard et al., 1992) and modulates DA transmission (Gully et al., 1993; Leonetti et al., 2004). Additionally, the lack of NT causes altered responses to antipsychotic drugs in mice (Dobner et al., 2001). NTS2 is widely distributed throughout the brain (Sarret et al., 2003) and has been implicated in spinal analgesia (Sarret et al., 2005).
Several studies have shown behavioral differences that are relevant to schizophrenia between wild type and NT or NT receptor knockout mice. Kinkead et al reported that NT knockout mice had reduced PPI and were not sensitive to the PPI-disrupting effects of amphetamine as compared to wild type mice, a result suggesting the importance of endogenous NT in the effects of amphetamine on PPI (Kinkead et al., 2005). Additionally, administration of NT receptor agonists reversed apomorphine-induced climbing in wild type, but not in NTS1−/− mice (Mechanic et al., 2009), and administration of PD149163, a NT receptor agonist, significantly facilitated PPI and decreased the acoustic startle response in wild type but not in NTS1−/− mice (Feifel et al., 2010).
Uncovering the roles NT receptors play in the brain has been approached with the use NT receptor agonists and antagonists, as well as mice lacking NT or its receptors (NTS1 or NTS2). In the present study, we used mice lacking either NTS1 or NTS2 to determine further the role of NT receptors on DA neurotransmission. Our results suggest that both NT receptor subtypes are necessary for normal dopaminergic function.
2. Materials and Methods
All animal protocols were approved by the Mayo Foundation Institutional Animal Use and Care Committee in accordance with the NIH Guide for Care and Use of Laboratory Animals. All animals were kept in an environmentally controlled room with 12 h light/dark cycle and free access to water and food.
2.1. Generation of NTS null mice
NTS1−/− and NTS2−/− mice were established at Roche (Palo Alto CA, USA) as previously described (Mechanic et al., 2009). The NTS null allele was originally created in Bruce-4 ES cells, which were derived from a C57BL/6 mouse strain. Cells were injected into BALB/c blastocysts to generate chimeras. Male chimera was mated with female C57BL/6J to give rise to the F1 or N1 heterozygotes (hets) (+/−). To ensure a pure genetic background, one additional backcross was performed (male F1 het x female C57BL/6J) to generate the N2 hets. Homozygotic knockout (−/−) and wild type (+/+) mice F2 were from N2 heterozygote x heterozygote intercrosses. These knockout and wild type mice were used to establish “in house” knockout and wild type colonies through heterozygous mating in each strain. The wild type mice were from the heterozygous progeny.
2.1.a. NT receptor (NTS) genotyping
Routine genotyping was conducted by PCR on purified tail DNA. Genomic DNA was extracted using a Qiagen DNEASY Tissue Kit (Qiagen, Valencia, CA, cat. # 69506) according to manufacturer’s instructions. The PCR mixture consisted of 45 μL PCR Supermix (Invitrogen, Carlsbad, CA, cat. # 10572-014), 4 μL of each primer (20 μM), and 5 μL DNA (100 ng). Applied Biosystems (Foster City, CA) GeneAmp PCR system 9700 thermal cycling conditions were as follows: 94°C, 3 min followed by 50 cycles of 94°C, 45 s; 58°C, 45 s; 72°C, 45 s; followed by 72°C, 7 min; and finally a 4°C soak. For visualization purposes, 14 μl of the amplification product was subjected to electrophoresis on 3% agarose mini gel/1x TAE Buffer (BIO-RAD, Hercules, CA, cat. # 161-3024) and then stained with ethidium bromide. Three primers were used to amplify the DNA of interest for NTS1 – forward primer NT1-GT2 5′ CAGGAGTGCAGACCAACCACAG 3′, reverse primer NT1-GT3 5′ GTTCACGTCCAGGTTGCTGTT 3′ and a primer specific to the TK-neo construct in the KO mice Neo- GT1 5′CCTTCTTGACGAGTTCXTTCTGAG 3′. For NTS2 – forward primer NTS2-GT-C1 5′ GTCCATTCCCCACCTCAGAAG 3′, reverse primer NTS2-GT1-C5 5′GCACCCTCCTGGTATCACACTG 3′ and a primer specific to the TK-neo construct in the KO mice NEO-GT4 5′CCTTCTATCGCCTTCTTGACGAG 3′. The expected sizes for the wild type alleles were 488 and 367 bp, for NTS1 351 bp, and for NTS2 563 bp.
2.1.b. NTS mRNA assay
mRNA levels of NTS were determined by real-time quantitative PCR. Real-time PCR was performed on the ABI 7900 TaqMan Sequence detector by using SYBR green as a dsDNA-specific binding dye. Brain total RNA was isolated using the Trizol method (Invitrogen, cat. #15596-018). RNA was purified using RNeasy cleanup/DNase set procedure (Qiagen, cat. #74103/79254). Total RNA quality was confirmed using a 2100 Agilent Bioanalyzer (Agilent Technologies, Santa Clara, CA). mRNA was amplified using One-Step RT-PCR Master Mix kit (Applied Biosystems, cat. #4309169) according to the manufacturer’s protocol. Levels of gene expression were quantitated using the comparative ddCT method (Perkin Elmer Life Sciences user bulletin number 2, 1997) with an 18 S Ribosomal RNA Probe as an endogenous reference.
2.2. d-Amphetamine-induced activity
Male knockout and wild type mice (25–32 g) were used for these experiments. Mice were divided into groups of 4–6 mice each. Activity was tested by placing each mouse in a Plexiglas Opto-Varimex Minor motility chamber (Columbus Instruments, Columbus, OH) for 2 h for acclimation. Baseline activity was recorded for 60 min for each mouse. Mice were then injected with either saline or d-amphetamine (d-amphetamine sulfate salt, 4 mg/kg i.p.) (Sigma St. Louis MO, cat. # A-5880) and then placed in the chamber. Activity was recorded for 2 h. Results are expressed as average counts per 10 min ± standard error of the mean (S.E.M).
2.3. Real-time PCR analysis
Total RNA was extracted from brain tissue with the use of TRIzol reagent (Life Technologies, Frederick, MD) and purified by RNeasy cleanup/DNase set procedure as above. Total RNA content was determined by OD260 with the use of a 2100 Agilent Bioanalyzer. Total RNA was converted to single stranded cDNA with the use of the high capacity cDNA archive kit (Applied Biosystems) according to the manufacturer’s instructions. Real-time RT-PCR was then performed to determine relative mRNA levels of dopamine D1 (DA D1) and dopamine D2 receptor (DA D2), striatum. The real-time RT-PCR reactions were performed with the use of predesigned primers and probes from Applied Biosystems, which use TaqMan DNA minor groove binding probes that are fluorescently labeled with FAM™ dye for detection. Murine 18s ribosomal RNA (Mm02601776_g1) was used for the internal control. The total reaction volume was 20 μl containing TaqMan universal PCR master mix, TaqMan primers and probes, and cDNA. Reactions were run in triplicate in optical grade 384-well plates on an ABI Prism 7900HT PCR machine with the following thermal cycling conditions: 2 min @ 50°C, 10 min @ 95°C, 40 cycles of 15 s at 95°C and 1 min at 60°C. Expression levels of each gene were calculated using the 2−ΔΔCt method (Livak and Schmittgen, 2001) with 18s RNA as an internal control. To perform this calculation, the difference in cycle threshold (ΔCt) between the gene of interest and the corresponding 18s threshold for each sample was calculated. There was no significant difference in the expression of 18s RNA between wild type, NTS1−/−, and NTS2−/− strains (14.6±0.3, 14.5±0.2 and 14.8±0.5 for wild type, NTS1−/−, and NTS2−/−, respectively). Mean ΔCt’s were calculated for each group (wild type, NTS1−/−, and NTS2−/−). The ΔΔCt was calculated by subtracting the mean ΔCt for wild type animals (control group) from the mean ΔCt for each knockout group. Numbers were then normalized to the wild type group by calculating the fold change in expression (2−ΔΔCt).
2.4. In vivo microdialysis
2.4.a. Surgery
All procedures were approved by the Mayo Foundation Institutional Animal Use and Care Committee. Wild type, NTS1−/−, and NTS2−/− mice (n=5) were housed in a temperature controlled room with 12 h light-dark cycle and free access to food and water. On the day of surgery, the adult mouse was anesthetized with gasiform isoflurane (1% isoflurane in a mixture of 20% oxygen and 80% nitrogen gas), and immobilized in a stereotaxic frame (KOPF Ins., Tujunga, CA). The anesthesia was maintained during the entire experiment. Each mouse was cannulated in the right striatum (A 0.5, L 1.6, V 2.5) according to the bregma and skull (Paxinos, 2001). Following surgery, each mouse was housed individually. The mice were kept for 3–5 d to recover from the cannulation surgery before conducting microdialysis.
2.4.b. Microdialysis procedure
Microdialysis experiments were carried out on conscious, freely moving mice. On the day of the experiment, the stylet in the guide cannula was replaced with the microdialysis probe (CMA/7 with 2 mm membrane CMA Microdialysis Inc., Acton, MA). The probe was perfused at 2 μl/min with artificial cerebrospinal fluid (146 mM NaCl, 1.2 mM CaCl2, 3 mM KCl, 1.0 mM MgCl2, 1.9 mM Na2HPO4, 0.1 mM NaH2PO4, pH 7.4). After at least 2 h equilibration, dialysate samples were automatically collected every 20 min into vials containing 2 μl perchloric acid (0.5 M) to retard oxidation of monoamines. Four baseline fractions were collected before saline i.p. injection. d-Amphetamine (d-amphetamine sulfate salt, 4 mg/kg, i.p.) was injected 1 h after saline injection. Monoamines and their metabolites were measured in the dialysate with the use of HPLC and electrochemical detector (ED) as described below. Results are reported as % increase over baseline for each strain (mean ± SEM). The position of the probe was verified by visual inspection at the end of each experiment.
2.4.c. Monoamine assay
Monoamines and their metabolites were measured on an ESA HPLC coupled with Coulochem II electrochemical detector system (ESA Inc., Chelmsford, MA) with a 20-μl sample loop. They were separated on an MD-150 analytical column (3 × 150 mm, 3 μm C18, ESA Inc.) with MDTM mobile phase (ESA Inc.) at 0.6 ml/min. Potential settings for detection were E1 at −175 mV, E2 at 250 mV, GC at 350 mV. Peaks were displayed, integrated, and stored with ESA 501 Chromatography data system (ESA Inc.). The detection limit of DA was 23 pmol.
2.5. Dopamine transporter (DAT) binding
DAT binding was done in brain homogenates from wild type, NTS1−/−, and NTS2−/− mice as previously described (Tatsumi et al., 1997) with the use of [3H]WIN35,428 (10 nM) (Perkin-Elmer Life Sciences, Boston, MA) as the radioligand. For the preparation of the homogenates, striatal tissue was homogenized in 50 mM Tris buffer pH 7.4, centrifuged at 1000 x g for 10 min at 4°C. The pellets were re-suspended in the binding assay buffer (50 mM Tris + 120 mM NaCl) with the use of a Polytron homogenizer (Brinkmann Instruments, Inc., Westbury, NY) for 10 s. The mixture was then centrifuged at 35,600 x g for 10 min at 4°C. The pellets were re-suspended in the same volume of the buffer and the centrifugation was repeated. The supernatants were decanted and the final pellets were re-suspended in assay buffer and stored at −80°C until assayed. Specific binding was calculated as the difference between the total binding (zero unlabelled WIN35,428) and nonspecific binding (excess unlabelled WIN35,428). The final protein concentration was determined by using the BCA assay (Pierce Biotechnology, Inc., Rockford, IL).
2.6. Synaptosomal Dopamine Uptake
Wild type, NTS1−/−, and NTS2−/− mice were decapitated and striatal tissues were rapidly dissected and assayed as done previously in our laboratory (Bolden-Watson et al., 1993; Carlier et al., 1998; Richelson and Pfenning, 1984). Briefly, the tissue was homogenized in a glass Potter-Elvehjem homogenizer with Teflon pestle in 40 volumes of oxygenated, ice-cold 5mM HEPES buffer containing 0.32 M sucrose and 11 mM glucose, pH 7.4. The homogenate was centrifuged at 1,000 g for 10 min and the resulting supernatant was centrifuged at 20,000 g for 20 min. The resultant pellet (P2) was gently resuspended in oxygenated incubation buffer (10.5 mM HEPES, 128 mM NaCl, 4.95 mM KCl, 1.2 mM KH2PO4, 1.2 mM MgSO4, 2.3 mM CaCl2, 10 mM dextrose, 10μM pargyline, 0.2 mg/ml sodium ascorbate). The uptake was initiated by the addition of [3H] DA (2 nM) to the synaptosomal protein and stopped after 10 min by the addition of 4 ml ice-cold 0.9% (w/v) sodium chloride Specific uptake was calculated as the difference between the total uptake (zero unlabelled neurotransmitter) and nonspecific uptake (excess unlabelled neurotransmitter). The final protein concentration was determined by using the BCA assay (Pierce Biotechnology, Inc., Rockford, IL).
2.7. DA D2 radioligand binding assay
DA D2 binding was done in brain homogenates from WT, NTS1−/−, and NTS2−/− groups as previously described (Rimondini et al., 1999) with the use of [3H]raclopride (62.2 Ci/mmol, PerkinElmer Waltham, MA). as the radioligand. For the preparation of the homogenates, striatal tissue was homogenized in assay buffer (50 mM Tris, 120 mM NaCl, 5 mM KCl, 2 mM CaCl2,1 mM MgCl2 and 40 μg/ml Bacitracin zinc salt, pH 7.4), centrifuged at 26,000 x g for 20 min at 4°C. The pellets were re-suspended in the binding assay buffer using a Polytron homogenizer (Brinkmann Instruments, Inc., Westbury, NY) for 10 s. The mixture was then centrifuged at 26,000 x g for 20 min at 4°C. The pellets were re-suspended in the same volume of the buffer and the centrifugation was repeated. The supernatants were decanted and the final pellets were re-suspended in assay buffer and stored at −80°C until assayed. The final protein concentration was determined by using the BCA assay (Pierce Biotechnology, Inc., Rockford, IL). Varying concentrations (0.1 nM to 10 μM) of raclopride were added to 96-well plates with radiolabeled raclopride (final concentration in the assay was 2 nM) and crude membrane homogenates. To achieve equilibrium conditions for the antagonists, membrane homogenates were pre-incubated for 90 min with drugs at 25°C. The reaction was stopped by rapid filtration through a Whatman GF/B glass fiber filter (presoaked in 0.1% polyethyleneimine) in a 48-place Brandel cell harvester (Brandel, Gaithersburg, MD). The filter was rapidly washed with an additional 8 ml of wash buffer, placed in a scintillation vial containing 5 ml of scintillation cocktail, and counted in a scintillation counter. Specific binding was calculated as the difference between the total binding and nonspecific binding. Data were analyzed by LIGAND (Munson and Rodbard, 1980) and presented as geometric means, with the standard error of the geometric mean being calculated as described by De Lean et al (De Lean et al., 1982). DA D1 radioligand binding assay: DA D1 was done in brain homogenates as detailed for DA D2 radioligand binding assay, except for the use of different homogenization and assay buffers and radioligand. The homogenization buffer was: 5 mM Tris-HCl, 5 mM MgCl, PH7.4; assay buffer: 50 mM Tris HCl, 120 mM NaCl, 5 mM KCl, 1.5 mM CaCl2, 4 mM MgCl2, and 1 mM EDTA). [3H]SCH23390 (250μCi, Perkin Elmer, Waltham, MA) at 20 nM final concentration was used as radioligand.
2.8. Statistical analysis
One Way Analysis of Variance (ANOVA) was performed at each time point for the amphetamine (locomotor) and microdialysis experiments followed by Tukey’s test for multiple comparisons using Sigma Stat software, with P<0.05 considered significant. Student t test was used in all other experiments.
3. Results
3.1. NTS1−/− and NTS2−/− mice
NTS1−/− and NTS2−/− knockout mice were viable at birth with no obvious physical abnormalities.
3.1.a. NT receptor genotyping
Mice were genotyped to ensure the deletion of either the NTS1 or NTS2 gene. The absence of NTS1 or NTS2 mRNA in the respective knockout mice was verified by PCR. Mice showing the 488 or 367 bp bands are wild type mice, while mice with only 351 and 563bp bands are NTS1−/− and NTS2−/− mice, respectively (Fig. 1).
Figure 1. PCR genotyping was done on DNA.

Samples were prepared as explained in Materials and Methods. A DNA ladder marker was used as the size standard (lane 1). NTS1KO=NTS1−/− ; NTS2KO=NTS2−/−
3.1.b. NT receptor mRNA levels
Total RNA from wild type, NTS1−/− and NTS2−/− knockout mice were used for real-time PCR analysis. Using the average experimental ratio, NTS1−/− and NTS2−/− mice expressed 10% and <1% mRNA values relative to wild type mice, respectively (average R.Q. values were 1.003 and 0.012 for wild type and NTS1−/− mice, respectively; and 1.086 and 0.001 for wild type and NTS2−/− mice, respectively) (Fig. 2). The increased expression of NTS2 mRNA in the NTS1−/− mice and NTS1 mRNA in the NTS2−/− mice might be due to compensation for the lack of NTS1 and NTS2, respectively.
Figure 2. Average experimental ratio for NTS1 and NTS2 mRNA using real time RT-PCR analysis of RNA from wild type, NTS1−/−, and NTS2−/− mice (n=5). Data is presented as mean ± SEM.

NTS1=NT receptor subtype 1
NTS2=NT receptor subtype 2
WT=wild type
NTS1−/− =NTS1 knockout mice
NTS2−/− =NTS2 knockout mice
3.2. Locomotor Activity
NTS1−/− and NTS2−/− mice showed significantly (F2,8=42.19, P<0.03) higher baseline activity as compared to wild type (mean±SEM: 3000±200, 1500±200, and 600±100 counts for NTS1−/−,NTS2−/−, and wild type, respectively). Similar results were seen after saline injection (2400±200, 1700±300, and 370±100 counts for NTS1−/−, NTS2−/−, and wild type mice, respectively), F2,8=15.39, P<0.02. There was no significant difference in activity between baseline and saline injection within either group. d-Amphetamine (4 mg/kg) injection significantly (P<0.05) increased locomotor activity in wild type (4500±600 counts), NTS1−/− (9700±900 counts), and NTS2−/− (5000±2000) mice. NTS1−/− mice responded to d-amphetamine injections with greater locomotor activity than that seen for WT or NTS2−/− mice (Fig. 3).
Figure 3. Baseline activity, saline- and d-amphetamine-induced locomotor activity in wild type, NTS1−/−, and NTS2−/− mice.

Activity was recorded in a plexiglass Opto-Varimax Minor activity chamber (Colombus Instruments, Colombus. OH). The mice (n=4–13) were acclimated to the activity chamber for 2h after which baseline activity was recorded for 1h. The mice were then injected with saline and 30min later with saline or d-amphetamine (4 mg/kg i.p.). Activity was recorded for 2h post the last injection. Inset shoes the time course for the baseline. Data is presented as mean ± SEM. P<0.05 is considered significant.
*significantly different from WT; $significantly different from NTS2−/−; #significantly different saline treated animals in the same genotype.
AMP= d-amphetamine
WT=wild type
NTS1−/− =NTS1 knockout mice
NTS2−/− =NTS2 knockout mice
S=saline
A=d-amphetamine
3.3. In vivo microdialysis
In addition to higher baseline locomotor hyperactivity, NTS1−/− and NTS2−/− mice showed significantly higher basal extracellular striatal DA as compared to WT mice (Table 1). Injection of d-amphetamine resulted in a significant (F2,15=17.25, P<0.001) increase in extracellular DA in NTS1−/− mice as compared to that for wild type and NTS2−/− mice (Fig, 4). There was no significant difference in the extracellular levels of the DA metabolites dihydroxyphenylacetic acid (DOPAC) and homovanillic acid (HVA) between NTS1−/−, NTS2−/− and wild type (data not shown).
Table 1.
Baseline activity and extracellular striatal DA levels in wild type, NTS1−/− and NTS2−/− mice
| Baseline counts Activity (counts/10 min) (n=4–13) | Baseline extracellular DA (nmol/L) (n=5) | |
|---|---|---|
| WT | 600±100 | 0.47±0.07 |
| NTS1−/− | 3000±200* | 0.84±0.08* |
| NTS2−/− | 1500±200* | 0.77±0.04* |
significantly different from wild type mice
Figure 4. Extracellular DA levels in medial striatum in WT, NTS1−/−, and NTS2−/− mice after d-amphetamine injection (4mg/kg i.p.) as measured by in vivo microdialysis.

Results are expressed as percentage increase above baseline for each strain (average of 6 untreated fractions) and the area under the curve (AUC) as the total percentage of increase above baseline (mean ± S.E.M, n = 4–6 mice). Inset shows the average increase in DA levels after d-amphetamine injection in WT, NTS1−/−, and NTS2−/− mice
*Significantly (P0.05) different from WT
$significantly (P0.05) different from NTS2−/−
WT=wild type
NTS1−/− =NTS1 knockout mice
NTS2−/− =NTS2 knockout mice
3.4. DAT and DA uptake
In addition to the in vivo microdialysis, the effect of the absence of the NTS1 or NTS2 gene on DAT was further studied using ex-vivo radioligand DAT binding and synaptosomal uptake assays. DAT binding and synaptosomal DA uptake were determined in striatal homogenates from wild type, NTS1−/−, and NTS2−/− mice. DAT binding was not significantly different between wild type, NTS1−/−, and NTS2−/− mice (50±5, 50±20, and 44±4 fmol/mg protein for wild type, NTS1−/−, and NTS2−/− mice, respectively). Similarly, no significant difference was detected in synaptosomal DA uptake between the three groups (48±3, 30±10, and 39±5 fmol/mg/min for wild type, NTS1−/−, and NTS2−/− mice, respectively).
3.5. DA D1 and DA D2 mRNA expression in the striatum
Both NTS1−/− (P=0.04) and NTS2−/− mice (P=0.001) showed significantly lower DA D1 mRNA expression in the striatum relative to WT mice (Fig 5). D2/D1 ratio was significantly higher in the NTS1−/− and NTS2−/− mice as compared to wild type mice (P=0.04, 2.8±0.9 for NTS1−/− and 2.4± 0.5 for NTS2−/−). The change in striatal DA receptor mRNA expression was associated with a decrease in striatal DA D2 receptor binding as measured by [3H]raclopride binding in NTS1−/− (57±9 and 29±2 fmol/mg protein for the wild type and NTS1−/− mice, respectively) and no change in the DA D1 [3H]SCH23390 binding (21±5 and 23±1 fmol/mg protein for wild type and NTS1−/−, respectively).
Figure 5. Average R.Q. ratio of DA D1 and DA D2 in the striatum for NTS1−/−, and NTS2−/− mice relative to WT mice.

Mice brains were harvested, dissected on ice and frozen at −80°C until assayed. Brain tissue was homogenized and assayed as described in Materials and Methods. Results are presented as mean ± SEM (n=4). P<0.05 is considered significant. *Significantly different from WT.
WT=wild type
NTS1−/− =NTS1 knockout mice
NTS2−/− =NTS2 knockout mice
DA D1=dopamine receptor subtype 1
DA D2=dopamine receptor subtype 2
4. Discussion
NTS1−/− mice exhibited an increased baseline locomotor activity in a novel environment and increased sensitivity to d-amphetamine-induced hyperactivity as compared to wild type mice. This increase in baseline activity in the null mice is contradictory to results reported by Remaury et al. (Remaury et al., 2002). The discrepancy in these locomotor activity results may be due to differences in the experimental designs. In the present study, the mice were acclimated to the activity chamber for 2 h and the baseline activity was measured for 1 h. On the other hand, in the study by Remaury et al. (Remaury et al., 2002), mice were placed in the activity chamber and activity was immediately recorded and for only 30 min, a time when animals are mostly going through the exploratory phase.
The injection of d-amphetamine resulted in increased activity in both wild type and knockout mice. However, the NTS1−/− mice appeared to be more sensitive to the action of d-amphetamine, because they had higher activity as compared to that for wild type and for NTS2−/− mice. These data suggest a role for endogenous NT acting at NTS1 in modulating d-amphetamine-induced activity. Additionally, these results are consistent with those of others who demonstrated that endogenous NT attenuates some behavioral responses of rats to cocaine and methamphetamine (Betancur et al., 1998; Wagstaff et al., 1994). Similarly, microinjections of SR48692 augments L-DOPA-induced hyperlocomotion, results supporting the idea that endogenous NT attenuates DA related behaviors (Chartoff et al., 2004).
The observed increase in locomotor activity in the NTS1−/− mice may be caused by the increase in striatal DA levels, and/or alterations in DA receptors. Dopaminergic neurotransmission is complex and is mediated by the distinct signaling properties of DA D1 and DA D2 receptors (Missale et al., 1998). Thus, the higher striatal DA in the NTS1−/− mice might be due to an overstimulation of the DA D2 signaling and/or an under stimulation of the DA D1 pathway (increase DA D2/DA D1 ratio) as proposed by others (Seamans et al., 2001; Seamans and Yang, 2004). In the present study, NTS1−/− mice showed significantly lower DA D1 mRNA expression and higher D2/D1 ratio in the striatum relative to WT mice. Additionally, the change in striatal DA receptor mRNA expression was associated with a decrease in striatal DA D2 receptor binding as measured by [3H]raclopride binding and no change in DA D1 [3H]SCH23390 binding. The decrease in the DA D2 receptor binding might be due to the profound differences by which the two receptor subtypes are coupled to G proteins in response to DA. DA D1 receptors are recycled to the membrane, while DA D2 receptors are targeted for degradation (Bartlett et al., 2005). However, it is not likely that the change in DA was due to changes in the DAT, since there was no difference in DAT binding or uptake between the wild type and the knockout mice.
NTS1−/− mice also showed an exaggerated release of DA in response to d-amphetamine injection (Fig. 4) and significantly lower glutamate levels in the prefrontal cortex (PFC) (2.0±0.5 and 0.8±0.1 μM for wild type and NTS1−/−, respectively) as measured by capillary electrophoresis (Li et al., personal communications). This increase in synaptic DA parallels the increase in synaptic DA following d-amphetamine challenge in patients with schizophrenia (Abi-Dargham et al., 1998; Laruelle et al., 1996) and might be secondary to the decrease in glutamate levels in the PFC, according to the model proposed by Carlsson et al. (Carlsson et al., 1999). Thus, the increase in amphetamine-induced DA release in the NTS1−/− mice may be a result of a deficiency in presynaptic glutamate control of DA neurotransmission (van Berckel et al., 2006). Such results provide additional support for the hypothesis that the dysregualtion of DA function revealed by amphetamine challenge in schizophrenic patients stems from a deficit in glutamate transmission (Laruelle et al., 2005).
The results of the present study also provide further support for the hypothesis that NT directly or indirectly (e.g., through glutamate release) modulates DA neurotransmission as related to schizophrenia. NT can modulate DA through: 1) up-regulating TH gene expression (Burgevin et al., 1992a; Burgevin et al., 1992b) or 2) decreasing the DA binding affinity for the DA D2 receptor (Fuxe et al., 1992a; Li et al., 1995). NT also opposes DA D2 receptor agonist-induced auto-inhibition of DA cell firing (Shi and Bunney, 1992). Allosteric receptor-receptor interactions between NT and DA D2 receptors as well as second messenger-dependent receptor alteration, such as phosphorylation and dephosphorylation, have also been implicated (see (Fuxe et al., 1992b) for review). It is important to mention that within the terminal fields, NT opposes the effects of DA both pre- and post-synaptically, leading either to an increase or to a decrease in DA transmission depending on the intrinsic anatomical location of NT receptors (for a more comprehensive review of the modulatory effects of NT on DA neurotransmission, we refer the reader to (Binder et al., 2001; Kinkead and Nemeroff, 2004). Since schizophrenia is associated with strongly interconnected abnormalities of glutamate and DA transmission (Laruelle et al., 2005), the effect of NT receptor deficits on dopaminergic neurotransmission might also be due to alteration in the NMDA neurotransmission.
In summary, NTS1−/− mice were spontaneously hyperactive, and were more sensitive to d-amphetamine-induced hyperactivity then were wild type mice. Additionally, NTS1−/− mice had higher basal DA levels and exaggerated DA release under conditions of DA activation as measured by in vivo microdialysis and HPLC-ECD. Taken together these data indicate a hyper-dopaminergic state similar to the excessive striatal DA activity reported in schizophrenia (Taylor et al., 2000). NTS1−/− also showed dysregulation of dopamine receptors and lower PFC glutamate in NTS1−/− mice. The modulatory effect of NT on DA transmission appears to be mediated through DA receptors and not DAT and also possibly secondarily through alterations in glutamatergic and GABAergic neurotransmission. These results provide further support for the involvement of NT receptors in the pathogenesis of schizophrenia, probably through modulating the interaction of DA/glutamate in the striatum and PFC, respectively. These data also support the use of NTS1−/− mice as a model for the biochemical changes of the disease.
Figure 6.
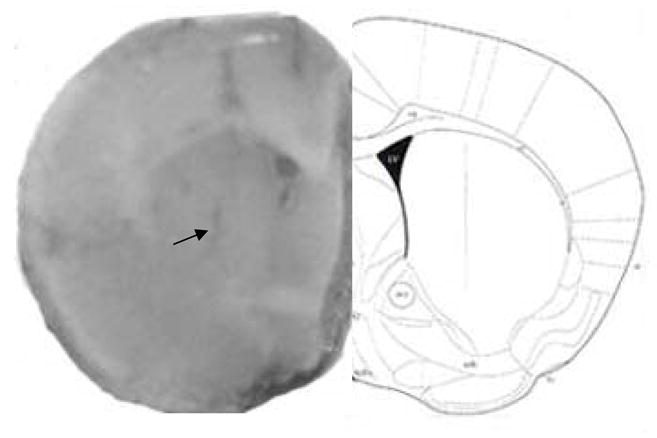
Microdialysis probe placement in the striatum (A 0.5, L 1.6, V 2.5). Numbers indicate distance (mm) from bregma. Sections are adapted from Paxinos and Franklin (Paxinos, 2001)
Acknowledgments
This work was funded was NIMH grant # MH71241 and Mayo Foundation for Medical Education and Research.
Footnotes
Publisher's Disclaimer: This is a PDF file of an unedited manuscript that has been accepted for publication. As a service to our customers we are providing this early version of the manuscript. The manuscript will undergo copyediting, typesetting, and review of the resulting proof before it is published in its final citable form. Please note that during the production process errors may be discovered which could affect the content, and all legal disclaimers that apply to the journal pertain.
References
- Abi-Dargham A, Gil R, Krystal J, Baldwin RM, Seibyl JP, Bowers M, van Dyck CH, Charney DS, Innis RB, Laruelle M. Increased striatal dopamine transmission in schizophrenia: confirmation in a second cohort. Am J Psychiatry. 1998;155:761–767. doi: 10.1176/ajp.155.6.761. [DOI] [PubMed] [Google Scholar]
- Bartlett SE, Enquist J, Hopf FW, Lee JH, Gladher F, Kharazia V, Waldhoer M, Mailliard WS, Armstrong R, Bonci A, Whistler JL. Dopamine responsiveness is regulated by targeted sorting of D2 receptors. Proc Natl Acad Sci U S A. 2005;102:11521–11526. doi: 10.1073/pnas.0502418102. [DOI] [PMC free article] [PubMed] [Google Scholar]
- Beauregard M, Ferron A, Descarries L. Opposite effects of neurotensin on dopamine inhibition in different regions of the rat brain: an iontophoretic study. Neuroscience. 1992;47:613–619. doi: 10.1016/0306-4522(92)90170-7. [DOI] [PubMed] [Google Scholar]
- Betancur C, Cabrera R, de Kloet ER, Pelaprat D, Rostene W. Role of endogenous neurotensin in the behavioral and neuroendocrine effects of cocaine. Neuropsychopharmacology. 1998;19:322–332. doi: 10.1016/S0893-133X(98)00028-1. [DOI] [PMC free article] [PubMed] [Google Scholar]
- Binder EB, Kinkead B, Owens MJ, Nemeroff CB. Neurotensin and dopamine interactions. Pharmacol Rev. 2001;53:453–486. [PubMed] [Google Scholar]
- Bolden-Watson C, Watson MA, Murray KD, Isackson PJ, Richelson E. Haloperidol but not clozapine increases neurotensin receptor mRNA levels in rat substantia nigra. J Neurochem. 1993;61:1141–1143. doi: 10.1111/j.1471-4159.1993.tb03631.x. [DOI] [PubMed] [Google Scholar]
- Boules M, Warrington L, Fauq A, McCormick D, Richelson E. A novel neurotensin analog blocks cocaine- and D-amphetamine-induced hyperactivity. Eur J Pharmacol. 2001;426:73–76. doi: 10.1016/s0014-2999(01)01197-9. [DOI] [PubMed] [Google Scholar]
- Burgevin MC, Castel MN, Quarteronet D, Chevet T, Laduron PM. Neurotensin increases tyrosine hydroxylase messenger RNA-positive neurons in substantia nigra after retrograde axonal transport. Neuroscience. 1992a;49:627–633. doi: 10.1016/0306-4522(92)90232-q. [DOI] [PubMed] [Google Scholar]
- Burgevin MC, Laduron PM, Quarteronnet D, Chevet T, Castel MN. Striatal injection of neurotensin increases tyrosine hydroxylase mRNA in substantia nigra. Ann N Y Acad Sci. 1992b;668:311–313. doi: 10.1111/j.1749-6632.1992.tb27360.x. [DOI] [PubMed] [Google Scholar]
- Carlier PR, Lo MM, Lo PC, Richelson E, Tatsumi M, Reynolds IJ, Sharma TA. Synthesis of a potent wide-spectrum serotonin-, norepinephrine-, dopamine-reuptake inhibitor (SNDRI) and a species-selective dopamine-reuptake inhibitor based on the gamma-amino alcohol functional group. Bioorg Med Chem Lett. 1998;8:487–492. doi: 10.1016/s0960-894x(98)00062-6. [DOI] [PubMed] [Google Scholar]
- Carlsson A, Lindqvist M. Effect of Chlorpromazine or Haloperidol on Formation of 3methoxytyramine and Normetanephrine in Mouse Brain. Acta Pharmacol Toxicol (Copenh) 1963;20:140–144. doi: 10.1111/j.1600-0773.1963.tb01730.x. [DOI] [PubMed] [Google Scholar]
- Carlsson A, Waters N, Carlsson ML. Neurotransmitter interactions in schizophrenia--therapeutic implications. Biol Psychiatry. 1999;46:1388–1395. doi: 10.1016/s0006-3223(99)00117-1. [DOI] [PubMed] [Google Scholar]
- Chalon P, Vita N, Kaghad M, Guillemot M, Bonnin J, Delpech B, Le Fur G, Ferrara P, Caput D. Molecular cloning of a levocabastine-sensitive neurotensin binding site. FEBS Lett. 1996;386:91–94. doi: 10.1016/0014-5793(96)00397-3. [DOI] [PubMed] [Google Scholar]
- Chartoff EH, Szczypka MS, Palmiter RD, Dorsa DM. Endogenous neurotensin attenuates dopamine-dependent locomotion and stereotypy. Brain Res. 2004;1022:71–80. doi: 10.1016/j.brainres.2004.06.061. [DOI] [PubMed] [Google Scholar]
- Cusack B, Boules M, Tyler BM, Fauq A, McCormick DJ, Richelson E. Effects of a novel neurotensin peptide analog given extracranially on CNS behaviors mediated by apomorphine and haloperidol. Brain Res. 2000;856:48–54. doi: 10.1016/s0006-8993(99)02363-x. [DOI] [PubMed] [Google Scholar]
- De Lean A, Hancock AA, Lefkowitz RJ. Validation and statistical analysis of a computer modeling method for quantitative analysis of radioligand binding data for mixtures of pharmacological receptor subtypes. Mol Pharmacol. 1982;21:5–16. [PubMed] [Google Scholar]
- Delle Donne KT, Chan J, Boudin H, Pelaprat D, Rostene W, Pickel VM. Electron microscopic dual labeling of high-affinity neurotensin and dopamine D2 receptors in the rat nucleus accumbens shell. Synapse. 2004;52:176–187. doi: 10.1002/syn.20018. [DOI] [PubMed] [Google Scholar]
- Dobner PR, Fadel J, Deitemeyer N, Carraway RE, Deutch AY. Neurotensin-deficient mice show altered responses to antipsychotic drugs. Proc Natl Acad Sci U S A. 2001;98:8048–8053. doi: 10.1073/pnas.141042198. [DOI] [PMC free article] [PubMed] [Google Scholar]
- Ervin GN, Birkemo LS, Nemeroff CB, Prange AJ. Neurotensin blocks certain amphetamine-induced behaviours. Nature. 1981;291:73–76. doi: 10.1038/291073a0. [DOI] [PubMed] [Google Scholar]
- Feifel D, Pang Z, Shilling PD, Melendez G, Schreiber R, Button D. Sensorimotor gating in neurotensin-1 receptor null mice. Neuropharmacology. 2010;58:173–178. doi: 10.1016/j.neuropharm.2009.07.002. [DOI] [PMC free article] [PubMed] [Google Scholar]
- Feifel D, Reza TL, Wustrow DJ, Davis MD. Novel antipsychotic-like effects on prepulse inhibition of startle produced by a neurotensin agonist. J Pharmacol Exp Ther. 1999;288:710–713. [PubMed] [Google Scholar]
- Ford AP, Marsden CA. In vivo neurochemical and behavioural effects of intracerebrally administered neurotensin and D-Trp11-neurotensin on mesolimbic and nigrostriatal dopaminergic function in the rat. Brain Res. 1990;534:243–250. doi: 10.1016/0006-8993(90)90135-x. [DOI] [PubMed] [Google Scholar]
- Fuxe K, Agnati LF, von Euler G, Tanganelli S, O’Connor WT, Ferre S, Hedlund P, Zoli M. Neuropeptides, excitatory amino acid and adenosine A2 receptors regulate D2 receptors via intramembrane receptor-receptor interactions. Relevance for Parkinson’s disease and schizophrenia. Neurochem Int. 1992a;20(Suppl):215S–224S. doi: 10.1016/0197-0186(92)90242-j. [DOI] [PubMed] [Google Scholar]
- Fuxe K, Von Euler G, Agnati LF, Merlo Pich E, O’Connor WT, Tanganelli S, Li XM, Tinner B, Cintra A, Carani C, et al. Intramembrane interactions between neurotensin receptors and dopamine D2 receptors as a major mechanism for the neuroleptic-like action of neurotensin. Ann N Y Acad Sci. 1992b;668:186–204. doi: 10.1111/j.1749-6632.1992.tb27350.x. [DOI] [PubMed] [Google Scholar]
- Gainetdinov RR, Mohn AR, Caron MG. Genetic animal models: focus on schizophrenia. Trends Neurosci. 2001;24:527–533. doi: 10.1016/s0166-2236(00)01886-5. [DOI] [PubMed] [Google Scholar]
- Gully D, Canton M, Boigegrain R, Jeanjean F, Molimard JC, Poncelet M, Gueudet C, Heaulme M, Leyris R, Brouard A, et al. Biochemical and pharmacological profile of a potent and selective nonpeptide antagonist of the neurotensin receptor. Proc Natl Acad Sci U S A. 1993;90:65–69. doi: 10.1073/pnas.90.1.65. [DOI] [PMC free article] [PubMed] [Google Scholar]
- Jennes L, Stumpf WE, Kalivas PW. Neurotensin: topographical distribution in rat brain by immunohistochemistry. J Comp Neurol. 1982;210:211–224. doi: 10.1002/cne.902100302. [DOI] [PubMed] [Google Scholar]
- Jolicoeur FB, De Michele G, Barbeau A, St-Pierre S. Neurotensin affects hyperactivity but not stereotypy induced by pre and post synaptic dopaminergic stimulation. Neurosci Biobehav Rev. 1983;7:385–390. doi: 10.1016/0149-7634(83)90043-x. [DOI] [PubMed] [Google Scholar]
- Jolicoeur FB, Gagne MA, Rivest R, Drumheller A, St-Pierre S. Atypical neuroleptic-like behavioral effects of neurotensin. Brain Res Bull. 1993;32:487–491. doi: 10.1016/0361-9230(93)90295-m. [DOI] [PubMed] [Google Scholar]
- Kalivas PW, Burgess SK, Nemeroff CB, Prange AJ. Behavioral and neurochemical effects of neurotensin microinjection into the ventral tegmental area of the rat. Neuroscience. 1983;8:495–505. doi: 10.1016/0306-4522(83)90195-1. [DOI] [PubMed] [Google Scholar]
- Kalivas PW, Nemeroff CB, Prange AJ. Neurotensin microinjection into the nucleus accumbens antagonizes dopamine-induced increase in locomotion and rearing. Neuroscience. 1984;11:919–930. doi: 10.1016/0306-4522(84)90203-3. [DOI] [PubMed] [Google Scholar]
- Kinkead B, Dobner PR, Egnatashvili V, Murray T, Deitemeyer N, Nemeroff CB. Neurotensin-deficient mice have deficits in prepulse inhibition: restoration by clozapine but not haloperidol, olanzapine, or quetiapine. J Pharmacol Exp Ther. 2005;315:256–264. doi: 10.1124/jpet.105.087437. [DOI] [PubMed] [Google Scholar]
- Kinkead B, Nemeroff CB. Neurotensin, schizophrenia, and antipsychotic drug action. Int Rev Neurobiol. 2004;59:327–349. doi: 10.1016/S0074-7742(04)59013-X. [DOI] [PubMed] [Google Scholar]
- Kitabgi P, Herve D, Studler JM, Tramu G, Rostene W, Tassin JP. Neurotensin/dopamine interactions. Encephale. 1989;15(Spec No):91–94. [PubMed] [Google Scholar]
- Lambert PD, Gross R, Nemeroff CB, Kilts CD. Anatomy and mechanisms of neurotensin-dopamine interactions in the central nervous system. Ann N Y Acad Sci. 1995;757:377–389. doi: 10.1111/j.1749-6632.1995.tb17496.x. [DOI] [PubMed] [Google Scholar]
- Laruelle M, Abi-Dargham A, van Dyck CH, Gil R, D’Souza CD, Erdos J, McCance E, Rosenblatt W, Fingado C, Zoghbi SS, Baldwin RM, Seibyl JP, Krystal JH, Charney DS, Innis RB. Single photon emission computerized tomography imaging of amphetamine-induced dopamine release in drug-free schizophrenic subjects. Proc Natl Acad Sci U S A. 1996;93:9235–9240. doi: 10.1073/pnas.93.17.9235. [DOI] [PMC free article] [PubMed] [Google Scholar]
- Laruelle M, Frankle WG, Narendran R, Kegeles LS, Abi-Dargham A. Mechanism of action of antipsychotic drugs: from dopamine D(2) receptor antagonism to glutamate NMDA facilitation. Clin Ther. 2005;27(Suppl A):S16–24. doi: 10.1016/j.clinthera.2005.07.017. [DOI] [PubMed] [Google Scholar]
- Leeman SE, Carraway RE. Neurotensin: discovery, isolation, characterization, synthesis and possible physiological roles. Ann N Y Acad Sci. 1982;400:1–16. doi: 10.1111/j.1749-6632.1982.tb31557.x. [DOI] [PubMed] [Google Scholar]
- Leonetti M, Brun P, Clerget M, Steinberg R, Soubrie P, Renaud B, Suaud-Chagny MF. Specific involvement of neurotensin type 1 receptor in the neurotensin-mediated in vivo dopamine efflux using knock-out mice. J Neurochem. 2004;89:1–6. doi: 10.1046/j.1471-4159.2003.02231.x. [DOI] [PubMed] [Google Scholar]
- Li XM, Ferraro L, Tanganelli S, O’Connor WT, Hasselrot U, Ungerstedt U, Fuxe K. Neurotensin peptides antagonistically regulate postsynaptic dopamine D2 receptors in rat nucleus accumbens: a receptor binding and microdialysis study. J Neural Transm Gen Sect. 1995;102:125–137. doi: 10.1007/BF01276508. [DOI] [PubMed] [Google Scholar]
- Livak KJ, Schmittgen TD. Analysis of relative gene expression data using real-time quantitative PCR and the 2(-Delta Delta C(T)) Method. Methods. 2001;25:402–408. doi: 10.1006/meth.2001.1262. [DOI] [PubMed] [Google Scholar]
- Mazella J, Botto JM, Guillemare E, Coppola T, Sarret P, Vincent JP. Structure, functional expression, and cerebral localization of the levocabastine-sensitive neurotensin/neuromedin N receptor from mouse brain. J Neurosci. 1996;16:5613–5620. doi: 10.1523/JNEUROSCI.16-18-05613.1996. [DOI] [PMC free article] [PubMed] [Google Scholar]
- Mechanic JA, Sutton JE, Berson AE, Wu X, Kwan J, Schreiber R, Pang Z, Button DC. Involvement of the neurotensin receptor 1 in the behavioral effects of two neurotensin agonists, NT-2 and NT69L: lack of hypothermic, antinociceptive and antipsychotic actions in receptor knockout mice. Eur Neuropsychopharmacol. 2009;19:466–475. doi: 10.1016/j.euroneuro.2009.01.004. [DOI] [PubMed] [Google Scholar]
- Missale C, Nash SR, Robinson SW, Jaber M, Caron MG. Dopamine receptors: from structure to function. Physiol Rev. 1998;78:189–225. doi: 10.1152/physrev.1998.78.1.189. [DOI] [PubMed] [Google Scholar]
- Munson PJ, Rodbard D. Ligand: a versatile computerized approach for characterization of ligand-binding systems. Anal Biochem. 1980;107:220–239. doi: 10.1016/0003-2697(80)90515-1. [DOI] [PubMed] [Google Scholar]
- Nemeroff CB. Neurotensin: perchance an endogenous neuroleptic? Biol. Psychiatry. 1980;15:283–302. [PubMed] [Google Scholar]
- Nemeroff CB, Luttinger D, Hernandez DE, Mailman RB, Mason GA, Davis SD, Widerlov E, Frye GD, Kilts CA, Beaumont K, Breese GR, Prange AJ. Interactions of neurotensin with brain dopamine systems: biochemical and behavioral studies. J Pharmacol Exp Ther. 1983a;225:337–345. [PubMed] [Google Scholar]
- Nemeroff CB, Youngblood WW, Manberg PJ, Prange AJ, Kizer JS. Regional brain concentrations of neuropeptides in Huntington’s chorea and schizophrenia. Science. 1983b;221:972–975. doi: 10.1126/science.6136092. [DOI] [PubMed] [Google Scholar]
- Paxinos G, Franklin K. The mouse brain in stereotaxic coordinates. Academic Press; NY: 2001. [Google Scholar]
- Remaury A, Vita N, Gendreau S, Jung M, Arnone M, Poncelet M, Culouscou JM, Le Fur G, Soubrie P, Caput D, Shire D, Kopf M, Ferrara P. Targeted inactivation of the neurotensin type 1 receptor reveals its role in body temperature control and feeding behavior but not in analgesia. Brain Res. 2002;953:63–72. doi: 10.1016/s0006-8993(02)03271-7. [DOI] [PubMed] [Google Scholar]
- Richelson E, Pfenning M. Blockade by antidepressants and related compounds of biogenic amine uptake into rat brain synaptosomes: most antidepressants selectively block norepinephrine uptake. Eur J Pharmacol. 1984;104:277–286. doi: 10.1016/0014-2999(84)90403-5. [DOI] [PubMed] [Google Scholar]
- Rimondini R, Fuxe K, Ferre S. Multiple intramembrane receptor-receptor interactions in the regulation of striatal dopamine D2 receptors. Neuroreport. 1999;10:2051–2054. doi: 10.1097/00001756-199907130-00011. [DOI] [PubMed] [Google Scholar]
- Sarhan S, Hitchcock JM, Grauffel CA, Wettstein JG. Comparative antipsychotic profiles of neurotensin and a related systemically active peptide agonist. Peptides. 1997;18:1223–1227. doi: 10.1016/s0196-9781(97)00145-9. [DOI] [PubMed] [Google Scholar]
- Sarret P, Esdaile MJ, Perron A, Martinez J, Stroh T, Beaudet A. Potent spinal analgesia elicited through stimulation of NTS2 neurotensin receptors. J Neurosci. 2005;25:8188–8196. doi: 10.1523/JNEUROSCI.0810-05.2005. [DOI] [PMC free article] [PubMed] [Google Scholar]
- Sarret P, Perron A, Stroh T, Beaudet A. Immunohistochemical distribution of NTS2 neurotensin receptors in the rat central nervous system. J Comp Neurol. 2003;461:520–538. doi: 10.1002/cne.10718. [DOI] [PubMed] [Google Scholar]
- Seamans JK, Gorelova N, Durstewitz D, Yang CR. Bidirectional dopamine modulation of GABAergic inhibition in prefrontal cortical pyramidal neurons. J Neurosci. 2001;21:3628–3638. doi: 10.1523/JNEUROSCI.21-10-03628.2001. [DOI] [PMC free article] [PubMed] [Google Scholar]
- Seamans JK, Yang CR. The principal features and mechanisms of dopamine modulation in the prefrontal cortex. Prog Neurobiol. 2004;74:1–58. doi: 10.1016/j.pneurobio.2004.05.006. [DOI] [PubMed] [Google Scholar]
- Shi WX, Bunney BS. Roles of intracellular cAMP and protein kinase A in the actions of dopamine and neurotensin on midbrain dopamine neurons. J Neurosci. 1992;12:2433–2438. doi: 10.1523/JNEUROSCI.12-06-02433.1992. [DOI] [PMC free article] [PubMed] [Google Scholar]
- Shilling PD, Richelson E, Feifel D. The effects of systemic NT69L, a neurotensin agonist, on baseline and drug-disrupted prepulse inhibition. Behavioural Brain Research. 2003;143:7–14. doi: 10.1016/s0166-4328(03)00037-8. [DOI] [PubMed] [Google Scholar]
- Tanaka K, Masu M, Nakanishi S. Structure and functional expression of the cloned rat neurotensin receptor. Neuron. 1990;4:847–854. doi: 10.1016/0896-6273(90)90137-5. [DOI] [PubMed] [Google Scholar]
- Tatsumi M, Groshan K, Blakely RD, Richelson E. Pharmacological profile of antidepressants and related compounds at human monoamine transporters. Eur J Pharmacol. 1997;340:249–258. doi: 10.1016/s0014-2999(97)01393-9. [DOI] [PubMed] [Google Scholar]
- Taylor SF, Koeppe RA, Tandon R, Zubieta JK, Frey KA. In vivo measurement of the vesicular monoamine transporter in schizophrenia. Neuropsychopharmacology. 2000;23:667–675. doi: 10.1016/S0893-133X(00)00165-2. [DOI] [PubMed] [Google Scholar]
- van Berckel BN, Kegeles LS, Waterhouse R, Guo N, Hwang DR, Huang Y, Narendran R, Van Heertum R, Laruelle M. Modulation of amphetamine-induced dopamine release by group II metabotropic glutamate receptor agonist LY354740 in non-human primates studied with positron emission tomography. Neuropsychopharmacology. 2006;31:967–977. doi: 10.1038/sj.npp.1300902. [DOI] [PubMed] [Google Scholar]
- Vita N, Laurent P, Lefort S, Chalon P, Dumont X, Kaghad M, Gully D, Le Fur G, Ferrara P, Caput D. Cloning and expression of a complementary DNA encoding a high affinity human neurotensin receptor. FEBS Lett. 1993;317:139–142. doi: 10.1016/0014-5793(93)81509-x. [DOI] [PubMed] [Google Scholar]
- Wagstaff JD, Bush LG, Gibb JW, Hanson GR. Endogenous neurotensin antagonizes methamphetamine-enhanced dopaminergic activity. Brain Res. 1994;665:237–244. doi: 10.1016/0006-8993(94)91343-9. [DOI] [PubMed] [Google Scholar]