Abstract
We present a computational method for identifying potential targets of a transcription factor (TF) using wild-type gene expression time series data. For each putative target gene we fit a simple differential equation model of transcriptional regulation, and the model likelihood serves as a score to rank targets. The expression profile of the TF is modeled as a sample from a Gaussian process prior distribution that is integrated out using a nonparametric Bayesian procedure. This results in a parsimonious model with relatively few parameters that can be applied to short time series datasets without noticeable overfitting. We assess our method using genome-wide chromatin immunoprecipitation (ChIP-chip) and loss-of-function mutant expression data for two TFs, Twist, and Mef2, controlling mesoderm development in Drosophila. Lists of top-ranked genes identified by our method are significantly enriched for genes close to bound regions identified in the ChIP-chip data and for genes that are differentially expressed in loss-of-function mutants. Targets of Twist display diverse expression profiles, and in this case a model-based approach performs significantly better than scoring based on correlation with TF expression. Our approach is found to be comparable or superior to ranking based on mutant differential expression scores. Also, we show how integrating complementary wild-type spatial expression data can further improve target ranking performance.
Keywords: Bayesian inference, Gaussian process inference, gene regulation, gene regulatory network, systems biology
Transcription factors are key nodes in the gene regulatory networks that determine the function and fate of cells. An important first step in uncovering a gene regulatory network is the identification of target genes regulated by a specific transcription factor (TF). A common approach to this problem is to experimentally locate physical binding of TF proteins to the DNA sequence in vivo using a genome-wide chromatin immunoprecipitation (ChIP) experiment (1, 2). However, recent studies suggest that many observed binding events are neutral and do not regulate transcription, while regulatory binding events often occur at enhancers that are not proximal to the target gene that they control (3, 4). Therefore, the task of identifying transcriptional targets requires the integration of ChIP binding predictions with evidence from expression data to help associate binding events with target gene regulation. If there is access to expression data from a mutant in which the TF has been knocked out or overexpressed, then differential expression of genes between wild type and mutant is indicative of a potential regulatory interaction (5, 6). Available spatial expression data for the TF and the putative target can also provide support for a hypothesized regulatory link.
A problem with the above approach is that the creation of mutant strains is challenging or impossible for many TFs of interest. Even when available, mutants may provide very limited information because of redundancy or due to the confounding of signal from indirect regulatory feedback (7). For these reasons it is useful to seek other sources of evidence to complement ChIP binding predictions. In this contribution we demonstrate how a dynamical model of wild-type transcriptional regulation can be used for genome-wide scoring of putative target genes. All that is required to apply our method is wild-type time series data collected over a period where TF activity is changing. Our approach allows for complementary evidence from expression data to be integrated with ChIP binding data for a specific TF without carrying out TF perturbations.
To score putative targets we use the data likelihood under a simple cascaded differential equation model of transcriptional regulation. The regulation model we apply is “open” in the sense that we do not explicitly model regulation of the TF itself. To deal with this technical issue we use a recently developed nonparametric probabilistic inference methodology to effectively deal with open differential equation systems (8). We model the TF concentration as a function drawn from a Gaussian process prior distribution (9, 10). This functional prior can either be placed on the TF mRNA, for TFs primarily under transcriptional regulation, or the TF protein, for TFs activated posttranslationally. In the application considered here the TFs are transcriptionally regulated, and we take the former approach. We use Bayesian marginalization (also known as Bayesian model averaging) to integrate out these functional degrees of freedom. This greatly reduces the number of parameters required to model the data, making a likelihood-based approach feasible even for short time series.
There are many existing approaches to inferring gene regulatory networks from time series expression data, including dynamic Bayesian networks, information theoretic approaches, and differential equation approaches (reviewed in ref. 11). These methods typically require many more data from a greater diversity of experimental conditions than are available from the short unperturbed wild-type time series that we consider. Indeed, most real gene expression time course data are short relative to the simulated data used to assess computational methods for network inference (12). However, our goal is more limited in scope since we are primarily interested in providing additional support for hypothesized targets of a specific TF. Again, most approaches to this problem are designed for data containing large numbers of diverse conditions, as exemplified by the DREAM 2 (Dialogue for Reverse Engineering Assessments and Methods 2) target identification challenge 1 (13). Others have addressed this target identification problem using time series data with a regulation model (14, 15). However, these approaches either require a known target set for training (14) or they require measured TF protein data (15). In addition to these differences in the assumed prior knowledge and available data, it is also difficult to validate other approaches on the same data used in these studies as they carried out validation only of selected targets that they identified, rather than using unbiased genome-wide experimental validation.
We validate our proposed method by comparing the model-based target ranking with published ChIP-chip data for two TFs controlling mesoderm development in Drosophila. Our method is shown to be comparable to, or out-perform, the use of knockout mutant data, which are available for these TFs. We demonstrate that a model-based approach is significantly better than a simpler approach using correlation when targets display a diverse set of expression profiles. We further show how integrating complementary wild-type spatial in situ expression data can greatly improve target ranking accuracy.
Gaussian Process Inference for a Linear Activation Model.
A Gaussian process is a probability distribution over functions f that take the value f(t) at time t. Analogous to the Gaussian distribution, which is fully characterized by a mean and covariance, the Gaussian process is characterized by a mean function E[f(t)] and a covariance function k(t,t′) = E[f(t)f(t′)] - E[f(t)]E[f(t′)], where the expectation is over function evaluations at times t and t′ (9).
For the prior distribution of TF mRNA concentration profile f, we use a zero-mean Gaussian process with squared exponential covariance k(t,t′) = a exp[-(t - t′)2/l2]. Samples from a Gaussian process with this choice of covariance are smooth, infinitely differentiable, stationary functions. Although single-cell mRNA counts may be low and vary in a highly stochastic manner, here we consider microarray data that corresponds to a population average and is therefore more appropriately modeled using a smooth process. The parameters a and l describe the typical amplitude and time scale of samples from the prior.
To simplify the inference we model translation and transcriptional activation using linear ordinary differential equations,
 |
[1] |
 |
[2] |
where p(t) is the TF protein and mj(t) is the jth target mRNA concentration at time t. The parameters Bj, Sj, and Dj are the baseline transcription rate, sensitivity, and decay rate, respectively, for the mRNA of the jth target (as described in ref. 14). The parameter δ is the decay rate of the TF protein. This linear system of differential equations can be explicitly solved, and we find that the functions p and mj are linear functions of f. Given k target genes, the functions f and m ≡ [mj] therefore describe a k + 1-dimensional Gaussian process prior p(f,m|θ) for which the covariance function can be calculated explicitly in terms of the three global and 3k gene-dependent model parameters θ = [δ,a,l,{Bj,Sj,Dj}] (see Materials and Methods).
A microarray time-course experiment provides a data vector y containing the noise-corrupted TF and target mRNA measurements at n times,  . In this continuous-time modeling framework, there is no requirement that times are equally spaced. We assume Gaussian noise:
  , where the gene and condition specific measurement variance parameters
  and
and  are obtained from a probe-level analysis of the microarray data (16, 17) (see Materials and Methods). The log likelihood for the model parameters θ can then be calculated exactly using standard Gaussian process regression techniques to integrate out the functions m and f (9). This allows us to compute the set of maximum likelihood model parameters θ using gradient-based optimization. For independent replicate datasets, with R experiments in total, the log likelihood is
 |
where μy is the mean and Kr is the covariance matrix for the noise-corrupted dataset yr under the Gaussian process prior (see Materials and Methods), and C is a constant independent of the parameters.
We use the likelihood to rank genes according to their fit to the regulation model. Genes with a near-constant profile may have high likelihoods without being targets, but we find that filtering of weakly expressed genes removes most of these (see Materials and Methods). It is also possible to filter targets using a comparison to a model with zero sensitivity, but we find that the proposed approach achieves similar results with significantly smaller computational cost.
Rather than assuming that the TF protein is primarily under transcriptional control, as indicated by Eq. 1, one can alternatively use the idea pioneered in refs. 14 and 18 and model the TF protein as an unobserved latent variable. This approach can naturally be carried out using a similar Gaussian process framework as shown in ref. 8. However, unlike the approach described above, that procedure requires a set of known targets for training the model. We therefore prefer the above cascade model for cases where the level of active TF is under direct transcriptional control.
Results
We applied our model-based approach to identify targets of the TFs Twist and Mef2 that regulate mesoderm and muscle development in Drosophila (19, 20). We used a microarray dataset containing three independent time series of 12 time points collected hourly throughout Drosophila embryogenesis in wild-type embryos (21). Weakly expressed candidate targets were eliminated by considering average z scores of expression values as described in Materials and Methods.
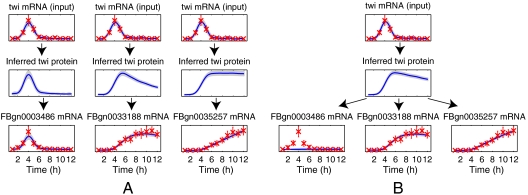
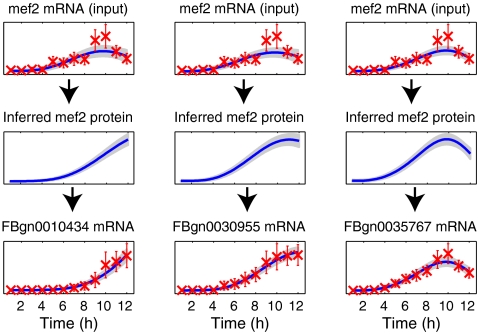
For each TF we fitted two sets of Gaussian process models. In one approach all other genes were considered as individual candidate targets one at a time (“single-target GP”). The candidate targets were ranked according to their likelihood under the model. Note that even the global parameters can vary between models for different genes under this approach as the models are fitted completely independently. In an alternative approach we fitted another set of models using the five top-ranking genes in the single-target case as the training set (“multiple-target GP”; see Materials and Methods). An illustration comparing these alternative modeling approaches applied to the TF Twist is shown in Fig. 1. The single-target model is more flexible because each potential target gene can be associated with a different inferred TF protein profile. The multiple-target model is constrained to explain all targets with the same TF protein profile and may therefore assign a low score to targets that have a high score according to the single-target model (this is the case for gene FBgn0003486 in Fig. 1). Nevertheless, both models are sufficiently flexible to fit target genes with significantly different profiles (genes FBgn0033188 and FBgn0035257 in Fig. 1). In Fig. 2 we show some examples of the single-target model for Mef2. For this TF most of the top-ranking targets identified by the model are similar to the profiles in the first two columns of the figure. The predicted Mef2 targets show much less variability in expression profile than those for Twist.
Fig. 1.
Examples of the model fit for two different classes of Gaussian process model fitted to potential targets of the TF Twist. (A) Three independent single-target models for likely targets. Red marks denote observed expression levels from ref. 21 with 2 SD error bars. The inferred posterior means of the functions are shown in blue and the shaded regions denote 2 SD posterior confidence intervals. (B) A joint multiple-target model for the same set of target genes as in A. Note that the multiple-target models used in evaluation have more targets than the one shown here.
Fig. 2.
Examples of the model fit for three independent single-target Gaussian process models for likely targets of the TF Mef2 (compare to the examples in Fig. 1A for Twist).
To evaluate the advantage from using Gaussian processes in our approach, we performed a comparison to direct maximum likelihood fit of the same differential equation model using the observed TF mRNA levels  in trapezoidal quadrature evaluation of Eqs. 3 and 4 (“single-target quadrature”). For comparison, candidates were also ranked by correlation of the expression profile with the TF expression profile (“correlation”) and by the q value of the differential expression in TF loss-of-function mutant experiments from refs. 6 and 19 (“knockout”). To assess the significance of the observed differences between alternative ranking approaches, we performed 100,000-fold bootstrap resampling of the dataset, recording relative performances of the different methods for each fold. Full bootstrap results are in Table S1.
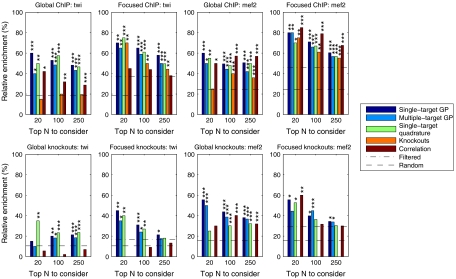
The accuracy of the ranking was first evaluated by looking globally at the fraction of N top-ranking targets that are significantly differentially expressed in knockouts of the TFs and the fraction of targets with ChIP-chip binding within 2,000 base pairs of its beginning or end or within the gene in the data from ref. 20. For Twist the single-target and multiple-target models both perform well, with the single-target model performing slightly better (first column of Fig. 3). The simplified quadrature method is almost as good. In the ChIP validation the model-based methods perform significantly better than ranking using either mutant differential expression or correlation with TF expression. In the knockout validation all model-based approaches significantly outperform the correlation ranking. For Mef2 (third column of Fig. 3) the results of all methods have more roughly comparable performance. In the ChIP validation all methods provide highly significant enrichment in the top 100 and top 250 lists with the correlation performing best. In the knockout validation the model-based and correlation-based rankings both provide highly significant enrichment in the top 100 and top 250 lists, with the single-target model performing best.
Fig. 3.
Evaluation results of different rankings as discussed in the text showing the relative frequency of positive predictions among N top-ranking targets (“global” evaluations) or among N top genes with annotated expression in mesoderm or muscle tissue (“focused” evaluations). The dashed line denotes the frequency in the full population and the dash-dotted line within the population considered in focused evaluation. The first row shows the frequency of targets with ChIP-chip binding within 2,000 base pairs of the gene, whereas the second row shows the frequency of predicted targets with significant differential expression in TF knockouts. p values of results statistically significantly different from random are denoted by ***: p < 0.001, **: p < 0.01, and *: p < 0.05. Comparison to knockout ranking is obviously omitted for knockout validation.
Because Twist and Mef2 activities are specific to the mesoderm and muscle development, we also looked at accuracy focusing on genes with annotated expression in these tissues according to the in situ data from ref. 21. These results are illustrated in the second and fourth columns of Fig. 3. For the Twist ChIP validation we now observe better performance for the knockout scores, although the model-based rankings remain best. However, we observe that the correlation ranking is no longer statistically significantly enriched for ChIP binding on this spatially filtered set of targets. For the Mef2 ChIP validation the relative performance of all methods is similar to the global enrichment analysis, although the knockout top 20 ranking is improved. Overall, the Gaussian process methods tend to perform better than the quadrature-based method. The differences are statistically significant in focused Twist validation for the top 250 list and several Mef2 validation settings for the top 100 and top 250 lists.
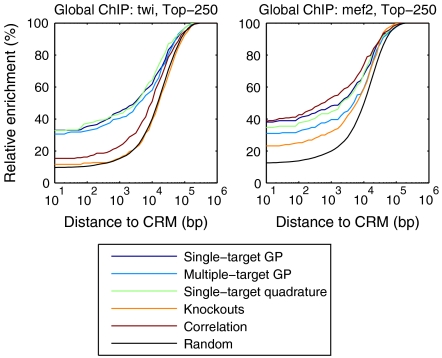
The distance threshold of 2,000 bp used in ChIP-chip evaluation is somewhat arbitrary. The performance of different methods when this threshold is changed is illustrated in Fig. 4 and in Fig. S1. The figures show that the relative performances of different algorithms are fairly consistent for different choices of threshold. We see that the model-based rankings consistently perform best for Twist, while methods perform more similarly for Mef2 with the correlation and single-target models performing comparably well.
Fig. 4.
The fraction of top 250 predicted targets having a ChIP-chip binding site (cis-regulatory module, CRM) within x base pairs as a function of x. Binding sites within an intron of a gene are considered to have a distance 0.
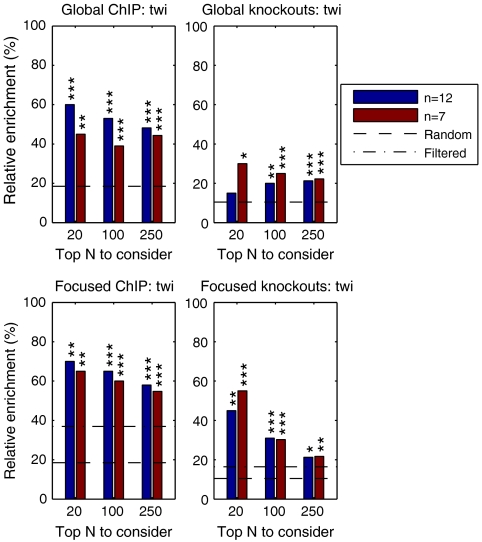
Finally, because most expression time series are short (12), we assessed whether similar results could be obtained with fewer time points. We subsampled the data keeping only seven time points most relevant in defining the Twist expression profile (2, 3, 4, 5, 6, 8, and 10 h). The results in this case, as shown in Fig. 5, are very similar to those obtained using the complete data showing that our approach can be applied to typical short wild-type time series data.
Fig. 5.
Evaluation results similar to those in Fig. 3 for single-target Gaussian process models for full data (12 time points) and subsampled data (7 time points).
Discussion
We have shown how a very simple regulation model can be used to rank genes according to their likelihood under a model of transcriptional regulation by a TF of interest. The linear differential equation model of regulation we use is a simplification, and in many cases unrealistic, but it can capture important differences in the profiles of target genes due to differences in protein and mRNA stability while still keeping the computational load at a level that allows us to perform genome-wide scoring using reasonably modest computational resources without the need for expensive sampling. When data are limited, then the linear model can provide a sufficiently good approximation to a nonlinear model. The linear model does not restrict concentrations from being negative, and occasionally the inferred credible region of functions extends to negative values. However, as the parameters and observations are constrained to be positive, this is rare and does not seem to affect the ranking performance. Our results show that the model-based approach presented here can provide a viable alternative or complementary method to the use of loss-of-function mutant data for identifying targets. Such an approach can be combined with binding location (ChIP-chip or ChIP-sequencing) and spatial expression data to identify a confident set of regulatory targets. This is especially useful in cases where loss-of-function mutants are uninformative, either due to redundancy or because they do not display a phenotype of interest.
The main novelty of our approach is the use of a differential equation transcription model while minimizing the number of free parameters. The most effective method is based on recently proposed techniques to model a time-varying degree of freedom as a sample from a Gaussian process prior distribution (8). By marginalizing out these functional degrees of freedom before computing the likelihood, we keep the number of model parameters to a minimum and this allows us to model typical short wild-type time series without noticeable overfitting. In many applications it is difficult or impossible to achieve a high degree of temporal resolution. For example, in studies of embryogenesis it is often impossible to stage embryos with the precision sufficient to obtain a long expression time series over the period of interest. For one reason or another, most expression time series datasets are short (12) and developing inference approaches that are applicable to short time series datasets is of great practical importance.
Related methods have been proposed for identifying the targets of a TF using time series expression data, but few of these are suitable given the limited data considered here (11). Our approach was inspired by the work of Barenco et al. (14) who also use a differential equation with a linear activation function to model the regulation of transcription. They focus on the case where the TF is activated posttranslation, and they therefore require the use of a training set of known targets to infer the TF activity. In the most recent implementation of their method (22), the original Markov chain Monte Carlo procedure for Bayesian inference has been dropped due to its computational inefficiency and an alternative optimization-based method is used. In our case a Bayesian treatment of the TF protein concentration is computationally efficient because we use Gaussian process inference techniques. Nevertheless, the use of a training set to infer the TF concentration from targets was a very elegant solution to the problem of dealing with TFs activated posttranslation. This approach also fits very naturally into the Gaussian process framework as we have shown (8). Such a scheme was unnecessary in this application, where the TFs of interest were known to be transcriptionally regulated, but can be applied using our techniques in other contexts.
Another relevant method was introduced by Della Gatta et al. (15). They also use a linear regulation model, but they introduce simplifications that avoid the explicit solution of differential equations. An interesting aspect of their approach is the inclusion of a regulatory network model designed to capture the effect of indirect regulation of putative targets by other genes. Sparse regression techniques are used to learn the regulation model. A limitation of their approach is the necessity to have measurements of the TF protein; such data are not readily available in most cases. As with Barenco’s approach, it is difficult for us to compare performance on the data they used in ref. 15 because they do not provide data for genome-wide validation. In our application we do not have access to any protein data and therefore were able to compare to their approach using only mRNA data as a proxy for protein data. The results of this somewhat unfair comparison in Fig. S2 show significant enrichment in only slightly more than a half of the evaluation settings. It is worth noting that any measurements of protein levels to help their model could very easily be incorporated in our models as well.
There are some interesting differences in the ranking results for the two TFs studied here. The knockout scores for Twist are found to be less informative about binding location than the knockout scores for Mef2. This may be because Twist acts earlier and therefore has many more indirect downstream targets in the regulatory network. Indeed, Mef2 is a direct target of Twist and therefore the direct targets of Mef2 are indirect targets of Twist. These indirect targets will be differentially expressed in the mutant and will therefore increase the false positive rate. We found that the model-based scores provide a significant improvement over correlation with TF expression for Twist. This is most likely due to the diversity of target gene expression profiles for this TF (recall Fig. 1). The models can fit profiles that are very poorly correlated with the TF expression profile. For Mef2 the models still provide highly significant enrichment of both ChIP and knockout predictions, but the correlation performs similarly well. Fig. 2 shows that predicted Mef2 targets are much less diverse in profile than those for Twist. Also, Mef2 is active later, at stages downstream of Twist. Therefore, there are less data points available to capture the diversity of profiles that can be explained by the regulation model, whereas the correlation with TF profile will typically be good. Conversely, the correlation score is much less useful for Twist, because it misses many targets that have profiles very different from the Twist mRNA profile.
The two model-based approaches (single target and multiple target) perform similarly well, although the single-target approach gave slightly better results in most comparisons. Fig. 1 suggests that the more constrained multiple-target model conforms more with our assumption of a shared protein profile for all targets. However, performance of this model may be strongly influenced by the choice of training genes. In order not to bias our validation, we chose training genes using the single-target model ranking, without any reference to ChIP-chip, in situ, or knockout data. In practice it may be better to use a more confident set of training genes.
We are pursuing a number of extensions of the current work. Here, we have limited ourselves to detecting the targets of transcriptional activators. The Gaussian process approach can be used to compute the likelihood for repression models (8). However, since models of repression are inherently nonlinear (18), the likelihood calculation is no longer analytically tractable. Therefore approximate Bayesian inference methods are required, and we are currently working on an efficient implementation for genome-wide ranking. We have also limited our attention to single input motif models, but many targets will be regulated by other TFs and cofactors. It seems doubtful that more complex models of regulation will be useful for target ranking using only short wild-type time series data, because it is unlikely these data would be sufficient to parameterize more complex models. However, more general regulation models may be applicable if we were to use more data for inferring the model parameters; e.g., time series knockout data and time series ChIP data could be highly informative. Scoring multiple input models moves us closer to the more general gene regulatory network inference problem. We expect that Gaussian processes will provide a useful way to deal with inference over time-varying external inputs in these and other biological systems, thus paving the way for integration of probabilistic and mechanistic modeling techniques.
Availability.
Complete Matlab code for repeating the experiments is available at http://www.bioinf.manchester.ac.uk/resources/tiger/. An R implementation of the ranking method is available from the authors upon request.
Materials and Methods
Expression Data Preprocessing.
Drosophila developmental microarray time series from ref. 21 were reprocessed using mmgMOS from the puma package (17). The means of the log-scale expression values were equalized across chips. The distributions over log expression were transformed to means  and variances
  of absolute expression by minimizing the squared deviation of 5%, 25%, 50%, 75%, and 95% quantiles of a Gaussian distribution to corresponding quantiles obtained from mmgMOS.
Filtering Weakly Expressed Genes.
Weakly expressed genes can affect the ranking because any model with low or zero sensitivity can fit them well. Genes j with an average z score
 |
were considered weakly expressed and removed from the dataset. The threshold was selected by visually inspecting models for candidate targets: Practically all targets below the threshold elicited a noninformative constant response.
The Gaussian Process Model.
Under suitable initial conditions, the differential equations 1 and 2 can be solved to obtain
 |
[3] |
 |
[4] |
Assuming E[f(t)] = 0, then E[p(t)] = 0 and  . Using these solutions and assuming a squared exponential covariance for f(t), kff(t,t′) = a exp[-(t - t′)2/l2], the covariance of the TF and target mRNAs is
 |
where Δt = t - t′,  . Similarly the covariance of target mRNAs is
 |
where
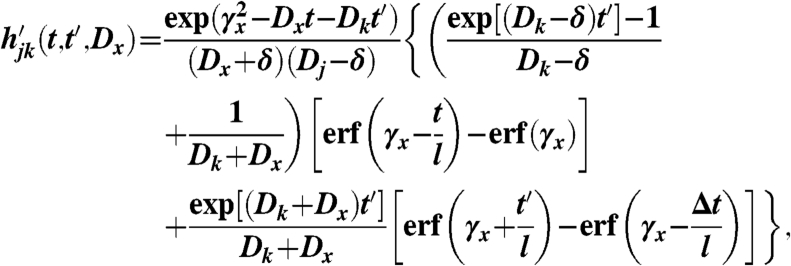 |
where  . The full model for inference of p(t) is derived in SI Text.
Training Set Ranking.
The training set or multiple-target ranking was formed by fitting joint models to five assumed known targets together with each new candidate independently and ranking by model likelihood. In our approach, the training set was formed by taking the five highest-ranking targets from the single-target method, but naturally any existing background knowledge of known targets should be used. To speed up the computation, we first fitted a Gaussian process model to the training set genes alone. All the parameters concerning these genes were then fixed when fitting the larger models to the training set plus each candidate.
In Situ and Knockout Data Processing.
Genes in the data of ref. 21 with any of the annotation terms listed in Table S3 of ref. 20 were considered to be expressed in mesoderm or muscle tissue. The knockout data were processed as explained in ref. 6. q values were computed at each time point using significance analysis of microarrays (23, 24), the values at neighboring time points were averaged, and the minimum of these averages was used as the final value. A cutoff value of 0.1 was used for detecting significant differential expression as in ref. 6.
Supplementary Material
Acknowledgments.
A.H. was supported by Postdoctoral Researcher’s Project No 121179 of the Academy of Finland. M.R. and N.D.L acknowledge support from EPSRC Grant EP/F005687/1 “Gaussian Processes for Systems Identification with Applications in Systems Biology.” This work was supported in part by the IST Programme of the European Community, under the PASCAL2 Network of Excellence, IST-2007-216886. This publication reflects only the authors’ views.
Footnotes
The authors declare no conflict of interest.
This article is a PNAS Direct Submission.
This article contains supporting information online at www.pnas.org/cgi/content/full/0914285107/DCSupplemental.
References
- 1.Ren B, et al. Genome-wide location and function of DNA binding proteins. Science. 2000;290:2306–2309. doi: 10.1126/science.290.5500.2306. [DOI] [PubMed] [Google Scholar]
- 2.Iyer VR, et al. Genomic binding sites of the yeast cell-cycle transcription factors SBF and MBF. Nature. 2001;409:533–538. doi: 10.1038/35054095. [DOI] [PubMed] [Google Scholar]
- 3.Li X, et al. Transcription factors bind thousands of active and inactive regions in the Drosophila blastoderm. PLOS Biol. 2008;6:e27. doi: 10.1371/journal.pbio.0060027. [DOI] [PMC free article] [PubMed] [Google Scholar]
- 4.MacArthur S, et al. Developmental roles of 21 Drosophila transcription factors are determined by quantitative differences in binding to an overlapping set of thousands of genomic regions. Genome Biol. 2009;10:R80. doi: 10.1186/gb-2009-10-7-r80. [DOI] [PMC free article] [PubMed] [Google Scholar]
- 5.Furlong EE, Andersen EC, Null B, White KP, Scott MP. Patterns of gene expression during Drosophila mesoderm development. Science. 2001;293:1629–1633. doi: 10.1126/science.1062660. [DOI] [PubMed] [Google Scholar]
- 6.Sandmann T, et al. A temporal map of transcription factor activity: Mef2 directly regulates target genes at all stages of muscle development. Dev Cell. 2006;10:797–807. doi: 10.1016/j.devcel.2006.04.009. [DOI] [PubMed] [Google Scholar]
- 7.Gitter A, et al. Backup in gene regulatory networks explains differences between binding and knockout results. Mol Syst Biol. 2009;5:276. doi: 10.1038/msb.2009.33. [DOI] [PMC free article] [PubMed] [Google Scholar]
- 8.Gao P, Honkela A, Rattray M, Lawrence ND. Gaussian process modelling of latent chemical species: Applications to inferring transcription factor activities. Bioinformatics. 2008;24:i70–i75. doi: 10.1093/bioinformatics/btn278. [DOI] [PubMed] [Google Scholar]
- 9.Rasmussen CE, Williams CKI. Gaussian Processes for Machine Learning. Cambridge, MA: MIT Press; 2006. [Google Scholar]
- 10.Lawrence ND, Rattray M, Gao P, Titsias M. In: Learning and Inference in Computational Systems Biology. Lawrence ND, Girolami M, Rattray M, Sanguinetti G, editors. Cambridge, MA: MIT Press; 2010. [Google Scholar]
- 11.Bansal M, Belcastro V, Ambesi-Impiombato A, di Bernardo D. How to infer gene networks from expression profiles. Mol Syst Biol. 2007;3:78. doi: 10.1038/msb4100120. [DOI] [PMC free article] [PubMed] [Google Scholar]
- 12.Ernst J, Nau GJ, Bar-Joseph Z. Clustering short time series gene expression data. Bioinformatics. 2005;21(Suppl 1):i159–i168. doi: 10.1093/bioinformatics/bti1022. [DOI] [PubMed] [Google Scholar]
- 13.Stolovitzky G, Monroe D, Califano A. Dialogue on reverse-engineering assessment and methods: The DREAM of high-throughput pathway inference. Ann NY Acad Sci. 2007;1115:1–22. doi: 10.1196/annals.1407.021. [DOI] [PubMed] [Google Scholar]
- 14.Barenco M, et al. Ranked prediction of p53 targets using hidden variable dynamic modeling. Genome Biol. 2006;7:R25. doi: 10.1186/gb-2006-7-3-r25. [DOI] [PMC free article] [PubMed] [Google Scholar]
- 15.Della Gatta G, et al. Direct targets of the TRP63 transcription factor revealed by a combination of gene expression profiling and reverse engineering. Genome Res. 2008;18:939–948. doi: 10.1101/gr.073601.107. [DOI] [PMC free article] [PubMed] [Google Scholar]
- 16.Liu X, Milo M, Lawrence ND, Rattray M. A tractable probabilistic model for Affymetrix probe-level analysis across multiple chips. Bioinformatics. 2005;21:3637–3644. doi: 10.1093/bioinformatics/bti583. [DOI] [PubMed] [Google Scholar]
- 17.Pearson RD, et al. puma: a Bioconductor package for propagating uncertainty in microarray analysis. BMC Bioinformatics. 2009;10:211. doi: 10.1186/1471-2105-10-211. [DOI] [PMC free article] [PubMed] [Google Scholar]
- 18.Khanin R, Vinciotti V, Wit E. Reconstructing repressor protein levels from expression of gene targets in Escherichia coli. Proc Natl Acad Sci USA. 2006;103:18592–18596. doi: 10.1073/pnas.0603390103. [DOI] [PMC free article] [PubMed] [Google Scholar]
- 19.Sandmann T, et al. A core transcriptional network for early mesoderm development in Drosophila melanogaster. Genes Dev. 2007;21:436–449. doi: 10.1101/gad.1509007. [DOI] [PMC free article] [PubMed] [Google Scholar]
- 20.Zinzen RP, Girardot C, Gagneur J, Braun M, Furlong EEM. Combinatorial binding predicts spatio-temporal cis-regulatory activity. Nature. 2009;462:65–70. doi: 10.1038/nature08531. [DOI] [PubMed] [Google Scholar]
- 21.Tomancak P, et al. Systematic determination of patterns of gene expression during Drosophila embryogenesis. Genome Biol. 2002;3 doi: 10.1186/gb-2002-3-12-research0088. RESEARCH0088.1-0088.14. [DOI] [PMC free article] [PubMed] [Google Scholar]
- 22.Barenco M, et al. rHVDM: An R package to predict the activity and targets of a transcription factor. Bioinformatics. 2009;25:419–420. doi: 10.1093/bioinformatics/btn639. [DOI] [PubMed] [Google Scholar]
- 23.Saeed AI, et al. TM4: A free, open-source system for microarray data management and analysis. Biotechniques. 2003;34:374–378. doi: 10.2144/03342mt01. [DOI] [PubMed] [Google Scholar]
- 24.Tusher VG, Tibshirani R, Chu G. Significance analysis of microarrays applied to the ionizing radiation response. Proc Natl Acad Sci USA. 2001;98:5116–5121. doi: 10.1073/pnas.091062498. [DOI] [PMC free article] [PubMed] [Google Scholar]
Associated Data
This section collects any data citations, data availability statements, or supplementary materials included in this article.


