

Abstract
The sensorimotor transformations for visually guided reaching were originally thought to take place in a series of discrete transitions from one systematic frame of reference to the next with neurons coding location relative to the fixation position (gaze-centered) in occipital and posterior parietal areas, relative to the shoulder in dorsal premotor cortex, and in muscle- or joint-based coordinates in motor output neurons. Recent empirical and theoretical work has suggested that spatial encodings that use a range of idiosyncratic representations may increase computational power and flexibility. We now show that neurons in the parietal reach region use nonuniform and idiosyncratic frames of reference. We also show that these nonsystematic reference frames coexist with a systematic compound gain field that modulates activity proportional to the distance between the eyes and the hand. Thus, systematic and idiosyncratic signals may coexist within individual neurons.
Keywords: gain field, posterior parietal cortex, reference frame transformation
We are currently at a theoretical crossroads regarding how the brain computes motor commands from sensory information. The linear systems engineering tradition taught that neural circuits are assembled to compute particular transfer functions and that intermediate stages represent quantities with straightforward physical interpretations (1). At each stage, neurons encode information in a single frame of reference, which facilitates simple pooling. Each cell has a unique receptive field or preferred direction. This results in a distributed population code where each neuron encodes similar information in a similar manner. The vestibular–ocular reflex provides an example of this approach. Head rotation, measured by the vestibular semicircular canals using a canal-centered frame of reference, was believed to be transformed directly into oculomotor commands by virtue of appropriate synaptic weights on vestibular and oculomotor nuclei neurons (1). Visually guided reaching provides another example. Visual spatial information was originally thought to undergo a series of discrete transformations from a sensory (gaze-centered) frame of reference in the occipital and parietal cortices to hand-centered in the premotor cortex (extrinsic motor coordinates) and finally, to muscle commands in the primary motor cortex (intrinsic motor commands) (2–6). The parietal reach region (PRR) in the posterior parietal cortex (PPC) was seen as a discrete processing stage in which reach-related spatial information was encoded using a uniform gaze-centered reference frame and passed on to dorsal premotor cortex (PMd) (7, 8).
An alternative design borrows from connectionist principles and the field of artificial intelligence. In a trained neural network, the organizational principles may be obscure and individual nodes may encode information idiosyncratically (9, 10). Flexibility and computational power are increased when individual nodes code diverse, seemingly random permutations of the input. Subsequent processing can pick and choose from these diverse representations to perform arbitrarily complex operations on the inputs (11–17). Consistent with these ideas, recent work has revealed brain areas in which neurons use multiple complex reference frames. For example, cells in the superior colliculus code auditory stimuli using complex representations that are idiosyncratic to individual cells and neither purely gaze- nor purely head-centered (18, 19). Similar complex and nonuniform coding may occur in the ventral intraparietal area (VIP) (20), the dorsal medial superior temporal area (MSTd) (21), the lateral intraparietal area (LIP) (22, 23), and PMd (24, 25). Modeling work suggests that these complex coding schemes may help convert reference frames, optimally combine sensory information from different modalities, or perform nonlinear computations (15, 17, 26, 27). For example, MSTd cells nonlinearly combine signals encoding the head-centered position of the focus of visual expansion, eye position, and pursuit direction (28). Similarly, neurons in PMd, originally thought to use shoulder-centered coordinates (3), represent targets for arm movements in a variety of reference frames, including hand-centered, gaze-centered, and a frame related to eye, hand, and target positions, perhaps to flexibly compute optimal sensorimotor transformations for visually guided reaching (24, 25, 29).
In the present study, we revisited spatial coding in PRR during visually guided reaching. We found that, when eye and hand gain fields were explicitly differentiated from tuning shifts, PRR contained gaze-centered, hand-centered, and intermediate neurons. Thus, PRR neurons use idiosyncratic, nonsystematic reference frames, which are similar to those in PMd and other cortical areas. Yet, these same neurons also show a uniform and systematic gain field modulation. Eye and hand gain fields are systematically arranged within each individual neuron to form a compound gain field that encodes the distance between the point of the fixation and hand position (30). We suggest that nonsystematic and idiosyncratic organizational principles may increase computational flexibility, whereas systematic organizational principles increase computational efficiency. The brain simultaneously uses both principles within individual neurons of a single cortical area.
Results
We recorded from 259 isolated neurons in PRR (Fig. 1D and Fig. S1A) while monkeys planned and executed reaching movements. Our behavioral task and analyses were designed to identify the frames of reference used by cells in PRR and to distinguish shifts in tuning from gain field effects (30–32). Making this distinction requires that full tuning functions be obtained (Fig. 1A) (32). To accomplish this efficiently, we aligned a wide target array with each cell's preferred direction to capture the peak and both sides of the tuning function. Reaches were performed from different starting eye and hand positions to dissociate target position relative to fixation (gaze) from target position relative to the hand (Fig. 1B). We fitted cell activity to a nonlinear model with separate terms for linear eye and hand gain fields and a Gaussian tuning function for target position that could be gaze-centered, hand-centered, or intermediate (Eq. 1). Animals successfully completed 89% and 96% of initiated trials (monkeys G and S, respectively), with median reach-response latencies of 238 ± 76 ms and 246 ± 55 ms (± SD). Table S1 summarizes median gaze and hand distance from the initial gaze targets, initial hand targets, and final reach targets.
Fig. 1.

Task design. (A) The importance of complete tuning curves when characterizing reference frames. Imagine that a complete curve is obtained in one condition (blue line), but only two data points are obtained in a second condition (orange points). The data could reflect a shift in reference frame (top dotted curve), a gain modulation (bottom dashed), or a combination of the two (middle dashed). The ambiguity would be resolved by collecting complete tuning curves or at least, the peak responses (arrows). (B) Behavioral task. Animals reached to one of eight target locations from one of five configurations of initial eye and hand positions (box). [Only five targets (T1–T5) near the neuron's preferred direction (PD) are shown]. P1–P3 show potential starting eye and hand positions. All conditions and targets were fully interleaved. (C) The temporal sequence of the task, aligned on reach target onset (time 0). Start, onset of initial eye and hand targets; target (T), reach target onset; Go, go signal. (D) Recording sites from animal G shown on a map of inflated cortex (http://brainmap.wustl.edu/caret). Cortical areas are color coded according to Lewis and Van Essen (45). Inset shows the dorsal view. Green, PO/V6A (46); blue, MIP; yellow, dorsal area 5 (5D); red, lateral occipitoparietal area (LOP). Fig. S1A shows animal S.
Multiple Frames of Reference.
Some neurons encoded target location relative to eye position (gaze-centered), others relative to initial hand position (hand-centered), and still others relative to a point lying along a line connecting the eye and hand positions (intermediate).
Consistent with previous reports (7, 24, 33), many PRR cells coded reach targets using a gaze-centered frame of reference (Fig. 2A). When the eyes and hand were aligned at the central position (Aligned), the delay period activity for the example neuron was strongest for the center target [T3; peak delay activity = 35.0 ± 5.8 sp/s (spikes/sec, mean ± SEM)]. When the starting eye position was displaced to the left (Eyes Left) or right (Eyes Right), peak delay activity was evoked by a target on the left (T2) or right (T4), respectively (53.9 ± 3.3 sp/s and 29.3 ± 4.4 sp/s). In contrast, when the starting hand position was displaced left or right, the peak remained at the center [Hand Left and Hand Right (19.1 ± 3.0 and 45.4 ± 5.2 sp/s, respectively)]. Tuning that shifts with eye position but not hand position is consistent with a gaze-centered representation (7, 24, 33).
Fig. 2.

Single cells. (A) Example PRR neuron with a gaze-centered frame of reference. Peri-stimulus time histograms and rasters are color coded for five test conditions and five target locations (box in Fig. 1B). Delay activity is shown with data aligned to the time of go cue (vertical line). (Upper Right) Color-coded mean firing rates (circles), SEM (bars), and fitted tuning curves are shown versus target locations in screen-centered coordinates. (B) An example neuron that encodes targets relative to the hand (hand-centered). (C) An example neuron using an intermediate representation (neither gaze- nor hand-centered). Fig. S2 shows target-aligned data.
We fitted the data to a nonlinear model that distinguishes gain fields from shifting reference frames (Eq. 1 and Fig. 2A Upper Right). A weight parameter identifies the location of the origin of each cell's frame of reference. A weight of 1 corresponds to an origin at fixation and therefore, describes a gaze-centered cell. A weight of 0 corresponds to an origin at the starting hand position and therefore describes a hand-centered cell. Finally, fractional weights correspond to origins lying along a line connecting the point of fixation with the starting hand position (a line intersecting P1 and P3 in Fig. 1B). For example, a weight of 0.5 corresponds to an origin midway between the eye and hand.
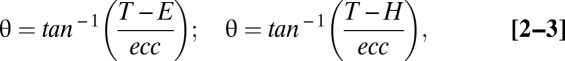
The weight parameter for the cell in Fig. 2A was 1.06 (not significantly different from 1; bootstrap test; P < 0.05). A stepwise regression analysis revealed that a purely gaze-centered model (retaining both eye and hand gain fields) (Eq. 2) fit the data just as well as the full model (Eq. 1) (F test; P = 0.51). The fit to the gaze-centered model included a 0.98 sp/s increase in firing for each degree of leftward eye position displacement (an eye position gain field) and a 1.01 sp/s per degree decrease for leftward hand displacement (a hand position gain field). The gaze-centered modulation had an amplitude of 34.7 sp/s. This reduced model accounts for 93.1% of the variance in firing (r2). Multiplying the gaze-centered modulation by variance explained yields a “spike-variance explained” of 32.3 sp/s (Methods) (30). In comparison, the full model accounted for essentially the same amount of variance (93.3%), whereas a purely hand-centered model (retaining both eye and hand gain fields) (Eq. 3) accounted for only 70.4%.
If PRR neurons are involved in transforming gaze-centered into hand-centered representations, we might expect to find an explicit encoding of the latter in PRR. Consistent with this notion, although contrary to several previous reports (7, 24, 33) (but see ref. 34 and figure 4e in ref. 33), we found hand-centered representations in some cells (Fig. 2B). For the example cell, peak delay activity occurred for targets T1 and T2 for Aligned, Eyes Left, and Eyes Right conditions. In contrast, the tuning functions for Hand Left and Hand Right were shifted left and right, respectively. Tuning that shifts with hand but not eye position is consistent with a hand-centered representation of target position.
The weight parameter for this cell was 0.03 (not significantly different from 0; bootstrap test; P < 0.05). A stepwise regression analysis revealed that a purely hand-centered model (with eye and hand gain fields, Eq. 3) fit the data just as well as the full model (F test; P = 0.89). There was a 0.45 sp/s per degree eye position gain field to the left and a 0.16 sp/s per degree hand position gain field to the right. The hand-centered modulation (15.7 sp/s) plus the eye and hand gain fields explain 82.2% of the variance or 12.9 sp/s of the spike-variance. In comparison, the full model accounted for essentially the same amount of variance (82.3%), whereas a purely gaze-centered model (with gain fields) (Eq. 2) accounted for only 65.3%.
We also encountered cells that represented target locations in neither gaze- nor hand-centered coordinates (Fig. 2C). For the example cell, peak delay activities on both Eyes Left (9.5 ± 2.7) and Hand Left (25.0 ± 4.1) conditions were shifted slightly to the left compared with the Aligned condition, and peak activities on both Eyes Right and Hand Right conditions were shifted slightly to the right. The weight parameter for this cell was 0.63, corresponding to an intermediate representation (significantly different from both 0 and 1; bootstrap test; P < 0.05). A stepwise regression revealed that the full model (Eq. 1) fit the data significantly better than either gaze- (Eq. 2) or hand-centered (Eq. 3) models (P < 0.001 for each F test). The full model revealed a 20.4 sp/s Gaussian modulation based on target position that was modulated by a 1.26 sp/s per degree rightward eye position gain field and a 0.81 sp/s per degree leftward hand position gain field. The mixed eye- and hand-centered modulation (20.4 sp/s) plus the eye and hand gain fields accounted for 85.3% of the total variance or 17.4 sp/s of the spike-variance. The gaze- and hand-centered models accounted for only 70.9% and 62.9%.
Population Analysis of Reference Frames.
Fig. 3A shows the population distribution of the fitted reference frame (weight) parameter from all cells with at least 5 sp/s of spike-variance explained (103 of 259 cells). The modal value is just under 1 with a skew to the left and a median value of 0.72. The distribution of the fitted weights for all 255 cells for which the model converged looks similar to Fig. 3A and yields a similar median of 0.68 (Fig. S5). We classified cells by comparing fits to the full model (Eq. 1) versus a gaze-centered (Eq. 2) or hand-centered (Eq. 3) model (stepwise regression). We found that 41% of 103 cells were gaze-centered (gaze model fit significantly better than the full model; F test; P < 0.05), 18% were hand-centered (hand model fit significantly better than the full model), and 21% were intermediate (neither reduced model fit significantly better than the full model). The remaining 20% of cells fit both reduced models better than the full model and therefore could not be classified (indeterminate).
Fig. 3.

Population. (A) The distribution of weights from the delay period (Eq. 1). Cells with at least 5 sp/s of spike-variance explained are shown (n = 103; Methods). Bars are color coded based on a stepwise regression (see texts): red, gaze-centered; green, hand-centered; blue, intermediate; black, indeterminate. Vertical lines represent values corresponding to pure hand-centered (weight = 0), pure gaze-centered (1), and exactly halfway in between the two (0.5). Arrow, median. (B) Tuning shift analysis based on the cross-correlation method (n = 259). Correlation coefficients between two different hand positions (gaze-centeredness) and two different eye positions (hand-centeredness) are plotted. Cells with a spike-variance explained of at least 5 sp/s are color coded as in A. Cells with spike-variance explained of less than 5 sp/s are gray. (C) The variance explained (r2; percent) by the full model (Eq. 1) as a function of reference frame for all 255 fitted cells (black curve). Each data point represents the median variance explained for cells in a bin centered on the abscissa value of the point. The red curve shows the distribution of cells with an r2 of 85% or higher; the area under the red curve sums to 100%. (D) Out-of-bound cells (weights <−0.15 or >1.15) are noisier than in-bound cells. All fitted cells were split into quintiles based on increasing variance explained. The plot shows the percentages of in-bound (dark bars) and out-of-bound (light bars) cells in each quintile. In-bound cells are overrepresented in the upper quintiles (high variance explained and therefore, less noisy), whereas out-of-bound cells are overrepresented in the lower quintiles. *P < 0.05 by proportion test (Fig. S3 and S4).
Previous studies have reported different results at the population level (7, 24, 33). We, therefore, applied several alternative analyses to check our results. A Bayesian Information Criterion (BIC) analysis yielded similar results as the stepwise regression (42% gaze-centered, 21% hand-centered, and 37% intermediate cells) as did nonparametric permutation tests on the weight parameter (38% gaze, 12% hand, 24% intermediate, and 26% not classifiable). Similar results were obtained when the data from each animal were analyzed separately. Monkey G, with a right hemisphere chamber, showed a median weight of 0.70 with 39% gaze-centered, 18% hand-centered, and 20% intermediate cells (stepwise regression). Monkey S had a left hemisphere chamber and showed a median weight of 0.80 with 43% gaze-centered, 17% hand-centered, and 24% intermediate cells. Finally, we applied three previously published classification schemes (7, 23–25) for distinguishing gaze- and hand-centered frames of reference, and these confirmed our conclusion that PRR shows a broad range of representations, from gaze-centered to hand-centered, with a bias for gaze-centered cells (Fig. 3B, Fig. S6, and SI Results). We did not detect any anatomical segregation of cells as a function of their reference, or any clear evidence of temporal evolution of coding schemes (Fig. S9, SI Text).
Intermediate Representations.
Gaze- and hand-centered representations have clear correlates in the physical world. The early visual system is gaze-centered by construction, and a high-level motor representation for reaching might reasonably be expected to be hand-centered. In contrast, the existence of intermediate representations is nonintuitive. Despite their name, it is not at all obvious that intermediate reference frames constitute computational intermediaries in the conversion from one frame of reference to another. In two dimensions, the transformation between gaze- and hand-centered frames requires only the subtraction of two vectors, a simple linear operation (35). A feed-forward three-layer neural network trained using back-propogation accomplishes this using gaze-centered, gain-modulated nodes, not intermediate coding (11, 12, 14, 16, 17, 30, 36, 37). Although it is true that neural networks can be designed to produce intermediate representations (15, 17, 26), it nonetheless behooves us to ask if intermediate representations might be artifactual.
Might recording spikes from two incompletely isolated neurons, one with gaze-centered encoding and one with hand-centered encoding, produce an intermediate representation? Mathematically, a weighted sum of gaze- and hand-centered representations is quite different from an intermediate representation. However, it is not clear how our classification schemes would respond to a weighted sum. We tested if neurons that were classified as intermediate by the stepwise regression test would be better fit by a weighted sum of a gaze-centered and a hand-centered representation. We found that this was not the case. Of 22 intermediate cells that met the 5 sp/s spike-variance explained criterion, all but two cells (91%) were better fit by the intermediate model compared with a weighted sum model (BIC). Of all intermediate cells (n = 44), only 5% were better fit by the weighted sum. This effectively rules out poor isolation as an explanation for intermediate cells.
A second way that an artifactual intermediate representation might occur is by adding noise to a gaze- or hand-centered neuron. If intermediate neurons were merely noisy (hence, misclassified) gaze- or hand-centered cells, then we would expect that our model would explain less variance in intermediate cells compared with gaze- and hand-centered cells. This was not the case. The black line in Fig. 3C shows the median percentage of variance explained for all cells as a function of their frame of reference. The line is approximately flat between 0 and 1, not U-shaped. In particular, cells in the bin centered on x = 0.5 (weights from 0.35 to 0.65) have a median variance explained similar to that of cells with weights close to 0 or 1. This strongly suggests that intermediate cells do not, in general, result from noisy observations of gaze- or hand-centered cells.
Although the majority of cells have weights close to or between 0 and 1, many weights fall well outside these boundaries. Such cells have also been reported in previous studies (17, 20, 21). There is no a priori reason to believe that out-of-bound representations (weights substantially less than 0 or substantially greater than 1) should differ from in-bound representations (weights within or near the interval from 0 to 1). In fact, an independent simulation study was able to produce both in-bound and out-of-bound representations (17). Interestingly, Fig. 3C shows that our model explains more variance for in-bound cells compared with out-of-bound cells. The three highest values of median variance explained occur for cells with weights between 0.05 and 0.95. This pattern is even clearer in the distribution of cells with high variance explained: 95% of cells with a variance explained of at least 85% have weights between −0.15 and 1.15 (red line in Fig. 3C and Fig. S7).
To compare the goodness of fit for in-bound and out-of-bound cells in detail, we divided all cells into five quintiles of variance explained and then determined the proportion of in-bound and out-of-bound cells in each quintile (Fig. 3D). If out-of-bound cells were no different from in-bound cells, we would expect equal representation in each. Instead, in-bound cells were overrepresented in the upper quintile(s), whereas out-of-bound cells were overrepresented in the lower quintile(s). We found a similar pattern in spike-variance explained (Fig. S3A). This suggests that out-of-bound intermediate cells are different from in-bound intermediate cells.
Might noise artifactually produce out-of-bound cells? We injected Gaussian noise (mean = 0 sp/s; SD = 5 sp/s) into all well-fit in-bound cells (n = 130) (Fig. S4A) to see if it might cause in-bound cells to be reclassified as out-of-bound cells. Surprisingly, 48 (37%) of the in-bound cells became out-of-bound when noise was added (Fig. S4B). With still more noise (SD = 15 sp/s), 76 (58%) of in-bound cells were reclassified as out-of-bound cells (Fig. S4B). The most parsimonious explanations of our data are, therefore, that the out-of-bound cells that we observe arise as an artifact from the corruption of in-bound cells (gaze-centered, hand-centered, and in-bound intermediate cells) by noise. However, we cannot eliminate the alternative possibility that the models that we have used (Eqs. 1–5) are inappropriate for out-of-bound cells (i.e., out-of-bound cells encode spatial information in a fundamentally different way).
Reference Frames and Eye and Hand Gain Fields.
A gain field occurs when tuned responses are scaled as a function of a postural variable (38, 39). Simulations show the potential utility of gain fields in a number of neural computations, including reference frame transformations (11, 12, 14, 16, 17, 36). Recently, we reported that PRR neurons are modulated by a compound gain field: eye and hand position gain fields with similar magnitudes but opposite signs (30). This compound gain field effectively modulates responses in proportion to the distance between the point of visual fixation and the hand (eye-hand distance) (Eq. 5) (30). Across neurons with at least 5 sp/s of spike-variance explained, the median absolute eye gain field was 3.44% of peak activity per degree, and the median absolute hand gain field was 2.08% per degree. Within each cell, eye and hand gain fields were negatively correlated (Spearman's rank correlation; r = −0.61; P < 0.00001; type II regression slope = −0.74) (Fig. 4). Only 4 of 103 cells showed a significant difference (two-tailed t test; P < 0.05) between the fitted eye position gain field parameter and the negative of the fitted hand position gain field parameter.
Fig. 4.

The compound eye–hand distance gain field. Eye and hand position gain field amplitudes (percent per degree) tend to be similar in magnitude but opposite in sign for single neurons (30). Solid black line, type II regression; dashed diagonal line, negative unity line.
We now report that there is no systematic relationship between gain fields and frames of reference in PRR. One could imagine that eye–hand distance gain fields might occur only in gaze-centered neurons and not in neurons in which the eye–hand distance has already been combined with visually derived target information to produce a hand-centered representation of the target. This was not the case. Hand-centered (weight close to 0), gaze-centered (weight close to 1), and in-bound intermediate neurons (intermediate weights that fall inside of 0 and 1) all showed similar gain fields (Fig. S8A). The match between eye and hand gain fields (i.e., offset from the negative unity line in Fig. 4) was consistent across all cell types with a median unsigned mismatch of 1.1% change in activity per degree for gaze-centered neurons, 1.2% per degree for hand-centered neurons, and 1.6 per degree for in-bound intermediate neurons (P > 0.7 for all comparisons; Wilcoxon rank sum test) (Fig. S8B). The gain field mismatch for out-of-bound neurons was 3.1 per degree (i.e., much larger than the mismatch for in-bound cells), which is consistent with the idea that out-of-bound cells represent either corrupted recordings of in-bound cells or a separate population with an encoding scheme not captured by our model (SI Text and Fig. S3B).
Discussion
PRR neurons have been implicated in transforming gaze-centered target locations into hand-centered locations (5, 31, 33, 40–42). Previous studies report a predominantly gaze-centered coding (7, 24, 33), although individual hand-centered cells have been observed (34) (figure 4e in ref. 33). We revisited this issue using a behavioral paradigm and analysis specifically designed to distinguish shifts in tuning from gain field modulations (30, 32). For each cell, we collected full tuning curves, and analyzed the data using a family of nonlinear models with explicit tuning and gain-field terms (Eqs. 1–5). We found that reference frames in PRR are idiosyncratic to each neuron, ranging continuously from gaze-centered to hand-centered, and they include many cells with intermediate representations (Figs. 2C and 3A and Fig. S5). These intermediate representations are reminiscent of the mixed gaze- and head-centered reference frames found in other parts of the PPC (18–20, 23, 32).
A continuous distribution of reference frames has been reported in area PMd, an area to which PRR projects (8, 25, 43). In PRR the distribution is strongly biased to gaze-centered cells (Fig. 3A), whereas in PMd, the distribution is biased to hand-centered cells (25). This difference may reflect a gradual transformation from an initial sensory (gaze-centered) frame in PRR to a more motor frame in PMd. Such a bias is consistent with the notion that visuomotor neurons represent information in multiple, differentially weighted frames of reference (29). Although their function remains unclear, intermediate representations are thought to play a critical role, perhaps mediating nonlinear computations required for 3D coordinate frame transformations or assisting in optimal cue combination (13, 15, 17, 26, 27).
We distinguish in-bound cells, where a change in eye or hand position produces a comparable or smaller shift in tuning, from out-of-bound cells, whose tuning shifts by an amount greater than the change in eye or hand position (rogue cells) (44). Out-of-bound cells have been found in reference frame studies in VIP and in simulation studies (17, 20, 21). In PRR, we find that the goodness of fit for in-bound intermediate cells is comparable with that of pure gaze- and hand-centered cells. In contrast, out-of-bound intermediate neurons are less well fit by our model and either arise artifactually from noisy recordings of in-bound neurons or encode spatial information in an entirely different manner from in-bound neurons.
Our approach is ideal for cells whose responses are peaked in space. For cells that are monotonically tuned or cells for which we sampled only a monotonic portion of the response field because of poor positioning of the target array, our model cannot accurately distinguish gain modulations from tuning shifts. This was only a minor issue for us, because 91% of our cells showed a clear peak. A second caveat is that we assume that gain fields are linear, yet cannot distinguish linear from nonlinear gain fields using our data. Except in extreme cases (e.g., U-shaped gain fields), the linear assumption is a good first approximation (38, 39). A final caveat is that our task was designed to test only gaze- and hand-centered frames of reference. Although we found little evidence for head-, body-, or world-centered frames, still other frames are possible.
The continuous distribution of idiosyncratic reference frames for target position stands in contrast to the systematic and uniform organization of eye and hand gain fields in PRR. Eye and hand gain fields are systematically coupled to one another such that every cell is modulated by eye–hand distance (30). Gain fields are not identical across cells. There is a small and idiosyncratic mismatch of eye and hand gain fields within each cell, and the magnitude and even the sign of the compound gain field varies from cell to cell (e.g., some cells are more active when the hand is to the right of fixation and less active when the hand is to the left of fixation, and vice versa). Despite this variability, however, there is a clear underlying organization; there are very few cells in which eye and hand gain fields either both increase or both decrease for rightward movements, for example. This systematic organization is strong evidence that gain fields are purposeful computational elements and not accidental or incidental modulations (17).
Thus, one dimension of coding in PRR (reference frame) is continuous and idiosyncratic within each cell, whereas another dimension (the compound eye and hand gain field) is organized systematically. We suggest that an apparently haphazard organization, such as is seen with frames of reference in many brain areas, occurs when encoding signals that will be used for multiple different and perhaps nonlinear computations. In contrast, a systematic organization, such as is seen with eye and hand gain fields, occurs when encoding signals that will be used for a small number of fairly linear computations.
Methods
Data Analysis.
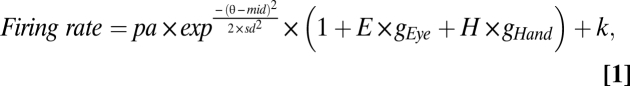
The mean spike rate was computed in a 700-ms delay period (850 ms before the time of the go signal to 150 ms before the time of the go signal). Similar results were obtained using slightly different time intervals and alignment points (e.g., from 150 ms to 850 ms after target onset). We fitted mean spike rates in 25 different conditions (5 initial conditions × 5 targets) to a nonlinear seven-parameter Gaussian model:
 |
 |
We refer to Eq. 1 as the full model. The fit was performed using the nls function in the R statistics package (www.R-project.org). The model inputs were firing rates, target eccentricity (ecc), target displacement (T), and the displacement of eye (E) and hand target (H). The output parameters were baseline (k), peak amplitude modulation (pa), offset of the center of the tuning curve from the central target (T3; mid), standard deviation (sd) of the Gaussian curve in degrees of visual angle, the amplitudes of the eye position gain field (gEye) and the hand position gain field (gHand; both in fractional modulation per degree), and a unitless weight parameter (weight), which described the frame of reference for each cell, with weights of 1 and 0 corresponding to pure gaze- and hand-centered cells, respectively. See SI Text for details on model parameters.
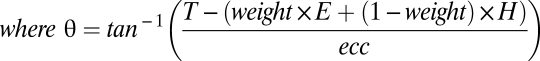
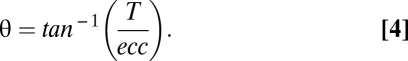
The gaze-, hand-, and head/body/world-centered models are each identical to the full model except for their respective θ terms:
 |
 |
The following equation replaces the two separate eye and hand gain field terms with a single distance gain field term, reducing the number of parameters to six (30):
 |
Selection Criteria.
A total of 259 neurons were recorded from PRR in two monkeys. For each signal that we encountered, we used the mapping task to ascertain isolation, stability, and approximate preferred direction of that cell. For each stable, well-isolated single neuron that showed clear spatial tuning in the mapping task (n = 259), we ascertained the preferred direction from the mapping task and then, ran the main task. These 259 cells reported here represent about 60% of the ∼450 signals that we encountered. About 30% of signals were rejected because of poor isolation or stability, and the remaining 10% were rejected because of absent or unclear spatial tuning. In this report, we analyze the data of every one of the 259 cells in which we decided to run the main task. Because the decision to run or not run this task in a given cell was based solely on the results of the mapping task, the only bias in cell selection was in favor of cells with spatial tuning.
Model fits were judged based on how well the model accounted for firing rate. We took both the strength of the Gaussian tuning and the overall variance explained by the model into account. We combined these two factors into a single measure by multiplying variance explained (r2) by the peak modulation of the Gaussian fit (sp/s) to obtain spike-variance explained (sp/s) (30). We accepted neurons with a criterion value of 5 sp/s of spike-variance explained (n = 103). Acceptance based on different criterion values of spike variance explained, variance explained alone, or χ2 tests of the goodness of fit all resulted in similar conclusions. SI Text contains more detailed methods.
Supplementary Material
Acknowledgments
We thank D. Angelaki, S. Wise, A. Batista, and V. Rao for helpful discussions, G. DeAngelis for help with designing the experiment, T. Malone, J. Vytlacil, and J. Baker for magnetic resonance imaging and localization, and E. Proctor and T. Shew for technical assistance. This work was supported by National Eye Institute Grant R01 EY012135.
Footnotes
The authors declare no conflict of interest.
This article is a PNAS Direct Submission.
This article contains supporting information online at www.pnas.org/cgi/content/full/0913209107/DCSupplemental.
References
- 1.Robinson DA. The use of control systems analysis in the neurophysiology of eye movements. Annu Rev Neurosci. 1981;4:463–503. doi: 10.1146/annurev.ne.04.030181.002335. [DOI] [PubMed] [Google Scholar]
- 2.Kalaska JF, Scott SH, Cisek P, Sergio LE. Cortical control of reaching movements. Curr Opin Neurobiol. 1997;7:849–859. doi: 10.1016/s0959-4388(97)80146-8. [DOI] [PubMed] [Google Scholar]
- 3.Caminiti R, Johnson PB, Galli C, Ferraina S, Burnod Y. Making arm movements within different parts of space: The premotor and motor cortical representation of a coordinate system for reaching to visual targets. J Neurosci. 1991;11:1182–1197. doi: 10.1523/JNEUROSCI.11-05-01182.1991. [DOI] [PMC free article] [PubMed] [Google Scholar]
- 4.Flanders M, Helms T, Stephen I, Soechting, JF Early stages in a sensorimotor transformation. Behav Brain Sci. 1992;15:309–320. [Google Scholar]
- 5.Snyder LH. Coordinate transformations for eye and arm movements in the brain. Curr Opin Neurobiol. 2000;10:747–754. doi: 10.1016/s0959-4388(00)00152-5. [DOI] [PubMed] [Google Scholar]
- 6.Crawford JD, Medendorp WP, Marotta JJ. Spatial transformations for eye-hand coordination. J Neurophysiol. 2004;92:10–19. doi: 10.1152/jn.00117.2004. [DOI] [PubMed] [Google Scholar]
- 7.Batista AP, Buneo CA, Snyder LH, Andersen RA. Reach plans in eye-centered coordinates. Science. 1999;285:257–260. doi: 10.1126/science.285.5425.257. [DOI] [PubMed] [Google Scholar]
- 8.Johnson PB, Ferraina S, Bianchi L, Caminiti R. Cortical networks for visual reaching: Physiological and anatomical organization of frontal and parietal lobe arm regions. Cereb Cortex. 1996;6:102–119. doi: 10.1093/cercor/6.2.102. [DOI] [PubMed] [Google Scholar]
- 9.Poggio T, Edelman S. A network that learns to recognize three-dimensional objects. Nature. 1990;343:263–266. doi: 10.1038/343263a0. [DOI] [PubMed] [Google Scholar]
- 10.Poggio T. A theory of how the brain might work. Cold Spring Harb Symp Quant Biol. 1990;55:899–910. doi: 10.1101/sqb.1990.055.01.084. [DOI] [PubMed] [Google Scholar]
- 11.Zipser D, Andersen RA. A back-propagation programmed network that simulates response properties of a subset of posterior parietal neurons. Nature. 1988;331:679–684. doi: 10.1038/331679a0. [DOI] [PubMed] [Google Scholar]
- 12.Burnod Y, et al. Visuomotor transformations underlying arm movements toward visual targets: A neural network model of cerebral cortical operations. J Neurosci. 1992;12:1435–1453. doi: 10.1523/JNEUROSCI.12-04-01435.1992. [DOI] [PMC free article] [PubMed] [Google Scholar]
- 13.Carrozzo M, Lacquaniti F. A hybrid frame of reference for visuo-manual coordination. Neuroreport. 1994;5:453–456. doi: 10.1097/00001756-199401120-00021. [DOI] [PubMed] [Google Scholar]
- 14.Salinas E, Abbott LF. Transfer of coded information from sensory to motor networks. J Neurosci. 1995;15:6461–6474. doi: 10.1523/JNEUROSCI.15-10-06461.1995. [DOI] [PMC free article] [PubMed] [Google Scholar]
- 15.Pouget A, Snyder LH. Computational approaches to sensorimotor transformations. Nat Neurosci. 2000;3(Suppl):1192–1198. doi: 10.1038/81469. [DOI] [PubMed] [Google Scholar]
- 16.Smith MA, Crawford JD. Distributed population mechanism for the 3-D oculomotor reference frame transformation. J Neurophysiol. 2005;93:1742–1761. doi: 10.1152/jn.00306.2004. [DOI] [PubMed] [Google Scholar]
- 17.Blohm G, Keith GP, Crawford JD. Decoding the cortical transformations for visually guided reaching in 3D space. Cereb Cortex. 2009;19:1372–1393. doi: 10.1093/cercor/bhn177. [DOI] [PubMed] [Google Scholar]
- 18.Jay MF, Sparks DL. Sensorimotor integration in the primate superior colliculus. II. Coordinates of auditory signals. J Neurophysiol. 1987;57:35–55. doi: 10.1152/jn.1987.57.1.35. [DOI] [PubMed] [Google Scholar]
- 19.Metzger RR, Mullette-Gillman OA, Underhill AM, Cohen YE, Groh JM. Auditory saccades from different eye positions in the monkey: Implications for coordinate transformations. J Neurophysiol. 2004;92:2622–2627. doi: 10.1152/jn.00326.2004. [DOI] [PubMed] [Google Scholar]
- 20.Avillac M, Denève S, Olivier E, Pouget A, Duhamel JR. Reference frames for representing visual and tactile locations in parietal cortex. Nat Neurosci. 2005;8:941–949. doi: 10.1038/nn1480. [DOI] [PubMed] [Google Scholar]
- 21.Fetsch CR, Wang S, Gu Y, Deangelis GC, Angelaki DE. Spatial reference frames of visual, vestibular, and multimodal heading signals in the dorsal subdivision of the medial superior temporal area. J Neurosci. 2007;27:700–712. doi: 10.1523/JNEUROSCI.3553-06.2007. [DOI] [PMC free article] [PubMed] [Google Scholar]
- 22.Stricanne B, Andersen RA, Mazzoni P. Eye-centered, head-centered, and intermediate coding of remembered sound locations in area LIP. J Neurophysiol. 1996;76:2071–2076. doi: 10.1152/jn.1996.76.3.2071. [DOI] [PubMed] [Google Scholar]
- 23.Mullette-Gillman OA, Cohen YE, Groh JM. Eye-centered, head-centered, and complex coding of visual and auditory targets in the intraparietal sulcus. J Neurophysiol. 2005;94:2331–2352. doi: 10.1152/jn.00021.2005. [DOI] [PubMed] [Google Scholar]
- 24.Pesaran B, Nelson MJ, Andersen RA. Dorsal premotor neurons encode the relative position of the hand, eye, and goal during reach planning. Neuron. 2006;51:125–134. doi: 10.1016/j.neuron.2006.05.025. [DOI] [PMC free article] [PubMed] [Google Scholar]
- 25.Batista AP, et al. Reference frames for reach planning in macaque dorsal premotor cortex. J Neurophysiol. 2007;98:966–983. doi: 10.1152/jn.00421.2006. [DOI] [PubMed] [Google Scholar]
- 26.Pouget A, Deneve S, Duhamel JR. A computational perspective on the neural basis of multisensory spatial representations. Nat Rev Neurosci. 2002;3:741–747. doi: 10.1038/nrn914. [DOI] [PubMed] [Google Scholar]
- 27.Xing J, Andersen RA. Models of the posterior parietal cortex which perform multimodal integration and represent space in several coordinate frames. J Cogn Neurosci. 2000;12:601–614. doi: 10.1162/089892900562363. [DOI] [PubMed] [Google Scholar]
- 28.Ben Hamed S, Page W, Duffy C, Pouget A. MSTd neuronal basis functions for the population encoding of heading direction. J Neurophysiol. 2003;90:549–558. doi: 10.1152/jn.00639.2002. [DOI] [PubMed] [Google Scholar]
- 29.McGuire LM, Sabes PN. Sensory transformations and the use of multiple reference frames for reach planning. Nat Neurosci. 2009;12:1056–1061. doi: 10.1038/nn.2357. [DOI] [PMC free article] [PubMed] [Google Scholar]
- 30.Chang SW, Papadimitriou C, Snyder LH. Using a compound gain field to compute a reach plan. Neuron. 2009;64:744–755. doi: 10.1016/j.neuron.2009.11.005. [DOI] [PMC free article] [PubMed] [Google Scholar]
- 31.Marzocchi N, Breveglieri R, Galletti C, Fattori P. Reaching activity in parietal area V6A of macaque: Eye influence on arm activity or retinocentric coding of reaching movements? Eur J Neurosci. 2008;27:775–789. doi: 10.1111/j.1460-9568.2008.06021.x. [DOI] [PMC free article] [PubMed] [Google Scholar]
- 32.Mullette-Gillman OA, Cohen YE, Groh JM. Motor-related signals in the intraparietal cortex encode locations in a hybrid, rather than eye-centered reference frame. Cereb Cortex. 2009;19:1761–1775. doi: 10.1093/cercor/bhn207. [DOI] [PMC free article] [PubMed] [Google Scholar]
- 33.Buneo CA, Jarvis MR, Batista AP, Andersen RA. Direct visuomotor transformations for reaching. Nature. 2002;416:632–636. doi: 10.1038/416632a. [DOI] [PubMed] [Google Scholar]
- 34.Batista AP. Pasadena, CA: California Institute of Technology; 1999. Contributions of parietal cortex to reach planning. PhD dissertation. [Google Scholar]
- 35.Bullock D, Grossberg S. Neural dynamics of planned arm movements: Emergent invariants and speed-accuracy properties during trajectory formation. Psychol Rev. 1988;95:49–90. doi: 10.1037/0033-295x.95.1.49. [DOI] [PubMed] [Google Scholar]
- 36.Salinas E, Abbott LF. A model of multiplicative neural responses in parietal cortex. Proc Natl Acad Sci USA. 1996;93:11956–11961. doi: 10.1073/pnas.93.21.11956. [DOI] [PMC free article] [PubMed] [Google Scholar]
- 37.Blohm G, Crawford JD. Computations for geometrically accurate visually guided reaching in 3-D space. J Vis. 2007;7:1–22. doi: 10.1167/7.5.4. [DOI] [PubMed] [Google Scholar]
- 38.Salinas E, Thier P. Gain modulation: A major computational principle of the central nervous system. Neuron. 2000;27:15–21. doi: 10.1016/s0896-6273(00)00004-0. [DOI] [PubMed] [Google Scholar]
- 39.Andersen RA, Mountcastle VB. The influence of the angle of gaze upon the excitability of the light-sensitive neurons of the posterior parietal cortex. J Neurosci. 1983;3:532–548. doi: 10.1523/JNEUROSCI.03-03-00532.1983. [DOI] [PMC free article] [PubMed] [Google Scholar]
- 40.Galletti C, Fattori P, Kutz DF, Battaglini PP. Arm movement-related neurons in the visual area V6A of the macaque superior parietal lobule. Eur J Neurosci. 1997;9:410–413. doi: 10.1111/j.1460-9568.1997.tb01410.x. [DOI] [PubMed] [Google Scholar]
- 41.Shadmehr R, Wise SP. The Computational Neurobiology of Reaching and Pointing: A Foundation for Motor Learning. Cambridge, MA: MIT Press; 2005. pp. xvii–575. [Google Scholar]
- 42.Chang SW, Dickinson AR, Snyder LH. Limb-specific representation for reaching in the posterior parietal cortex. J Neurosci. 2008;28:6128–6140. doi: 10.1523/JNEUROSCI.1442-08.2008. [DOI] [PMC free article] [PubMed] [Google Scholar]
- 43.Tanné J, Boussaoud D, Boyer-Zeller N, Rouiller EM. Direct visual pathways for reaching movements in the macaque monkey. Neuroreport. 1995;7:267–272. [PubMed] [Google Scholar]
- 44.Arnold DB, Robinson DA. A learning network model of the neural integrator of the oculomotor system. Biol Cybern. 1991;64:447–454. doi: 10.1007/BF00202608. [DOI] [PubMed] [Google Scholar]
- 45.Lewis JW, Van Essen DC. Mapping of architectonic subdivisions in the macaque monkey, with emphasis on parieto-occipital cortex. J Comp Neurol. 2000;428:79–111. doi: 10.1002/1096-9861(20001204)428:1<79::aid-cne7>3.0.co;2-q. [DOI] [PubMed] [Google Scholar]
- 46.Galletti C, Fattori P, Kutz DF, Gamberini M. Brain location and visual topography of cortical area V6A in the macaque monkey. Eur J Neurosci. 1999;11:575–582. doi: 10.1046/j.1460-9568.1999.00467.x. [DOI] [PubMed] [Google Scholar]
Associated Data
This section collects any data citations, data availability statements, or supplementary materials included in this article.