Abstract
A two-box model for equator-to-pole planetary heat transport is extended to include simple atmospheric dynamics. The surface drag coefficient CD is treated as a free parameter and solutions are calculated analytically in terms of the dimensionless planetary parameters η (atmospheric thickness), ω (rotation rate) and ξ (advective capability). Solutions corresponding to maximum entropy production (MEP) are compared with solutions previously obtained from dynamically unconstrained two-box models. As long as the advective capability ξ is sufficiently large, dynamically constrained MEP solutions are identical to dynamically unconstrained MEP solutions. Consequently, the addition of a dynamical constraint does not alter the previously obtained MEP results for Earth, Mars and Titan, and an analogous result is presented here for Venus. The rate of entropy production in an MEP state is shown to be independent of rotation rate if the advective capability ξ is sufficiently large (as for the four examples in the solar system), or if the rotation rate ω is sufficiently small. The model indicates, however, that the dynamical constraint does influence the MEP state when ξ is small, which might be the case for some extrasolar planets. Finally, results from the model developed here are compared with previous numerical simulations in which the effect of varying surface drag coefficient on entropy production was calculated.
Keywords: MEP, planet, atmosphere, entropy
1. Introduction
Atmospheric circulation on a planetary scale can be regarded as a heat engine. Motion driven by the equator-to-pole gradient in absorbed radiation at the surface is resisted by frictional forces. Momentum exchange at the surface (via boundary layer turbulence) plays a dominant role in resisting motion (Kleidon et al. 2006). Equilibrium is reached when the driving force equals the frictional force, and when the radiative energy flux and the energy flux by atmospheric circulation are in balance. It follows that the atmospheric heat engine produces entropy by driving a poleward atmospheric heat flux down a meridional gradient in temperature.
In ground-breaking papers, Paltridge (1975, 1978) hypothesized that the climate system organizes itself such that the equator-to-pole heat flux produces entropy at the maximum possible rate. Based on this hypothesis Paltridge was able to reproduce important features of the observed climate, including meridional temperature gradients and the large-scale pattern of cloud cover (Paltridge 1978). The success of this approach led to a great deal of interest in the late 1970s and early 1980s, but was also criticized for lacking a mechanism by which the MEP state was achieved, and for producing meridional heat transports which were independent of well-known constraints on atmospheric dynamics, such as the planetary rotation rate (Rodgers 1976).
There has been a recent resurgence in the application of MEP principles to the climate system (Ozawa et al. 2003; Paltridge et al. 2007), for two main reasons. Firstly, Lorenz et al. (2001) showed that the equator-to-pole temperature differences on Titan and Mars, as well as on Earth, can be reproduced by applying an MEP selection principle to a simple two-box model. The power of this study lay in part in the transparency of its underlying model, whereas the Paltridge models are more difficult to understand and contain additional important assumptions about vertical heat transports that are not directly related to MEP (O'Brien & Stephens 1995). Secondly, Dewar (2003, 2005) provided a statistical explanation for the emergence of MEP in a wide-range of non-equilibrium systems, thereby removing one of the major concerns about the use of MEP principles in climate modelling. However, criticisms about the lack of atmospheric dynamics in the models have remained (Goody 2007).
How could the Lorenz et al. two-box model reproduce equator-to-pole temperature gradients on Earth, Mars and Titan without reference to the atmospheric parameters or rotation rates of these planets? In order to answer this question, we extend the two-box model to include a simple representation of atmospheric dynamics on a rotating planet. We consider the fundamental physical balances that operate in equator-to-pole heat transport and investigate the effect that they have when introduced as an extra constraint into Lorenz et al.'s two-box model. The first aim of the present paper, therefore, is to understand why Lorenz et al. were able to obtain their result while ignoring the dynamics completely.
The second aim of the present paper is to understand the relationship between surface friction and atmospheric entropy production. Recently, Kleidon et al. (2006) used a numerical climate model to investigate the influence of surface–atmosphere coupling on the rate of entropy production in Earth's atmosphere. In a series of simulations, they varied the surface drag coefficients for heat and momentum and noted the subsequent effect on entropy production. (Strictly, the difference between their simulations lay in varying the von Kármán constant away from its true value  . If one's sensibilities are offended by varying a constant, one can imagine that they varied the roughness length
  instead.) The numerical simulations led Kleidon et al. to conclude that observed values of Earth's drag coefficients correspond to an MEP state.
The present paper inhabits a mid-point on the spectrum of model complexity running from Lorenz et al.'s model (with no dynamics) to Kleidon et al.'s model (with full numerical dynamics). In §2, simple atmospheric dynamics are added to the two-box model of Lorenz et al. (2001) to give a dynamically constrained two-box model. In §3, this dynamically constrained model is non-dimensionalized and solved analytically as a function of the governing dimensionless parameters. The nature of this solution is examined in §4 and the model is applied to a range of planets in §5. A summary and physical overview are presented in §6 and conclusions are drawn in §7.
2. A two-box model including dynamics
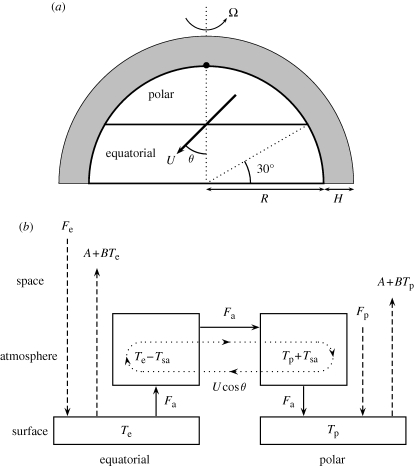
A dynamically constrained two-box model for atmospheric heat transport can be created as follows (North et al. 1981). Assuming for simplicity that the sun is always in the equatorial plane (i.e. that the planet has zero obliquity), it suffices by symmetry to consider a single planetary hemisphere (figure 1a). This is divided into ‘polar’ and ‘equatorial’ regions of equal surface area πR2 by a boundary at 30° latitude (Lorenz et al. 2001). (Here R is the planetary radius. A list of symbols and corresponding numerical values is given in table 2). The contrast in absorbed solar radiation between the polar and equatorial regions induces an atmospheric circulation which, for simplicity, is assumed here to be a single convective Hadley cell (figure 1b) in which warm air ascends near the equator and cold air descends near the pole. The Hadley cell induces a surface wind of speed U that blows from pole to equator and a corresponding high-altitude wind that blows from equator to pole (figure 1b). The surface wind is subject to Coriolis forces and so crosses the boundary at 30° latitude on a bearing θ away from the meridian (see figure 1a for the definition of θ).
Figure 1.
Overview of the dynamically constrained two-box model. (a) Polar and equatorial regions in a planetary hemisphere, each of surface area πR2, and separated by a boundary at 30° latitude. A surface wind of speed U blows from pole to equator on a bearing θ through an effective thickness H of the atmosphere. The circulation is completed by a compensating high-altitude wind from equator to pole. (b) Schematic of the model. Dashed arrows—radiative energy fluxes, solid arrows—atmospheric energy fluxes, dotted arrows—atmospheric circulation in a single Hadley cell.
Table 2.
List of parameters in the model, with approximate numerical values for Earth, Mars, Titan and Venus. Numerical values for albedo  , gravity
  , radius
  , solar constant S0 and rotation rate Ω were obtained from online databases. Other parameters were derived as follows:
  from equation (2.4), ε chosen to make T0 from equation (2.5) agree with online data,
  and
and  from equation (2.6). Estimates of surface pressure
  and surface density
  were also obtained from online databases, allowing the scale height to be estimated from the formula for an isothermal atmosphere
  . Volumetric heat capacity was estimated from the formula for a diatomic ideal gas
  . The dimensionless parameters ξ, η, ω and ζ were calculated using equations (3.1) and (3.2).
| symbol | Earth | Titan | Mars | Venus | Units |
|---|---|---|---|---|---|
| a | 0.3 | 0.21 | 0.15 | 0.65 | — |
| g | 9.81 | 1.35 | 3.69 | 8.87 | m s−2 |
| R | 6.3 × 10⁶ | 2.6 × 10⁶ | 3.4 × 10⁶ | 6.1 × 10⁶ | m |
| S0 | 1340 | 14.73 | 577 | 2561 | W m−2 |
| Ω | 7.27 × 10⁻⁵ | 4.56 × 10⁻⁶ | 7.09 × 10⁻⁵ | 2.99 × 10⁻⁷ | s−1 |
 |
102.2 | 1.268 | 53.5 | 97.7 | W m−2 |
| T0 | 301.6 | 100.7 | 256.4 | 792.9 | K |
| ε | 0.5 | 0.5 | 0.5 | 0.001 | — |
| A | −703.5 | −8.728 | −367.838 | −672.263 | W m−2 |
| B | 3.11 | 0.116 | 1.912 | 1.130 | W m−2 K−1 |
| H | 7981 | 18 641 | 15 913 | 23 233 | m |
| ρc | 1262 | 5705 | 13.3 | 4.37 × 10⁴ | J m−3 K−1 |
| ξ | 232.7 | 90 774 | 12.789 | 108 079 | — |
| η | 2.19 × 10⁻³ | 0.0124 | 8.11 × 10⁻³ | 6.60 × 10⁻³ | — |
| ω | 1.01 | 0.046 | 0.615 | 0.002 | — |
| ζ | 2.44 | 1.05 | 1.79 | 1.002 | — |
Heat transport by the winds is assumed to act over an effective thickness H of the atmosphere. Since the boundary between the regions has length 2πR cos 30° =  , it follows that the meridional heat flux from equator to pole flows through a vertical plane of area
  .
.
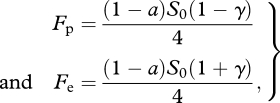
The absorbed solar flux at latitude ϕ is ((1 − a)S0/π) cos ϕ, where a is albedo and S0 is the solar constant in J m−2 s−1. The band of latitudes from ϕ to ϕ + dϕ has area 2πR2 cos ϕ dϕ and so it follows from integration of the absorbed flux that the mean fluxes received by the surface in the polar and equatorial regions are
 |
2.1 |
where  is a geometric constant. The difference in absorbed flux leads to distinct surface temperatures Tp and Te in the polar and equatorial regions (figure 1b). The upward radiative fluxes from the two regions are then
  and
and  where σ is the Stefan–Boltzmann constant and ε is a dimensionless factor depending on the infrared optical depth of the atmosphere and represents greenhouse effects (Lorenz et al. 2001). (In this paper, the value ε = 0.5 is assumed to be reasonable for Earth-like planets, with ε = 0.01 chosen for Venus because of the strong greenhouse effect there.) For simplicity, the radiative fluxes can be linearized (Budyko 1969; Lorenz et al. 2001) as follows:
| 2.2 |
In both the polar and equatorial regions, the surface is coupled by boundary layer turbulence to a corresponding region of the atmosphere. Atmospheric temperatures in the two regions are then assumed to be Tp + Tsa and Te − Tsa (model symmetry ensuring that the surface-to-atmosphere temperature difference has magnitude Tsa in both regions).
Energy conservation at the surface in the two regions (figure 1b) implies that
 |
2.3 |
where Fa is the atmospheric flux in W m−2. (Note that the total flow rate in the atmosphere is πR2Fa although meridional transport acts through an area  . In this paper, all fluxes are expressed per unit surface area.) From equation (2.1), equator-to-pole differences in surface temperature and absorbed solar flux (with subscript ep) can be defined as
 |
2.4 |
For later use, a reference temperature T0 (representing the typical surface temperature in the absence of atmospheric flow) is defined as the solution of
| 2.5 |
It follows that the linearization parameters in equation (2.2) are
| 2.6 |
and that the surface temperatures satisfy
| 2.7 |
Equations (2.3) and (2.4) can be combined to give an expression for energy conservation:
| 2.8 |
The surface-to-atmosphere energy fluxes in each region are of opposite sign, with each being equal in magnitude to the lateral flux between regions (figure 1b). Following Kleidon et al. (2006), it is assumed that the surface-to-atmosphere flux is proportional to windspeed and surface-to-atmosphere temperature difference. The equation for surface-to-atmosphere flux is therefore
| 2.9 |
where CD is a dimensionless drag coefficient quantifying the strength of the coupling between the atmosphere and the surface, ρ is the density of the atmosphere and c is its specific heat capacity. (In the notation of Kleidon et al. (2006), this drag coefficient would be written  , where k is the von Kármán constant, z0 is the roughness length and z represents the height at which the windspeed is U. f is an empirical function dependent on the stability of the atmosphere as quantified by the Richardson number Ri.)
The surface wind (with meridional component U cos θ) blows from pole to equator while the high-altitude wind blows from equator to pole. The net effect of this circulation is that energy is advected from equator to pole across the boundary at 30° latitude. Overall, therefore, a meridional volumetric flow rate  carries energy across an atmospheric temperature difference (Te − Tsa) − (Tp + Tsa) = Tep − 2Tsa (figure 1b). Equating the area-integrated fluxes for surface-to-atmosphere and equator-to-pole exchange it follows that
| 2.10 |
To complete the model, it remains to specify how the windspeed U depends on the equator-to-pole difference in air temperature. Assuming that energy and momentum have the same effective drag coefficient, reasonable dynamics can be constructed by considering the force balance in the meridional and zonal directions. The atmosphere in each region is assumed for simplicity to be isothermal, with a temperature difference Tep − 2Tsa between the two regions. It will be shown later that Tep ≪ T0 and so the atmospheric temperature is everywhere close to the reference temperature T0. It is therefore reasonable to approximate the thermal expansivity of the atmosphere by 1/T0, the value for an ideal gas at temperature T0. It follows that a hydrostatic pressure difference of order (Tep − 2Tsa)gH/T0 exists between the two regions and acts over a cross-sectional area of order  . The resultant meridional force of order
  tends to drive an atmospheric flow. It is resisted by a quadratic drag force of order πR2CDU2 acting parallel to the surface wind and a Coriolis force of order πR2HΩU acting perpendicular to the surface wind. (The Coriolis parameter at 30° latitude is 2Ω sin 30° = Ω.) It follows that the balance between density-driven pressure gradient and quadratic drag—in the presence of a Coriolis force—is expressed by the equations:
 |
2.11 |
and
| 2.12 |
The drag coefficient CD can be regarded as a parameter controlling the degree of geostrophy in the system, with the limit CD → 0 corresponding to pure geostrophic balance.
Equations (2.8)–(2.12) constitute a complete description of the model system. The rate of entropy production for the whole planet (in W K−1) is
 |
2.13 |
The overall aim of this paper is to examine the influence of the drag coefficient CD and the rotation rate Ω on the rate of entropy production  . To achieve a deeper understanding of this model, it will be non-dimensionalized and solved analytically in §3.
3. Analysis and non-dimensionalization
Dimensional analysis shows that the system is governed by the following three dimensionless parameters:
 |
3.1 |
Here and subsequently quantities in square brackets represent natural non-dimensionalizations while the preceding quantities are numerical factors of order unity introduced for convenience.
The advection parameter ξ can be interpreted as a measure of the atmosphere's ability to transport heat from equator to pole by advection. The meridional wind is at most of order  and so the maximum advective flux from equator to pole is of order
  . Normalizing with respect to the equator-to-pole difference in outgoing flux BTep yields the advection parameter ξ up to a multiplicative constant. For example, a planet with strong surface gravity and large atmospheric heat capacity can sustain a large density-driven meridional heat flux and would have a correspondingly large advection parameter ξ.
The rotation parameter ω can be interpreted as a measure of planetary rotation rate. Specifically it is (up to a multiplicative constant) the ratio of the equatorial rotation velocity ΩR to the gravitational velocity scale  . This ratio can also be interpreted as the ratio of a Froude number
  to a Rossby number Ro = U/ΩR.
The thickness parameter η is a measure of atmospheric thickness as a fraction of planetary radius. It is shown below that η does not appear in the dimensionless governing equations under an appropriate rescaling of the drag coefficient CD. It follows that all aspects of the solutions (other than the numerical values of CD) are independent of η. For this reason the ω–ξ plane will be treated as the parameter space for this model, and the qualitative nature of the solution for any planet will be shown to depend solely on its rotation parameter ω and advection parameter ξ.
To derive the dimensionless governing equations, a rescaled drag coefficient cd, rescaled rotation parameter ζ and wind angle tangent τ are defined by
 |
3.2 |
and dimensionless model variables (denoted by lower case letters) are defined by
 |
3.3 |
where j ∈ {e, p, ep, sa, 0}. The letters in this set denote equatorial, polar, equator-to-pole difference, surface-to-atmosphere difference and reference state, respectively.
The dimensional model of equations (2.8)–(2.12) can now be written in dimensionless form as:
| 3.4 |
| 3.5 |
| 3.6 |
| 3.7 |
and
| 3.8 |
Equations (3.4)–(3.8) constitute a full description of the system, representing energy balance, surface-to-atmosphere heat flux, equator-to-pole energy transport, meridional dynamics and zonal dynamics, respectively.
The governing equations have one degree of freedom and so the solution for any planet could in principle be calculated as a function of the advection parameter ξ, rotation parameter ω and rescaled drag cd. In practice, however, it is simpler to derive a parametric solution in which the tangent of the wind angle τ is used as the independent variable and all other variables are calculated as functions of ξ, ω and τ.
The system can be solved analytically by making the substitution  and noting from rearrangement of the governing equations that all model variables can be written as functions of X and τ:
 |
3.9 |
The governing equations then imply that X must satisfy the quadratic equation
 |
3.10 |
whose (positive) root is
 |
3.11 |
Equation (3.11) constitutes the required analytical solution of the system. In conjunction with equation (3.9) it provides explicit parametric formulae for all variables in the model as functions of the wind angle tangent τ = tan θ.
The final step in the formulation of the dimensionless system is to define a dimensionless rate of entropy production  by suitable rescaling of its dimensional equivalent
  . A reasonable definition is the first equality in:
 |
3.12 |
where the second equality follows from equations (2.13), (3.3) and (3.13).
Rewriting equations (2.4) and (2.7) shows that the dimensionless surface temperatures satisfy
 |
3.13 |
It follows that tep < 1 ≪ 2t0 (equivalently Tep ≪ T0) and so the factor  in equation (3.12) may be regarded for practical purposes as being equal to one. Thus the dimensionless rate of entropy production
  is, to a good approximation, simply proportional to its dimensional equivalent
  . Under this approximation the maximization of
  is equivalent to the maximization of
  .
.
4. Solutions of the model
The objective now is to consider how solutions of the dimensionless system (§3) vary as functions of the drag coefficient CD. Particular interest will centre on the values of CD for which either the entropy production  or the atmospheric flux fa is maximized. The variables in the model are divided into two classes —dynamical variables and thermal variables. The dynamical variables windspeed u and wind angle θ (from which meridional wind u cos θ and zonal wind u sin θ can be derived) relate to motion in the atmosphere. The thermal variables, on the other hand, relate to the poleward transfer of energy and are: the atmospheric energy flux fa, the equator-to-pole surface difference in surface temperature tep, the surface-to-atmosphere temperature difference tsa and the overall rate of entropy production
  . Each of these variables can be calculated as a function of the drag coefficient CD.
Three distinct maximization procedures are relevant to this problem. They are denoted by the letters MEP, LEB (Lorenz energy balance) and MAF (maximum atmospheric flux) and are summarized in table 1.
Table 1.
Three distinct maximization principles—maximum entropy production (MEP), Lorenz energy balance (LEB) and maximum atmospheric flux (MAF). The energy constraint is given by equation (3.4) while the dynamical constraints are given by equations (3.5)–(3.8). The MEP solution is equal to an LEB solution if an LEB solution exists and is equal to the MAF solution if no LEB solution exists.
| name | quantity maximized | constraints applied | explicit solution |
|---|---|---|---|
| MEP |  |
energy and dynamics | — |
| LEB |  |
energy only |  |
| MAF | fa | energy and dynamics | — |
(a). MEP—maximum entropy production solutions
In the context of this paper, an MEP solution is defined to be one in which the rate of entropy production  is maximized subject to both the energy constraint of equation (3.4) and the dynamical constraints of equations (3.5)–(3.8). In other words, an MEP solution is obtained by imposing all of the constraints in the model developed in §3.
(b). LEB—Lorenz energy balance solutions
In contrast to an MEP solution, an LEB solution is defined to be one in which the rate of entropy production  is maximized subject to the energy constraint of equation (3.4) only. It follows immediately that an LEB solution is a solution for which
  and hence
  . Maximizing
  subject only to equation (3.4) is equivalent to the procedure adopted in the dynamically unconstrained model of Lorenz et al. (2001). In the framework of the present model, an LEB solution is found by setting
  in equation (3.10) to give
 |
4.1 |
For a given planet (i.e. for given parameters ξ and ω), the wind angle tangent τ in an LEB solution is found numerically by solving equation (4.1) and the remaining model variables are calculated from equations (3.9) and (3.11). In general, equation (4.1) may have zero, one or two solutions τ depending on whether ξ is less than, equal to, or greater than a critical value ξc(ω) (which will be derived below in equation (4.5)). In physical terms, the difference between these regimes relates to whether the atmosphere is dynamically capable of sustaining the entropy production  which is necessary for there to be an LEB solution. It is important to stress that an atmosphere with excess advective capability (ξ ≫ ξc) can achieve the required (maximal) entropy production
  in two separate ways: either with a fast quasi-zonal flow (u ≈ 1, θ ≈ 90°) when the drag coefficient is small or with a slow quasi-meridional flow (u ≪ 1, θ ≈ 0°) when the drag coefficient is large.
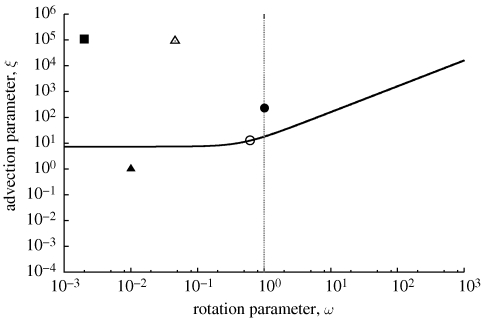
The region of ω–ξ parameter space in which LEB solutions exist is calculated below and is illustrated in figure 2.
Figure 2.
The critical line ξc(ω) (equation (4.5)) and a set of planets (§5) plotted in parameter space. Above the critical line two LEB solutions exist. Below the critical line no LEB solutions exist. MAF solutions exist at all points in parameter space. MEP solutions are identical to the LEB solutions above the critical line and identical to the MAF solution below the critical line. The rotation line (ω = 1) separates planets with ‘high’ rotation rate from planets with ‘low’ rotation rates (solid line, critical line; grey dotted line, rotation line; filled circle, Earth; open circle, Mars; filled square, Venus; open triangle, Titan; filled triangle, P1).
(c). MAF—maximum atmospheric flux solutions
An MAF solution is defined to be one in which the atmospheric flux fa = 1/X2 is maximized subject to both the energy constraint of equation (3.4) and the dynamical constraints of equations (3.5)–(3.8). Equation (3.11) shows that X → ∞ both as τ → 0 and as τ → ∞, while X is finite for positive values of τ. Hence X must have a minimum for some finite value of τ which corresponds to the MAF solution. An explicit formula for the MAF solution can therefore be obtained by implicit differentiation of equation (3.10) with respect to τ and then setting dX/dτ = 0. It follows that
 |
4.2 |
In contrast to LEB solutions, exactly one MAF solution exists for all points in ω–ξ parameter space. For given planetary parameters ξ and ω, the wind angle tangent at an MAF solution is found numerically by equating (3.11)and (4.2) and solving for τ.
(d). Solution regimes and the critical line
In the model of §3 an MEP solution is one that maximizes the dimensionless entropy production  (equations (3.4) and (3.12)). It is clear that this expression is maximized when
  , which corresponds to an LEB solution. In other words, the MEP solution is equal to either one of the LEB solutions when LEB solutions exist. It may be, however, that
  for all possible solutions. In this case, the maximum value of
  is obtained when the atmospheric flux fa is itself maximized. In other words, the MEP solution is equal to the MAF solution if no LEB solutions exist.
The region of ω–ξ parameter space in which LEB solutions exist is bounded by a critical line  on which the MAF and LEB solutions coincide. An LEB solution requires that
  (as in equation (4.1)). Setting
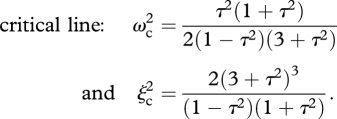
  and then eliminating ξ from equations (4.1) and (4.2) gives the following parametric solution for the critical line
 |
4.3 |
The expression for ωc can be rewritten as a quadratic equation in τ2, which can then be solved to show that, for points on the critical line:
 |
4.4 |
Equations (4.3) and (4.4) can then be combined to give an explicit formula for the critical line in ω–ξ parameter space:
 |
4.5 |
Equation (4.5) can be used to diagnose the qualitative behaviour of an arbitrary planet with rotation parameter ω and advection parameter ξ (figure 2).
When ξ > ξc(ω) the planet has sufficient advective capability to achieve the two LEB solutions. It follows that the planet has two MEP solutions and that these are equal to the two LEB solutions. On the other hand, when ξ < ξc(ω) the planet is prevented from achieving the LEB solutions by the dynamical constraints. It follows that there is only one MEP solution and that it is equal to the MAF solution.
It is helpful to consider approximate forms of equation (4.5) in the limits of fast and slow rotation (figure 2). In the limit of fast rotation ω → ∞, s(ω) → 2 + 8ω2 and so ξc → 16ω. For a rapidly rotating planet, therefore, LEB solutions are unobtainable if ξ < 16ω. In the limit of slow rotation ω → 0, s(ω) → 1 and so  . For a slowly rotating planet, therefore, LEB solutions are forbidden if
  . It makes sense physically that the impact of the dynamical constraint should depend on rotation rate in the limit of fast rotation but become independent of rotation rate in the limit of slow rotation.
5. Application to a range of planets
In this section, solutions to the model of §3 are presented using parameter values for a range of planets (figures 3–7). Since the model is concerned with surface drag it is appropriate to apply it to rocky bodies with an atmosphere but not to gas planets. Accordingly, Earth, Mars, Titan and Venus will be used as case studies within the solar system. Plausible parameter values for these planets are given in table 2. It turns out that all four of these planets inhabit the same quadrant of ω–ξ parameter space and so exhibit qualitatively the same behaviour within the framework of this model. A qualitatively different solution is presented using parameter values for the fictitious planet P1.
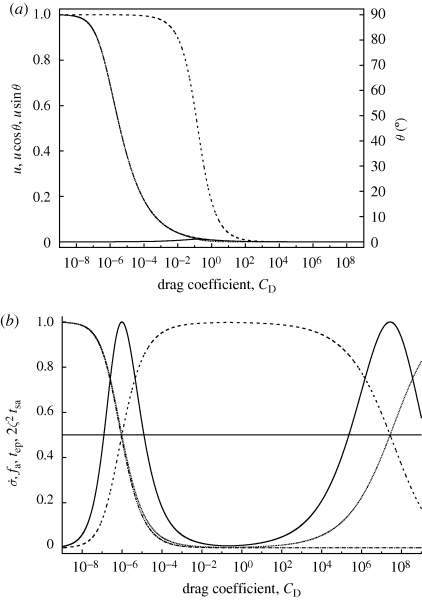
Figure 3.
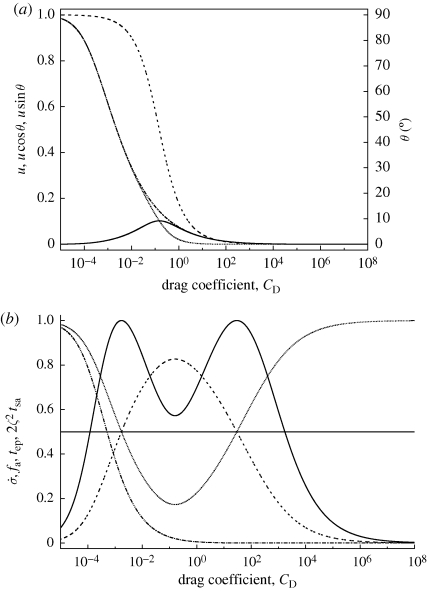
Model solutions as a function of drag coefficient CD for Earth. Dynamical variables are shown in (a) and thermal variables are shown in (b). There are two LEB solutions for which  and hence
  . There is one MAF solution for which fa is maximized. The surface-to-atmosphere temperature difference tsa can be shown analytically to attain a maximum value 1/2ζ2. For clarity, therefore, the rescaled quantity 2ζ2tsa is plotted rather than tsa. Earth (ξ = 2.33 × 10², ω = 1.01 × 100, η = 2.19 × 10⁻³) (a) dash-dotted line, windspeed u; solid line, meridional wind u cos θ; grey line, zonal wind u sin θ; dashed line, angle θ. (b) solid line,
  ; dotted line, fa; dotted grey line, tep; dash-dotted line, 2ζ2tsa.
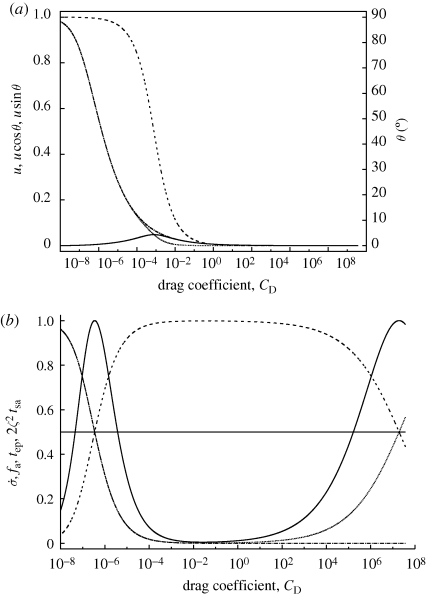
Figure 4.
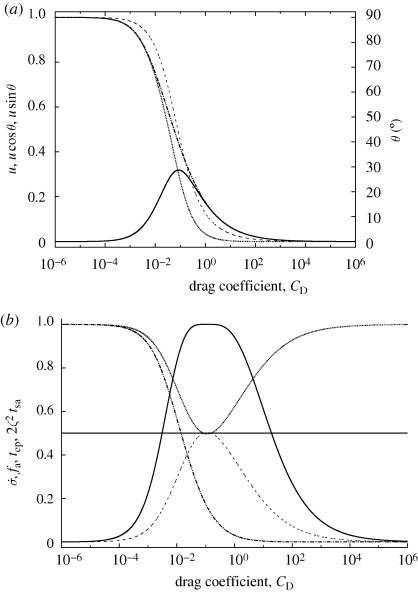
As figure 3, but for Mars. Like Earth, Mars inhabits the top-left quadrant in parameter space (figure 2). Mars ( For key explanation see figure 3.
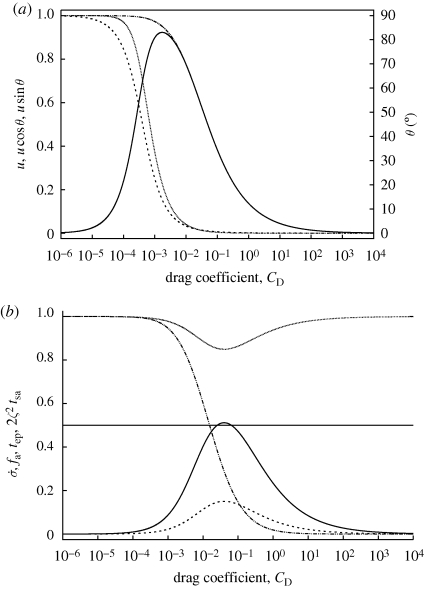
Figure 5.
As figure 3, but for Titan. Like Earth, Titan inhabits the top-left quadrant in parameter space (figure 2). Titan ( ). For key explanation see figure 3.
Figure 6.
As figure 3, but for Venus. Like Earth, Venus inhabits the top-left quadrant in parameter space (figure 2). Venus ( ). For key explanation see figure 3.
Figure 7.
As figure 3, but for the fictional planet P1. P1 inhabits the bottom-left quadrant in parameter space (figure 2). P1 ( ).
).
Model solutions for the Earth are shown in figure 3. The dependence of the dynamical variables on drag coefficient is shown in figure 3a. When the drag coefficient is very small, the wind speed u is high but the wind angle θ is close to 90° and so the wind blows predominantly in the zonal direction. A zonal wind does not carry an equator-to-pole heat flux. As the drag coefficient increases, the wind speed and the wind angle both decrease. The net result is that the meridional wind u cos θ—which carries the poleward heat flux—attains a maximum value for drag coefficient CD ≈ 0.2 before falling away for higher values of the surface drag. The dependence of the dynamical variables on drag coefficient is shown in figure 3b. The effect of the maximized meridional wind when CD ≈ 0.2 is reflected in a nearby maximum in the atmospheric heat flux fa (and hence, from equation (3.4), a minimum in the equator-to-pole difference in surface temperature tep). It follows that CD ≈ 0.2 constitutes the MAF solution for the Earth. Figure 3b shows that this MAF solution corresponds to a local minimum in the rate of entropy production  . There are however two maxima in entropy production which occur for CD ≈ 0.002 and 30. These are by definition the MEP solutions. The Earth lies above the critical line in ω–ξ parameter space (figure 2). It follows that the two MEP solutions coincide with the LEB solutions for which, by definition,
  and
and  .
.
These results can now be compared with the numerical results of Kleidon et al. (2006). They obtained an MEP solution for the (true) value of the von Kármán constant k ≈ 0.4, which should correspond to a drag coefficient CD of order 0.1. The present model, in contrast, produces MEP solutions for drag coefficients CD ≈ 0.002 and 30 which differ by several orders of magnitude from Kleidon et al.'s value. While the MEP results do not coincide, it is intriguing that the present model does yield an MAF solution for a drag coefficient CD ≈ 0.2 that is comparable with Kleidon et al.'s MEP solution. Clearly, the differences must arise because the present model contains substantially less physics than a full atmospheric simulation.
In comparison with the dynamically unconstrained model of Lorenz et al. (2001), the solutions for Earth in figure 3 offer an explanation for why the dynamics did not seem to matter when Lorenz et al. obtained an MEP solution within the framework of their model. The Earth has an atmosphere which is dynamically capable of sustaining a flux  and so the addition of dynamics to Lorenz et al.'s two-box model does not introduce any constraints which prevent this LEB solution being attained.
To continue the comparison with Lorenz et al. (2001), model solutions for Mars and Titan are shown in figures 4 and 5, and the present model is also applied to Venus in figure 6. The analysis of §3 suggests that qualitatively the same behaviour would be expected for these planets as was obtained for the Earth because they inhabit the same quadrant of parameter space (figure 2). This is indeed the case. All three non-terrestrial planets have an MAF solution for CD ∼ 0.1 at which the meridional wind and atmospheric flux are maximized. This is not the MEP solution however, because LEB solutions exist. As for the Earth, the two MEP solutions coincide with the two LEB solutions at which  . Mars lies very close to the critical line in figure 2, and so the MAF and LEB solutions almost coincide in figure 4.
The behaviour of solutions below the critical line can be illustrated by considering a fictitious planet P1 with appropriate parameter values. One might speculate that there is, somewhere, an extrasolar planet having these parameter values. Since P1 (figure 7) lies below the critical line in figure 2 its atmosphere is dynamically incapable of sustaining the LEB atmospheric flux  . The MEP solution is therefore given by an MAF solution in which fa is maximized.
The behaviour of planets with high rotation rate (not illustrated here) is qualitatively similar to those with low rotation rate, except that the MAF and LEB solutions occur at higher values of the drag coefficient CD. This follows (equations (3.2), (3.9) and (4.2)) from the fact that the drag coefficient at an MAF solution is:
 |
5.1 |
and that the wind angle tangent τ at an MAF solution is a function of rotation rate.
6. Summary and physical interpretation
A simple energy balance model has been constructed to explore the underlying physics behind entropy production by equator-to-pole heat flux in planetary atmospheres. Analysis of the present model gives insight into previous results from both a model containing less physics (Lorenz et al. 2001) and a model containing more physics (Kleidon et al. 2006). The dimensionless form of the present model allows it to be applied easily to arbitrary planets.
It should be stressed that the model is very simple and that the approximations involved in its construction become harder to justify for extreme parameter values. For example, the number of convection cells per hemisphere (assumed here to be one) is likely to increase with rotation rate, and drag coefficients many orders of magnitude different from unity (as in figures 3–7) are difficult to contemplate. Nonetheless, the model contains sufficient physics to yield qualitative conceptual insight.
It is clear that the low friction limit CD → 0 de-couples the atmosphere and the surface. In this case surface temperatures in the equatorial and polar regions take their radiative equilibrium values, and atmospheric temperature is uniform across latitudes. This means that there is no drive for meridional atmospheric transport, and the wind is strong but predominantly zonal. The rate of entropy production is therefore zero.
On the other hand, the high friction limit CD → ∞ couples the atmosphere and the surface so tightly that atmospheric temperatures are equal to surface temperatures (Tsa → 0), which again take their radiative equilibrium values. In this case the drive for meridional transport is large, but high surface friction prevents significant flow from taking place. The rate of entropy production is therefore close to zero.
It follows that between these two extremes there must exist at least one intermediate value of CD for which the entropy production is maximized. For planets with a sufficiently large advection parameter ξ, there are two values of the drag coefficient for which the entropy production is maximized (LEB solutions), and one intermediate value of the drag coefficient for which the atmospheric flux is maximized (the MAF solution). On the other hand, for planets with a small advection parameter, the value of the drag coefficient for which the atmospheric flux is maximized is also the single value for which the entropy production is maximized (the MAF solution).
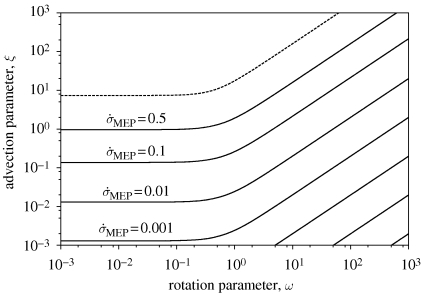
The rate of entropy production  for a planet in an MEP state is shown in ω–ξ parameter space in figure 8. Above the critical line,
  and hence is independent of rotation rate. Below the critical line,
  is independent of rotation rate only for a slowly rotating planet ω ≪ 1, exactly as one would expect on physical grounds.
Figure 8.
Contours (solid line) of the rate of entropy production at MEP:  . Above the critical line (dashed line) (equation 4.5), the MEP state is an LEB state and so
  . Below the critical line, the MEP state is an MAF state and contours of
  are calculated numerically. The rate of entropy production in an MEP state is independent of rotation rate for all slowly rotating planets (
 ), and for all planets with sufficient advective capability (i.e. those above the critical line).
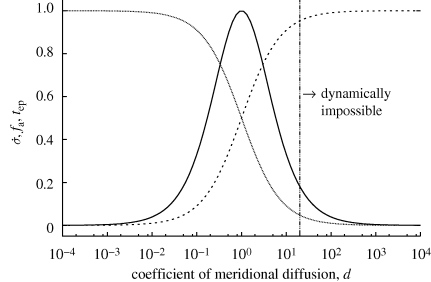
Finally, the influence of the dynamical constraints on entropy production can be interpreted in terms of the ‘coefficient of meridional diffusion' D = Fa/Tep used by Lorenz et al. as the free parameter in their model. In terms of the present model D = (B/4)(1 − tep)/tep, and so it is reasonable to define a dimensionless coefficient of meridional diffusion d = (1 − tep)/tep. It follows from the governing equations of §3 that the dimensionless dynamical variables can be written as functions of d:
 |
6.1 |
These relationships are plotted in figure 9. The effect of the dynamical constraints in the model of §3 is to prevent large values of d from being realized. It follows that a LEB solution  is possible only if d = 1 is permitted by the dynamical constraints.
Figure 9.
Dynamical constraints expressed in terms of a dimensionless ‘coefficient of meridional diffusion’  in the spirit of Lorenz et al. (2001). The effect of the dynamical constraints introduced in the present paper is to introduce a threshold value of d which cannot be exceeded. (The level of the threshold depends on the planetary parameters ω and ξ. In this illustration the threshold is 20.) Planets above the critical line in figure 2 have thresholds greater than 1, allowing the LEB solution
  to be obtained. Planets below the critical line in figure 2 have thresholds less than 1, meaning that the LEB solution
  cannot be obtained (solid line,
  ; dashed line, fa; dotted line, tep; dash-dotted line, dynamical constraint).
7. Conclusions
We have extended the traditional two-box model of latitudinal heat transport to include a simple representation of atmospheric dynamics on a rotating planet. The revised model reproduces the previous unconstrained MEP state when the advective capability of the atmosphere is sufficiently large and the planetary rotation rate is sufficiently small. By chance, this is the regime that describes the rocky planets in the solar system (Earth, Mars, Venus and Saturn's moon—Titan), and we believe that this is why the unconstrained MEP solution can reproduce the observed equator-to-pole temperature gradient, despite the absence of atmospheric dynamics in the model (Lorenz et al. 2001). It is possible that exoplanets will be discovered in which the advective capacity and rotation rate provide meaningful constraints on the MEP state. In these cases we predict a divergence of the observed planetary climates from the unconstrained MEP state, as outlined in the theory developed in this paper.
Acknowledgements
This work was supported by the Natural Environment Research Council Climate and Land-Surface Systems Interaction Centre (CLASSIC) and by a Great Western Research Fellowship for TEJ. The authors are grateful to two anonymous reviewers for their insightful comments and to Axel Kleidon, Michel Crucifix, Suzanne Aigrain and Frédéric Pont for helpful discussions.
Footnotes
One contribution of 17 to a Theme Issue ‘Maximum entropy production in ecological and environmental systems: applications and implications’.
References
- Budyko M. I.1969The effect of solar radiation variations on the climate of the earth. Tellus 21, 611–619 [Google Scholar]
- Dewar R.2003Information theory explanation of the fluctuation theorem, maximum entropy productions, and self-organised criticality in non-equilibrium stationary states. J. Phys. A. 36, 631–641 (doi:10.1088/0305-4470/36/3/303) [Google Scholar]
- Dewar R.2005Maximum entropy production and the fluctuation theorem. J. Phys. A. 38, L371–L381 (doi:10.1088/0305-4470/38/21/L01) [Google Scholar]
- Goody R.2007Maximum entropy production in climate theory. J. Atmos. Sci. 64, 2735–2739 (doi:10.1175/JAS3967.1) [Google Scholar]
- Kleidon A., Fraedrich K., Kirk E., Lunkheit F.2006Maximum entropy production and the strength of boundary layer exchange in an atmospheric general circulation model. Geophys. Res. Lett. 33, L06706 (doi:10.1029/2005GL025373). [Google Scholar]
- Lorenz R. D., Lunine J. I., Withers P. G., McKay C. P.2001Titan, Mars and Earth: entropy production by latitudinal heat transport. Geophys. Res. Lett. 28, 415–418 (doi:10.1029/2000GL01233) [Google Scholar]
- North G. R., Cahalan R. F., Coakley J. A.1981Energy balance climate models. Rev. Geophys. 19, 91–121 (doi:10.1029/RG019i001p00091) [Google Scholar]
- O'Brien D. M., Stephens G. R.1995Entropy and Climate. II: Simple models. Q. J. R. Meteorol. Soc. 121, 773–796 (doi:10.1002/qj.49712152712) [Google Scholar]
- Ozawa H., Ohmura A., Lorenz R. D., Pujol T.2003The second law of thermodynamics and the global climate system—a review. Rev. Geophys. 41, 1018 (doi:10.1029/2002RG000113) [Google Scholar]
- Paltridge G. W.1975Global dynamics and climate change: a system of minimum entropy exchange. Q. J. R. Meteorol. Soc. 101, 475–484 (doi:10.1002/qj.49710142906) [Google Scholar]
- Paltridge G. W.1978Steady-State format of the global climate. Q. J. R. Meteorol. Soc. 104, 927–945 (doi:10.1002/qj.49710444206) [Google Scholar]
- Paltridge G. W., Farquhar G. D., Cuntz M.2007Maximum entropy production, cloud feedback, and climate change. Geophys. Res. Lett. 34, L14708 (doi:10.1029/2007GL029925) [Google Scholar]
- Rodgers C. D.1976Comments on Paltridge's ‘minimum entropy exchange’ principle. Q. J. R. Meteorol. Soc. 102, 455–457 [Google Scholar]


