

Abstract
Red blood cells (RBCs) have highly deformable viscoelastic membranes exhibiting complex rheological response and rich hydrodynamic behavior governed by special elastic and bending properties and by the external/internal fluid and membrane viscosities. We present a multiscale RBC model that is able to predict RBC mechanics, rheology, and dynamics in agreement with experiments. Based on an analytic theory, the modeled membrane properties can be uniquely related to the experimentally established RBC macroscopic properties without any adjustment of parameters. The RBC linear and nonlinear elastic deformations match those obtained in optical-tweezers experiments. The rheological properties of the membrane are compared with those obtained in optical magnetic twisting cytometry, membrane thermal fluctuations, and creep followed by cell recovery. The dynamics of RBCs in shear and Poiseuille flows is tested against experiments and theoretical predictions, and the applicability of the latter is discussed. Our findings clearly indicate that a purely elastic model for the membrane cannot accurately represent the RBC's rheological properties and its dynamics, and therefore accurate modeling of a viscoelastic membrane is necessary.
Introduction
A healthy human red blood cell (RBC) has a biconcave shape with an average diameter of 7.8 μm. Its membrane consists of a lipid bilayer with an attached cytoskeleton formed by a network of the spectrin proteins linked by short filaments of actin. The lipid bilayer is considered to be a nearly viscous and area-preserving membrane (1), whereas RBC elasticity is attributed to the attached spectrin network, as is the integrity of the entire RBC when subjected to severe deformations in the capillaries as small as 3 μm. The RBC membrane encloses a viscous cytosol (hemoglobin solution) whose viscosity is several times larger than that of blood plasma under physiological conditions.
Mechanical and rheological characteristics of RBCs and their dynamics are governed by membrane elastic and viscous properties, bending resistance, and the viscosities of the external/internal fluids. Various RBC properties have been measured in a number of experiments, which include micropipette aspiration (2,3), RBC deformation by optical tweezers (4,5), optical magnetic twisting cytometry (6), and three-dimensional measurements of membrane thermal fluctuations (7,8). The micropipette aspiration and optical tweezers techniques tend to deform the whole RBC membrane, to yield values of the macroscopic shear modulus of healthy cells in the range of 2–12 μN/m. The optical magnetic twisting cytometry and measurements of membrane thermal fluctuations probe locally for membrane characteristics and furnish measurements of local rheological properties (e.g., the complex modulus). These experiments show that the mechanical response of the membrane is clearly viscoelastic.
RBCs in shear flow respond by tumbling at low shear rates and tank-treading at high shear rates, as observed in experiments (9–12). Theoretical models (10,13), which attempt to describe this dynamics, indicate that such behavior depends on membrane elastic properties, shear rate, and viscosities of the membrane and of the internal/external fluids. RBC dynamics in capillary flow (14,15) is characterized by a transition from biconcave to parachute shapes as the flow rate is increased. The transition appears to be governed by the RBC membrane elastic and bending properties, as found in recent simulations (16).
To capture realistic behavior of RBCs, mechanical models must address:
-
1.
Membrane viscoelasticity with a viscous contribution of the lipid bilayer and with an elastic contribution of the spectrin network;
-
2.
Membrane bending resistance;
-
3.
Separate external/internal fluids with distinct viscosities.
Several RBC models have been recently developed at the continuum level (17,18) and at the mesoscopic level (16,19–23). Continuum models (17,18) of deformable particles use immersed boundary or boundary integral methods. They employ the same external/internal fluids and often use simplified treatments of the membrane (e.g., purely elastic membrane) that fail to capture the viscoelastic properties of real RBCs. In addition, continuum models omit some phenomena at the mesoscopic scales such as membrane thermal fluctuations.
Detailed mesoscopic modeling of RBCs at the spectrin level (19,20) is much limited by the demanding computational expense. In these works, the RBC membrane was modeled as a network of elastic springs with fixed connectivity yielding a purely elastic membrane. To improve computational efficiency, several mesoscopic coarse-grained models have been developed (16,21–23) using a similar network membrane representation with many fewer vertices than at the spectrin level. Noguchi and Gompper (16) used multiparticle collision dynamics (24) and employed two coupled networks to represent a membrane: one with a fixed connectivity to mimic the spectrin cytoskeleton, and the other with dynamic flipping between bonds to model the viscous lipid bilayer. Their model takes into account the separation between external and internal fluids and incorporates the main RBC membrane properties; however, it is not clear whether the model can simultaneously reproduce appropriate RBC mechanics, rheology, and dynamics. Dupin et al. (21) coupled a single elastic RBC network to a fluid described by the lattice Boltzmann method (25). Despite very promising results, their model does not account for membrane viscosity and thermal fluctuations, and the same external and internal fluids are employed. Lim et al. (23) employed the area-difference-elasticity model (26), which uses two coupled elastic networks, to capture the full stomatocyte-discocyte-echinocyte sequence of RBC shapes that may develop under special conditions. Under physiological conditions, healthy RBCs retain their biconcave shape, which can be properly reproduced by a single network. In addition, RBCs simulated with the area-difference-elasticity model were only considered in statics, and thus further model development is required to capture RBC rheology and dynamics. Pivkin and Karniadakis (22) used dissipative particle dynamics (27) to simulate a coarse-grained RBC represented by a single elastic spring network—which is the starting point of this work.
The RBC model in this article is constructed by a network of viscoelastic springs combined with bending energy and constraints for surface-area and volume conservation. The model is multiscale, as the RBC can be represented on the spectrin level, where each spring in the network corresponds to a single spectrin tetramer with the equilibrium distance between two neighboring actin connections of ∼75 nm. On the other hand, the RBC network can also be highly coarse-grained with the equilibrium spring lengths of up to ∼500–600 nm. Theoretical analysis of the hexagonal network yields its macroscopic elastic and dynamic properties explicitly in terms of its microscopic parameters, and thus completely eliminates adjustment of the model parameters. The multiscale RBC model is able to reproduce realistic RBC mechanical and rheological properties and their dynamics. The model is general enough to be used with other simulation methods such as lattice Boltzmann, Brownian dynamics, the immersed boundary method, multiparticle collision dynamics, etc.
Model Framework
We employ dissipative particle dynamics (DPD) (27), a mesoscopic simulation technique, to model the motion of the RBC membrane and of the internal and external fluids. A DPD system consists of N point particles, where each particle corresponds to a collection of atoms or molecules rather than an individual atom. DPD particles interact through pairwise soft potentials, whose description can be found in the Supporting Material.
Red blood cell model
The membrane model is built as a set of vertex points {xi}, i ∈ 1…Nv (DPD particles) that form a two-dimensional triangulated network, similar to that of Discher et al. (19) and Li et al. (20). The vertices are connected by Ns edges forming Nt triangles. The potential energy of the system is defined as
| (1) |
The in-plane elastic energy mimics the elastic spectrin network, and is given by
| (2) |
where lj is the length of the spring j, lm is the maximum spring extension, xj = lj/lm, p is the persistence length, kBT is the energy unit, kp is the spring constant, and n is a power. Note that the spring forces in membrane are a combination of conservative elastic forces that can be expressed in terms of the energy potential above, and dissipative forces, which are to be defined below. The first term in Eq. 2 is the attractive wormlike chain (WLC) potential, and the second term defines a repulsive force for n > 0 to be called the power force (POW), so that we abbreviate this spring model as WLC-POW. A nonzero equilibrium spring length is defined by the balance of these two forces.
The bending energy represents the bending resistance of the lipid bilayer, and is defined as
| (3) |
where kb is the bending constant, θj is the instantaneous angle between two adjacent triangles having the common edge j, and θ0 is the spontaneous angle.
The area and volume conservation constraints, which account for area-incompressibility of the lipid bilayer and incompressibility of the inner cytosol, respectively, are expressed as
| (4) |
| (5) |
where ka, kd, and kv are the global area, local area, and volume constraint coefficients, respectively. The terms A and V are the total area and volume of RBC, while A0tot and V0tot are the specified total area and volume, respectively. Note, that the above expressions define global area and volume constraints, and the second term in Eq. 4 incorporates the local dilatation constraint. Detailed description and discussion of the RBC model can be found in Fedosov (28).
Mechanical properties
To obtain a relationship between macroscopic elastic properties (shear, area-compression, and Young's moduli) of the network and model parameters, we extend the linear analysis of Dao et al. (29) for a regular hexagonal network having the above energies (see the Supporting Material for details). The membrane shear modulus is given by
| (6) |
where l0 is the equilibrium spring length and x0 = l0/lm. The corresponding area-compression and Young's moduli are found as
| (7) |
The bending coefficient kb of Eq. 3 can be expressed in terms of the macroscopic bending rigidity kc of the Helfrich model (30) as . Note that this expression may not represent actual bending resistance of the RBC membrane as bending of the membrane also results in local in-plane deformations. Thus, this relation characterizes contribution of the defined bending energy with respect to the macroscopic bending model with zero in-plane shear modulus.
The necessary model parameters can be calculated from the equations above for given macroscopic RBC properties, thereby circumventing manual adjustment. An equilibrium simulation of such a RBC reveals that the cell surface may develop local bumps manifested as stress anomalies in a membrane triangulation because all springs have the same equilibrium length, although a network on a nondevelopable surface cannot be constructed with triangles having the same edge lengths. The degree of local stress artifacts depends on the regularity of triangulation and the ratio of the membrane modulus of elasticity to the bending rigidity expressed by the Föppl-von Kármán number κ = YR02/kc, where
To fully eliminate these anomalies, a stress-free model is obtained by computational annealing. For each spring, the equilibrium spring length l0i is adjusted to be the edge length after triangulation for i = 1,…,Ns. The maximum spring extension is then set individually to lmi = l0i × x0, where x0 = 2.2; see Fedosov (28). In addition, the spring parameters are calculated individually for each spring based on Eq. 6 and a given μ0. After this modification, a new network that is virtually free of irregularities appears.
Membrane viscoelasticity
To incorporate viscous dissipation of the lipid bilayer into the RBC membrane, the spring definition is modified by adding viscous contribution through dissipative and random forces. Such a term fits naturally in the DPD method, where interparticle dissipative interactions are an intrinsic part of the method. We follow the general framework of the fluid particle model (31) to define dissipative and random forces for each spring as
| (8) |
| (9) |
where γT and γC are dissipative parameters, vij is the relative velocity of spring ends, tr[dWij] is the trace of a random matrix of independent Wiener increments dWij, and is the traceless symmetric part. Note that the last equation imposes the condition 3γC > γT and these forces satisfy the fluctuation-dissipation balance providing consistent temperature of the RBC membrane in equilibrium. The membrane shear viscosity ηm is related to the dissipative parameters γT, γC (see (28) for details) as
| (10) |
Our experience indicates that γT accounts for a large portion of viscous contribution, and therefore γC is set to γT/3 in all simulations.
RBC-solvent boundary conditions
The internal and external fluids are modeled by a number of free DPD particles. External/internal fluid separation (nonmixing) is enforced by bounce-back reflections of fluid particles at a moving membrane surface. In addition, the no-slip boundary conditions at the membrane surface are enforced through an appropriate choice of a dissipative force between fluid particles and membrane vertices. We refer the reader to the Supporting Material and to Fedosov (28) for more details on boundary conditions.
Scaling of model and physical units
The dimensionless constants and variables in the DPD model must be scaled with physical units. The superscript M denotes that a quantity is in model units, while P identifies physical units (SI units). We define the length scale as
| (11) |
where rM is the model unit of length, D0 is the cell diameter, and m stands for meters. The energy per unit mass (kBT) and the force unit (N denotes Newton) scales are given by
| (12) |
where Y is the membrane Young's modulus. The timescale is defined as
| (13) |
where η is the characteristic viscosity (e.g., internal/external fluids or membrane) and α is a chosen scaling exponent similar to the power-law exponent in rheology.
Results
In this section, the RBC model is compared against several available experiments that examine RBC mechanics, rheology, and dynamics. First, stretching simulations of modeled RBCs are performed and compared with RBC deformation by optical tweezers (5). Second, the rheological properties of the modeled membrane are validated against optical magnetic twisting cytometry experiments (6) and against experimental measurements of membrane thermal fluctuations (7,32). In addition, RBC rheological characteristics are tested in a creep test and cell extensional recovery in comparison with those in the literature (6,33). Finally, RBC dynamics in shear and Poiseuille flows is simulated and compared to RBC shearing experiments (9–12) and theories (10,13), and to experiments of RBCs in a tube flow (14,15).
Stretching test
The RBC membrane network is characterized by Nv vertices, which define the level of membrane representation or coarse-graining from the spectrin-level (Nv = 27,344) to the highly coarse-grained network of Nv = 500. Fig. 1 a shows a sketch of the RBC membrane under deformation. The total stretching force fM is applied to N– and N+ vertices (drawn as small black spheres, N– = N+ = ɛNv) along the negative and the positive directions, respectively. These vertices cover a near-spherical area on the RBC surface with ɛ = 0.02, which corresponds to the contact diameter of the attached silica bead with diameter 2 μm used in experiments (5). Note that the viscous properties of the membrane and of the suspending medium do not affect final stretching, because RBC response is measured after convergence to the equilibrium stretched state is achieved for given force. Fig. 1 b compares the simulated axial and transverse RBC diameters with their experimental counterparts (5). Excellent correspondence between simulations and experiments is achieved for μ0 = 6.3 μN/m and Y = 18.9 μN/m independently of the level of coarse-graining. These are also in agreement with the RBC mechanical properties that Suresh et al. (5) extracted from the optical tweezers experiments by finite element simulations. The small discrepancy between simulated and experimental transverse diameters is probably a consequence of the optical measurements being performed from only a single observation angle. Numerical simulations showed that RBCs subjected to stretching tend to rotate in the y-z plane, and therefore measurements from a single observation angle may result in underprediction of the maximum transverse diameter. However, the simulation results remain within the experimental error bars.
Figure 1.
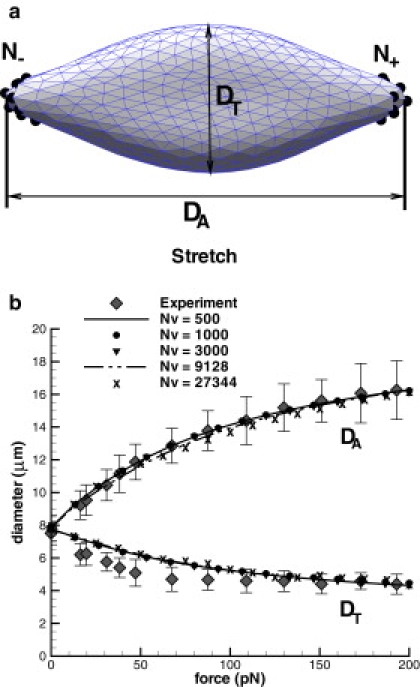
Schematic RBC deformation (a) and stretching response of the stress-free RBC model for different coarse-graining levels (b) compared with the experiments of Suresh et al. (5). Nv = 27,344 corresponds to the spectrin-model.
Membrane rheology from twisting torque cytometry
Twisting torque cytometry (TTC) is the numerical analog of the optical magnetic twisting cytometry (OMTC) used in the experiments (6), in which a ferrimagnetic microbead is attached to RBC top and is subjected to an oscillating magnetic field. In simulations, a microbead is attached to the modeled membrane, and is subjected to an oscillating torque as shown in Fig. 2 a. In analogy with the experiments, the modeled RBC is attached to a solid surface, where the wall-adhesion is modeled by keeping stationary 15% of vertices on the RBC bottom, although other vertices are free to move. The adhered RBC is filled and surrounded by fluids having viscosities much smaller than the membrane viscosity, and therefore, only the membrane viscous contribution is measured. The microbead is simulated by a set of vertices on the corresponding sphere subject to a rigid body motion. The bead attachment is modeled by including several RBC vertices next to the microbead bottom into the rigid motion.
Figure 2.
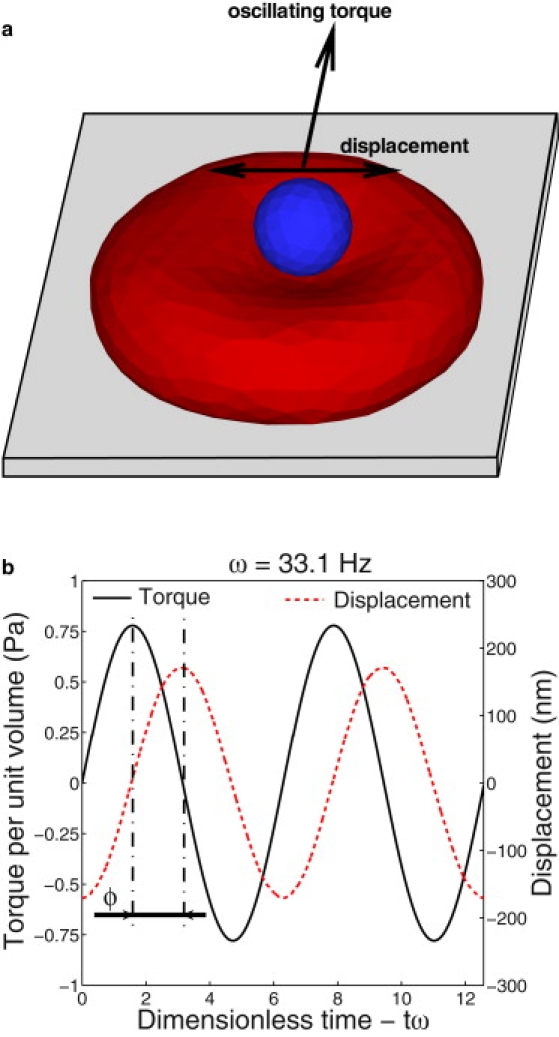
A setup of the TTC (a) and the characteristic response of a microbead subjected to an oscillating torque (b).
A typical bead response to an oscillating torque measured in simulations is given in Fig. 2 b. The bead displacement has the same oscillating frequency as the applied torque per unit volume, but it is shifted by a phase angle ϕ depending on the frequency. The phase angle can be used to derive components of the complex modulus according to linear rheology as
| (14) |
where g′(ω) and g″(ω) are the two-dimensional storage and loss moduli (G′ and G″ in three dimensions), and ΔT and Δd are the torque and bead displacement amplitudes. Note that under the assumption of no inertial effects, the phase angle satisfies the condition 0 ≤ φ < π/2.
Fig. 3 presents components of the complex modulus compared with the experimental data of Puig de Morales-Marinkovic et al. (6). A good agreement of the membrane moduli in simulations with the experimental data is found for the bending rigidity kc = 4.8 × 10⁻¹⁹ J and the membrane viscosity ηm = 0.022 Pa · s. Note that this corresponds to a bending rigidity that is two times larger than the widely accepted value of 2.4 × 10⁻¹⁹ J. In general, simulations for various Young's moduli and bending rigidities showed the dependence of g′(ω) ∼ kc0.65Y00.65. In Fig. 3, only the membrane bending rigidity is varied, as the Young's modulus was obtained in the RBC stretching tests above.
Figure 3.
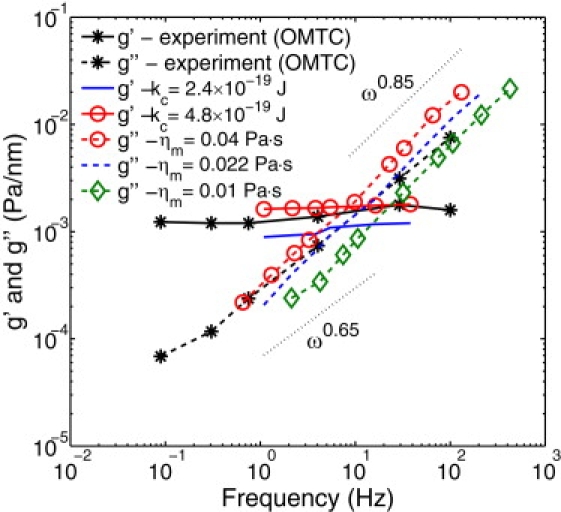
Two-dimensional storage and loss (g′ and g″) moduli of the RBC membrane obtained from simulations for different membrane viscosities and bending rigidities in comparison with the experiments (6).
The loss modulus appears to be independent of the RBC elastic properties and is governed by the membrane viscosity. The modeled g″ exhibits the exponent 0.85 with respect to frequency, while the exponent 0.64 was observed in the experiments. This discrepancy may result from both simulation and experimental errors because the data is fitted over only two orders of magnitude in frequency. According to the obtained exponent, the timescale in Eq. 13 utilizes the values of α = 0.85 and η = ηm. In addition, RBC rheological measurements allow us to define a characteristic time tc of the RBC membrane found as the g′ and g″ intersection, which uniquely relates the membrane elastic properties and viscous dissipation. From the intersection in Fig. 3, we obtain tc = 1/ωc ≈ 0.1 s, in agreement with the RBC characteristic relaxation time found in RBC recovery experiments (33).
Note that simulation results for higher frequencies (especially g′) may be influenced by inertial effects. Absence of inertial effects was verified by decreasing the mass of the attached microbead. Rheological data for high frequencies may be computationally expensive to obtain, because much smaller timesteps are required to ensure numerical stability. An additional difficulty appears when g″ dominates the storage modulus, resulting in a substantial drop in the bead-displacement amplitudes for the fixed torque. This may greatly affect reliability of experimental measurements at high frequencies, while in simulations bead displacements of several nanometers can still be successfully detected.
Membrane thermal fluctuations
RBC membrane thermal fluctuations were measured in experiments using diffraction phase microscopy (7), where instantaneous RBC-height maps were obtained, and using a microrheology technique (32) through dynamical tracking of microbeads attached to the RBC surface. These measurements can be interpreted in terms of the three-dimensional complex modulus G∗ with the components G′ and G″, analogously to the two-dimensional version described in the previous section. To mimic the experiments, the attached RBC is surrounded by a fluid of viscosity ηo = 1 × 10⁻³ Pa · s and is filled with a fluid of viscosity ηi = 5 × 10⁻³ Pa · s. The RBC cytosol is a hemoglobin solution whose viscosity was measured in Cokelet and Meiselman (34) to be in a range of 3–10 × 10−3 Pa · s for the physiologically relevant concentrations of hemoglobin. The membrane viscosity is set to ηm = 0.022 Pa · s.
Membrane thermal fluctuations are measured on the RBC top through the mean-square displacement (MSD) 〈Δr2(t)〉 of several membrane vertices. Theoretical developments in microrheology (35) provide a relation between MSD and G∗ as
| (15) |
where , 〈Δr2(ω)〉 is the unilateral Fourier transform of 〈Δr2(t)〉 – 〈Δr2(t∞)〉, C is a constant, and L is a length scale. Note that the corresponding C and L depend on the physical problem and selected theoretical model. As an example, the MSD of microbeads in a viscoelastic fluid can be well approximated by the generalized Stokes-Einstein relation, where C = 6π and L is the bead radius. This interpretation was chosen by Amin et al. (32) for microbeads attached to the RBC surface. However, the Stokes-Einstein relation cannot be valid in this case, as the membrane elastic properties are not taken into account. Several other models (35) attempt to incorporate effects of the elastic and bending properties, but there is no agreement as to whether a particular model yields quantitatively accurate results for RBC rheology.
Fig. 4 a shows RBC spectral density. Theoretical predictions for viscoelastic vesicles (35) yield the asymptotic scaling of the spectral density obtained from MSD with respect to frequency, when the tracked beads are much smaller than the membrane, as
| (16) |
where Re denotes the real part. Similar exponents were found for actin-coated vesicles in the experiments of Helfer et al. (35). Our simulation results for RBCs show that Re(〈Δr2(ω)〉)) ∼ kc−0.26, close to the theoretical prediction of −1/3. Furthermore, the power of the spectral density at high ω is found to be −1.85 in simulations, in agreement with −5/3 in Eq. 16.
Figure 4.
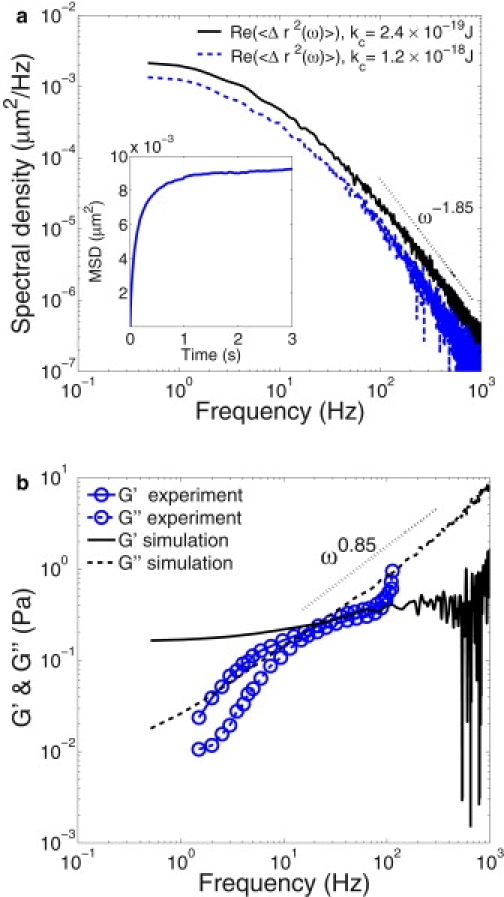
RBC spectral density (a) and the components of complex modulus G∗ (b) obtained from MSD (inset plot). Dotted lines are drawn to the eye to illustrate the power with respect to frequency. Experimental results (32) are obtained by dynamical tracking of microbeads attached to the RBC surface.
Fig. 4 b presents a comparison of experimental and simulation results for the complex modulus. The timescale exponent used here is the same as in the TTC simulations α = 0.85, whereas η = ηo + ηi + ηm in Eq. 13. This is consistent with the exponent of G″ found to be 0.85. For the calculation of G∗ (Eq. 15), we assumed that C = 3π and L = 0.25 μm, in agreement with those used in the experiments (32). Although the behavior of the loss (viscous) modulus G″ with respect to frequency provides a reasonable agreement between the experimental and simulation data, the behavior of the storage modulus G′ is clearly different. In simulations, G′ shows a plateau at low frequencies indicating that, in this regime, the RBC membrane is nearly elastic—which is typical for viscoelastic solid materials and is consistent with the TTC results described in the previous section. However, G′ found in the experiments shows a significant decrease at low frequencies, which is typical for viscoelastic fluids. This disagreement may be due to differences in measurement techniques, because in simulations, three-dimensional RBC-membrane thermal fluctuations are measured directly at the network surface, whereas in experiments, displacement of the attached microbeads is tracked. The scatter at high frequencies in simulations is due to data underresolution at short times.
Creep test and cell recovery
A creep test is the standard rheological technique to measure time-dependent deformation of a material under constant load or stress, whereas a recovery test provides the dynamic relaxation of a material after deformation. The dynamic stretching and recovery of a whole RBC was performed by micropipette aspiration (33) and by optical tweezers (4). The creep test was also done locally on a RBC membrane using OMTC (6), where an attached ferrimagnetic microbead was subjected to a constant magnetic field. The RBC characteristic relaxation time obtained from these experiments shows qualitative agreement at best, although quantitative agreement is poor, such that the values of the obtained relaxation times may differ by a factor of 3–5.
Several issues, such as those presented by geometry, stress-and-strain magnitudes, and simplified models for extracting the parameters of interest, may contribute to quantitative disagreement. The whole cell stretching or recovery measures RBC rheological membrane properties on average, because membrane strains and stresses are not uniform along the cell due to a varying cell circumference along the stretching axes. Recent experiments (36) also showed that the RBC response in a creep test depends strongly on strain rates applied. Moreover, the whole cell stretching experiments subject a RBC to relatively high strains, in which nonlinear effects may be present, and therefore the application of linear rheological models to extract RBC relaxation time may not be correct.
In light of this, local membrane deformation techniques are more favorable to measure bulk rheological properties of a RBC membrane as the applied loads are local and have much smaller magnitudes compared to the whole cell deformations. For example, in OMTC (6) it is likely that the applied strains are nearly uniform and RBC deformations remain within the linear regime. Another complication that often arises in the rheology of viscoelastic materials is that a spectrum of relaxation times exists in which a single relaxation time may be only relevant within a certain range of experimental conditions. The complexity of a RBC response under different experimental conditions requires development of accurate and realistic cell models that would allow for a proper quantitative interpretation of experiments.
The numerical setup for the creep test followed by the cell recovery is analogous to the RBC stretching in Stretching Test with the observation of a time-dependent RBC deformation. Thus, the total stretching force f is applied to N– and N+ vertices (Fig. 1 a) in the negative and positive directions, respectively, while the axial cell diameter is monitored. Internal/external fluid viscosities are set to ηi = 5 × 10⁻³ Pa · s and ηo = 1 × 10⁻³ Pa · s, respectively, whereas the membrane viscosity is varied. The simulations showed that the characteristic timescale depends on the RBC membrane and fluids properties as Y−0.75 and η0.75, where η = ηo + ηi + ηm. Hence, the timescale exponent in Eq. 13 is set to α = 0.75, which is consistent with the TTC and membrane thermal fluctuations simulations described above. The assumption of linear dependence (α = 1) of the timescale with membrane properties made in experiments (33) appears to be a rather crude approximation.
Fig. 5 a shows RBC creep tests for different membrane viscosities. Comparison between the experimental data and simulations suggests that the RBC membrane viscosity lies in the range of 0.02–0.06 Pa · s. Fig. 5 b illustrates differences in the creep response for distinct total applied forces. This demonstrates the complexity of the RBC membrane response, which depends on total strains and strain-rates (36). Results of RBC recovery test after stretching can be found in the Supporting Material.
Figure 5.
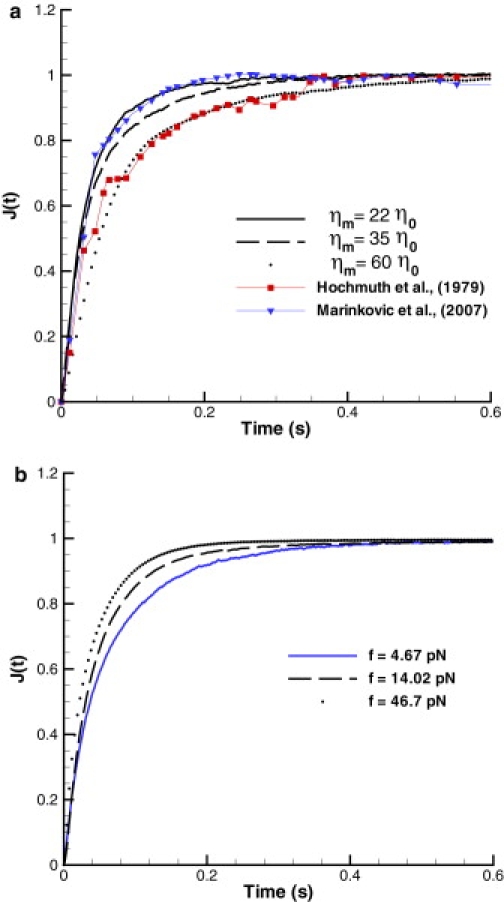
The normalized creep compliance (f = 7 pN) for different membrane viscosities (a) and applied forces (b) with ηm = 0.022 Pa · s. The upper figure also shows the creep test by micropipette aspiration (33) and by OMTC (6).
RBC dynamics in shear flow
Experimental observations (9–12) of RBC dynamics in shear flow show RBC tumbling at low shear rates and tank-treading at high shear rates. This behavior is related to existence of a RBC minimum energy state shown in the experiments by Fischer (9), where a RBC relaxed to its original state marked by several attached microbeads after some time of tank-treading motion. Hence, the RBC has to exceed a certain energy barrier in order to transit into a tank-treading motion in shear flow.
Theoretical predictions (10,13) attempt to capture RBC dynamics in shear flow depending on the shear rate and the viscosity contrast defined as λ = (ηi + ηm)/ηo. According to the theories, for a small λ < 3, a RBC tumbles at low shear rates and tank-treads at high shear rates. Near the tumbling-to-tank-treading transition there exists a narrow intermittent region where theories predict an instability such that RBC tumbling can be followed by tank-treading and vice versa. In the case of a large viscosity contrast (λ > 3), the theories predict a well-defined tumbling regime followed by an intermittent region, although stable tank-treading may not be present. The tank-treading state is also characterized by RBC swinging around the tank-treading axes with certain frequency and amplitude.
A simulated RBC is suspended into a solvent placed between two parallel walls moving with constant velocities in opposite directions. Fig. 6 a shows tumbling and tank-treading frequencies with respect to shear rates in comparison with experiments (11,12). Comparison of the simulated dynamics with experiments showed that a purely elastic RBC with or without inner solvent (circles and squares) results in an overprediction of the tank-treading frequencies, because the membrane assumes no viscous dissipation. Addition of the membrane viscosity (triangles) reduces the values of the tank-treading frequencies and provides a good agreement with experiments for the membrane viscosity ηm = 22 × 10−3 Pa · s. Note that for all cases, a finite intermittent region is observed and it becomes wider for a nonzero membrane viscosity. This result is consistent with the experiments, but it disagrees with the theoretical predictions. Similar results for the intermittent region were reported in simulations of viscoelastic vesicles (37). Moreover, an increase in the internal fluid or membrane viscosities results in a shift of the tumbling-to-tank-treading transition to higher shear rates. Fig. 6 b shows the average RBC tank-treading angle and the swinging amplitude. The values are consistent with experimental data (10) and appear to be not very sensitive to the membrane viscosity. Note that the swinging frequency is equal to twice the tank-treading frequency.
Figure 6.
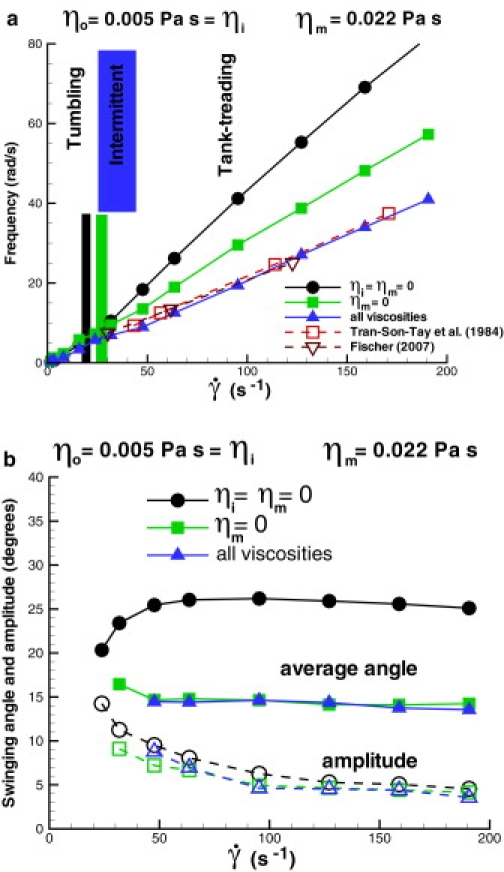
Tumbling and tank-treading frequency (a) of a RBC in shear flow and swinging average angle and amplitude (b) for different cases: 1), ηo = 5 × 10⁻³ Pa · s, ηi = ηm = 0 (circles); 2), ηo = ηi = 5 × 10⁻³ Pa · s, ηm = 0 (squares); and 3), ηo = ηi = 5 × 10⁻³ Pa · s, ηm = 22 × 10−3 Pa · s (triangles).
In conclusion, the RBC model accurately captures membrane dynamics in shear flow, while the theoretical models can predict RBC dynamics at most qualitatively. The theoretical models assume ellipsoidal RBC shape and a fixed (ellipsoidal) RBC tank-treading path. Our simulations showed that a RBC is subject to deformations along the tank-treading axis. In addition, modeled RBCs show substantial shape deformations (buckling) in a wide range around the tumbling-to-tank-treading transition. A degree of these deformations depends on the Föppl-von Kármán number κ defined in Mechanical Properties. As an example: if the RBC bending rigidity is increased by a factor of five, the aforementioned shape deformations become considerably smaller, while if the RBC bending rigidity is increased by a factor of 10, the shape deformations practically subside. The theoretical models do not take the bending rigidity into consideration, while experimental data are not conclusive on this issue. This again raises the question about the magnitude of bending rigidity of healthy RBCs, as our simulations (TTC and RBC dynamics in shear flow) indicate that the RBC bending rigidity may be several times higher than the widely used value of kc = 2.4 × 10⁻¹⁹ J.
RBC dynamics in Poiseuille flow
RBC dynamics in Poiseuille flow in tubes with a diameter comparable with the RBC diameter was the subject of investigation in several experiments (14,15). The main feature of this flow is the RBC transition from a biconcave shape to parachutelike shape as the flow rate is increased. Transition to the parachute shape of a RBC in Poiseuille flow is simulated in a tube of the diameter 9 μm. Poiseuille flow can be characterized by the mean flow velocity defined as
where A is the area of the tube cross section, and v(r) is the axial flow velocity.
To identify the biconcave-to-parachute transition we use the gyration tensor defined as
| (17) |
where ri values are the RBC vertex coordinates, rC is the RBC center-of-mass, and m, n can be x, y, or z. The gyration tensor characterizes RBC shapes. As an example, the gyration tensor of a biconcave RBC in equilibrium has two large eigen-values corresponding to the cell diameter and one small eigen-value characterizing the RBC height. Thus, the RBC transition to the parachute shape can be identified by the smallest eigen-value as it increases from its equilibrium value to that of an elongated RBC in Poiseuille flow.
Fig. 7 shows a snapshot of the RBC parachute shape (Fig. 7 a) and the biconcave-to-parachute transition for different bending rigidities (Fig. 7 b) with respect to the mean flow velocity. The plot shows that healthy RBCs transit to a parachute shape at the mean flow velocity as low as 65 μm/s. Cells with a larger bending rigidity show the biconcave-to-parachute transition at larger flow rates with a nearly linear dependence of the transition on the bending rigidity kc. These results are consistent with the numerical simulations of Noguchi and Gompper (16). In addition, note that the biconcave-to-parachute transition results in a reduction of flow resistance by 10–15%.
Figure 7.
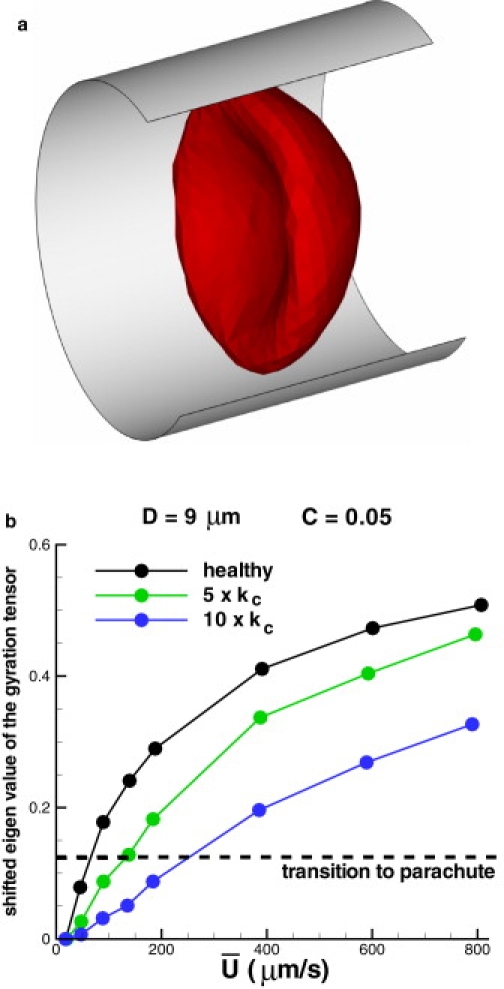
RBC parachute shape (a) and the normalized eigen-values of the gyration tensor (b) characterizing biconcave-to-parachute transition for different bending rigidities. kc = 2.4 × 10⁻¹⁹ J.
Summary and Discussion
We presented a RBC model that accurately captures RBC mechanics, rheology, and dynamics. The membrane skeleton is constructed as a network of interconnected viscoelastic springs that provide RBC elasticity analogously to the spectrin network, and viscous dissipation similarly to that in the lipid bilayer. This network also incorporates the membrane bending rigidity to mimic bending resistance of the lipid bilayer. In addition, local and global area constraints ensure the membrane incompressibility of real RBCs, while the volume constraint ensures the incompressibility of the inner solvent.
Independently of a RBC coarse-graining level (Nv), the model mechanical properties were found to be in excellent agreement with those obtained in optical tweezers experiments. This was achieved without ad hoc tuning or adjustment of the model parameters, because they can be analytically derived from the imposed macroscopic membrane properties. In addition, the proposed stress-free model allowed us to eliminate existing artifacts of the network triangulation and to set a realistic Föppl-von Kármán number κ of a RBC.
RBC membrane rheology was first probed by TTC, showing good agreement with the experiments for the bending rigidity kc = 4.8 × 10⁻¹⁹ J and the membrane viscosity ηm = 0.022 Pa · s. Our results in Fig. 3 indicate that the RBC membrane bending rigidity may be 2–3 times larger than a widely used value of 2.4 × 10⁻¹⁹ J. This may be verified by new OMTC experiments that employ ferrimagnetic microbeads of different sizes. The TTC simulations also showed that a characteristic time of the RBC membrane can be defined by the intersection of g′ and g″ curves in Fig. 3 and is equal to ∼0.1 s consistent with experiments.
The second rheological test monitored membrane thermal fluctuations, resulting in reasonable agreement with the analogous experiments. In simulations, three-dimensional membrane fluctuations were measured directly at the network; however, in experiments, the motion of attached to the lipid bilayer microbeads was observed, which may account for the discrepancies. In addition, membrane undulations measured in experiments may be influenced by potential metabolic activities (e.g., ATP) suggested by recent experiments (38) and theories (39,40). However, no dependence of membrane fluctuations on ATP was found in Evans et al. (41). This issue is not fully resolved and is currently not addressed in our model. However, it suggests a topic for future work.
The third rheological test applied time-dependent stretching and relaxation of a whole RBC. The simulations show complex behavior due to the nonuniform cell strains, and the dependence of cell response on the applied stresses. In particular, such tests cannot accurately provide a meaningful membrane characteristic relaxation time as attempted in a number of experiments. The experiments also attempt to fit linear relaxation models, where using the power-law model would be preferred. The comparison of the simulation results with the experimental cell response yields the membrane viscosity to be between 20 and 60 times that of water.
The RBC dynamics was studied in Couette and Poiseuille flows. The RBC dynamics in shear flow yields two regimes: tumbling at low-shear rates and tank-treading at high-shear rates with a narrow intermittent region of mixed dynamics. The comparison of the simulation results with the theoretical predictions showed that RBC dynamics in shear flow can be predicted at most qualitatively by the existing theories because they do not take into account the RBC deformations and bending rigidity. In addition, the simulated RBCs showed strong membrane deformations around the tumbling-to-tank-treading transition, which greatly depend on the relative membrane elastic properties and bending rigidity. The observation of RBC shapes near the transition in experiments would be of great interest. Finally, RBC dynamics in Poiseuille flow showed RBC transition to the parachutelike shape, which occurs at the mean flow velocity of ∼65 μm/s.
Current RBC models are commonly validated to capture RBC mechanical response, but they are not able to appropriately describe membrane rheology and dynamics. The model of this work exhibits a number of RBC membrane properties simultaneously, and thus provides an adequate and realistic representation of a RBC. The model is general enough and can be used in other simulation methods, such as lattice Boltzmann, Brownian dynamics, immersed boundary method, multiparticle collision dynamics, etc.
Supporting Material
Three figures, one table, and 20 equations are available at http://www.biophysj.org/biophysj/supplemental/S0006-3495(10)00228-6.
Supporting Material
Acknowledgments
We thank Petia Vlahovska and Manouk Abkarian for useful discussions. Computations were performed at the National Science Foundation's National Institute for Computational Science facility.
This work was supported by the National Science Foundation under grant No. CBET-0852948 and by the National Institutes of Health grant No. R01HL094270.
References
- 1.Fung Y.C. 2nd ed. Springer-Verlag; New York: 1993. Biomechanics: Mechanical Properties of Living Tissues. [Google Scholar]
- 2.Waugh R., Evans E.A. Thermoelasticity of red blood cell membrane. Biophys. J. 1979;26:115–131. doi: 10.1016/S0006-3495(79)85239-X. [DOI] [PMC free article] [PubMed] [Google Scholar]
- 3.Discher D.E., Mohandas N., Evans E.A. Molecular maps of red cell deformation: hidden elasticity and in situ connectivity. Science. 1994;266:1032–1035. doi: 10.1126/science.7973655. [DOI] [PubMed] [Google Scholar]
- 4.Hénon S., Lenormand G., Gallet F. A new determination of the shear modulus of the human erythrocyte membrane using optical tweezers. Biophys. J. 1999;76:1145–1151. doi: 10.1016/S0006-3495(99)77279-6. [DOI] [PMC free article] [PubMed] [Google Scholar]
- 5.Suresh S., Spatz J., Seufferlein T. Connections between single-cell biomechanics and human disease states: gastrointestinal cancer and malaria. Acta Biomater. 2005;1:15–30. doi: 10.1016/j.actbio.2004.09.001. [DOI] [PubMed] [Google Scholar]
- 6.Puig de Morales-Marinkovic M., Turner K.T., Suresh S. Viscoelasticity of the human red blood cell. Am. J. Physiol. Cell Physiol. 2007;293:597–605. doi: 10.1152/ajpcell.00562.2006. [DOI] [PubMed] [Google Scholar]
- 7.Popescu G., Park Y.-K., Feld M.S. Coherence properties of red blood cell membrane motions. Phys. Rev. E Stat. Nonlin. Soft Matter Phys. 2007;76:031902. doi: 10.1103/PhysRevE.76.031902. [DOI] [PubMed] [Google Scholar]
- 8.Park Y.-K., Diez-Silva M., Suresh S. Refractive index maps and membrane dynamics of human red blood cells parasitized by Plasmodium falciparum. Proc. Natl. Acad. Sci. USA. 2008;105:13730–13735. doi: 10.1073/pnas.0806100105. [DOI] [PMC free article] [PubMed] [Google Scholar]
- 9.Fischer T.M. Shape memory of human red blood cells. Biophys. J. 2004;86:3304–3313. doi: 10.1016/S0006-3495(04)74378-7. [DOI] [PMC free article] [PubMed] [Google Scholar]
- 10.Abkarian M., Faivre M., Viallat A. Swinging of red blood cells under shear flow. Phys. Rev. Lett. 2007;98:188302. doi: 10.1103/PhysRevLett.98.188302. [DOI] [PubMed] [Google Scholar]
- 11.Tran-Son-Tay R., Sutera S.P., Rao P.R. Determination of red blood cell membrane viscosity from rheoscopic observations of tank-treading motion. Biophys. J. 1984;46:65–72. doi: 10.1016/S0006-3495(84)83999-5. [DOI] [PMC free article] [PubMed] [Google Scholar]
- 12.Fischer T.M. Tank-tread frequency of the red cell membrane: dependence on the viscosity of the suspending medium. Biophys. J. 2007;93:2553–2561. doi: 10.1529/biophysj.107.104505. [DOI] [PMC free article] [PubMed] [Google Scholar]
- 13.Skotheim J.M., Secomb T.W. Red blood cells and other nonspherical capsules in shear flow: oscillatory dynamics and the tank-treading-to-tumbling transition. Phys. Rev. Lett. 2007;98:078301. doi: 10.1103/PhysRevLett.98.078301. [DOI] [PubMed] [Google Scholar]
- 14.Suzuki Y., Tateishi N., Maeda N. Deformation of erythrocytes in microvessels and glass capillaries: effects of erythrocyte deformability. Microcirculation. 1996;3:49–57. doi: 10.3109/10739689609146782. [DOI] [PubMed] [Google Scholar]
- 15.Faivre, M. 2007. Red blood cells and vesicles. PhD thesis, Université J. Fourier Grenoble, Grenoble, France.
- 16.Noguchi H., Gompper G. Shape transitions of fluid vesicles and red blood cells in capillary flows. Proc. Natl. Acad. Sci. USA. 2005;102:14159–14164. doi: 10.1073/pnas.0504243102. [DOI] [PMC free article] [PubMed] [Google Scholar]
- 17.Pozrikidis C. Numerical simulation of cell motion in tube flow. Ann. Biomed. Eng. 2005;33:165–178. doi: 10.1007/s10439-005-8975-6. [DOI] [PubMed] [Google Scholar]
- 18.Eggleton C.D., Popel A.S. Large deformation of red blood cell ghosts in a simple shear flow. Phys. Fluids. 1998;10:1834–1845. doi: 10.1063/1.869703. [DOI] [PMC free article] [PubMed] [Google Scholar]
- 19.Discher D.E., Boal D.H., Boey S.K. Simulations of the erythrocyte cytoskeleton at large deformation. II. Micropipette aspiration. Biophys. J. 1998;75:1584–1597. doi: 10.1016/S0006-3495(98)74076-7. [DOI] [PMC free article] [PubMed] [Google Scholar]
- 20.Li J., Dao M., Suresh S. Spectrin-level modeling of the cytoskeleton and optical tweezers stretching of the erythrocyte. Biophys. J. 2005;88:3707–3719. doi: 10.1529/biophysj.104.047332. [DOI] [PMC free article] [PubMed] [Google Scholar]
- 21.Dupin M.M., Halliday I., Munn L.L. Modeling the flow of dense suspensions of deformable particles in three dimensions. Phys. Rev. E Stat. Nonlin. Soft Matter Phys. 2007;75:066707. doi: 10.1103/PhysRevE.75.066707. [DOI] [PMC free article] [PubMed] [Google Scholar]
- 22.Pivkin I.V., Karniadakis G.E. Accurate coarse-grained modeling of red blood cells. Phys. Rev. Lett. 2008;101:118105. doi: 10.1103/PhysRevLett.101.118105. [DOI] [PubMed] [Google Scholar]
- 23.Lim H.W.G., Wortis M., Mukhopadhyay R. Stomatocyte-discocyte-echinocyte sequence of the human red blood cell: evidence for the bilayer-couple hypothesis from membrane mechanics. Proc. Natl. Acad. Sci. USA. 2002;99:16766–16769. doi: 10.1073/pnas.202617299. [DOI] [PMC free article] [PubMed] [Google Scholar]
- 24.Malevanets A., Kapral R. Mesoscopic model for solvent dynamics. J. Chem. Phys. 1999;110:8605–8613. [Google Scholar]
- 25.Succi S. Oxford University Press; Oxford, UK: 2001. The Lattice Boltzmann Equation for Fluid Dynamics and Beyond. [Google Scholar]
- 26.Miao L., Seifert U., Döbereiner H.G. Budding transitions of fluid-bilayer vesicles: the effect of area-difference elasticity. Phys. Rev. E Stat. Phys. Plasmas Fluids Relat. Interdiscip. Topics. 1994;49:5389–5407. doi: 10.1103/physreve.49.5389. [DOI] [PubMed] [Google Scholar]
- 27.Hoogerbrugge P.J., Koelman J.M.V.A. Simulating microscopic hydrodynamic phenomena with dissipative particle dynamics. Europhys. Lett. 1992;19:155–160. [Google Scholar]
- 28.Fedosov, D. A. 2010. Multiscale modeling of blood flow and soft matter. PhD thesis, Brown University, Providence, RI.
- 29.Dao M., Li J., Suresh S. Molecularly based analysis of deformation of spectrin network and human erythrocyte. Mater. Sci. Eng. C. 2006;26:1232–1244. [Google Scholar]
- 30.Helfrich W. Elastic properties of lipid bilayers: theory and possible experiments. Z. Naturforsch. [C]. 1973;28:693–703. doi: 10.1515/znc-1973-11-1209. [DOI] [PubMed] [Google Scholar]
- 31.Espanol P. Fluid particle model. Phys. Rev. E Stat. Phys. Plasmas Fluids Relat. Interdiscip. Topics. 1998;57:2930–2948. [Google Scholar]
- 32.Amin M.S., Park Y.-K., Popescu G. Microrheology of red blood cell membranes using dynamic scattering microscopy. Opt. Express. 2007;15:17001–17009. doi: 10.1364/oe.15.017001. [DOI] [PubMed] [Google Scholar]
- 33.Hochmuth R.M., Worthy P.R., Evans E.A. Red cell extensional recovery and the determination of membrane viscosity. Biophys. J. 1979;26:101–114. doi: 10.1016/S0006-3495(79)85238-8. [DOI] [PMC free article] [PubMed] [Google Scholar]
- 34.Cokelet G.R., Meiselman H.J. Rheological comparison of hemoglobin solutions and erythrocyte suspensions. Science. 1968;162:275–277. doi: 10.1126/science.162.3850.275. [DOI] [PubMed] [Google Scholar]
- 35.Helfer E., Harlepp S., Chatenay D. Microrheology of biopolymer-membrane complexes. Phys. Rev. Lett. 2000;85:457–460. doi: 10.1103/PhysRevLett.85.457. [DOI] [PubMed] [Google Scholar]
- 36.Yoon Y.-Z., Kotar J., Cicuta P. The nonlinear mechanical response of the red blood cell. Phys. Biol. 2008;5:036007. doi: 10.1088/1478-3975/5/3/036007. [DOI] [PubMed] [Google Scholar]
- 37.Kessler S., Finken R., Seifert U. Swinging and tumbling of elastic capsules in shear flow. J. Fluid Mech. 2008;605:207–226. [Google Scholar]
- 38.Tuvia S., Levin S., Korenstein R. Mechanical fluctuations of the membrane-skeleton are dependent on F-actin ATPase in human erythrocytes. J. Cell Biol. 1998;141:1551–1561. doi: 10.1083/jcb.141.7.1551. [DOI] [PMC free article] [PubMed] [Google Scholar]
- 39.Gov N.S., Safran S.A. Red blood cell membrane fluctuations and shape controlled by ATP-induced cytoskeletal defects. Biophys. J. 2005;88:1859–1874. doi: 10.1529/biophysj.104.045328. [DOI] [PMC free article] [PubMed] [Google Scholar]
- 40.Zhang R., Brown F.L.H. Cytoskeleton mediated effective elastic properties of model red blood cell membranes. J. Chem. Phys. 2008;129:065101. doi: 10.1063/1.2958268. [DOI] [PubMed] [Google Scholar]
- 41.Evans J., Gratzer W., Sleep J. Fluctuations of the red blood cell membrane: relation to mechanical properties and lack of ATP dependence. Biophys. J. 2008;94:4134–4144. doi: 10.1529/biophysj.107.117952. [DOI] [PMC free article] [PubMed] [Google Scholar]
Associated Data
This section collects any data citations, data availability statements, or supplementary materials included in this article.