

Abstract
This article explores the role of some geometrical factors on the electrophoretically driven translocations of macromolecules through nanopores. In the case of asymmetric pores, we show how the entry requirements and the direction of translocation can modify the information content of the blocked ionic current as well as the transduction of the electrophoretic drive into a mechanical force. To address these effects we studied the translocation of single-stranded DNA through an asymmetric α-hemolysin pore. Depending on the direction of the translocation, we measure the capacity of the pore to discriminate between both DNA orientations. By unzipping DNA hairpins from both sides of the pores we show that the presence of single strand or double strand in the pore can be discriminated based on ionic current levels. We also show that the transduction of the electrophoretic drive into a denaturing mechanical force depends on the local geometry of the pore entrance. Eventually we discuss the application of this work to the measurement of energy barriers for DNA unzipping as well as for protein binding and unfolding.
Introduction
The ability to discriminate, probe, and manipulate freely floating unlabeled single molecules by transiently confining them in a nanoscopic region of space is appealing in many views. In the case of the nanopore technique, DNA (1), proteins (2,3), or biopolymers (4) are driven through a nanometer-size hole by a controlled electrochemical potential gradient. The transient and reversible lodging of the molecules in the confinement area is detected, generally, by the concomitant drop of the ionic current flowing through the pore (5). After more than a decade of investigations of nanopores as stochastic sensors (6–9), a wealth of results are available for translocations of ssDNA, dsDNA, polypeptides, and neutral polymers through α-hemolysin or solid-state pores. In particular, it was demonstrated that the electrophoretic transport of ssDNA or RNA through an α-hemolysin pore depends on voltage, temperature, and strand orientation 5 (10–14). Nanopores can be used not only as counters or sieves but also as means to exert locally a denaturing force. This property was used to probe DNA-enzyme (15–17) interactions as well as nucleic acid unzipping (18–21) and protein folding (2,3). It was also suggested that nanopores could resolve RNA secondary structures (22,23). If, as in the case of α-hemolysin, the nanopore is large enough to allow the passage of a single strand but small enough to block the double-stranded part, sequential opening and refolding of the intramolecular helices can be expected at high-enough bias voltages. However, for this approach to be a useful tool to analyze secondary structures, one needs to discriminate the free passage of single-stranded regions from the periods when helices unzip. It was reported that short or long DNA hairpins can be opened by translocation through artificial (24,25) or proteinaceous nanopores (18–21) of internal diameter inferior to the DNA double-helix diameter (2.2 nm). The unzipping occurs at the narrowest constriction site. To the best of our knowledge, the current measured during the unzipping process matches that of a simple translocation. Hence no current contrast exists between a single-stranded part freely crossing the constriction site and a double-helix unzipped at that location. One can expect that nanopores of appropriate geometry may provide such a necessary contrast in the prospect of secondary structure analysis. Pores of tailored shape can be made artificially in solid-state materials (26–28). Reproducible geometry (pore diameter, pore angle, cross section) is a key point if these artificial sensors are to be used as probes of nucleic acids' secondary structures (25). Another option is to use self-assembling proteinaceous pores such as α-hemolysin (29), aerolysin (2,30), or MspA (31,32). They have a well-defined pore lumen, and therefore prove well adapted for efficient analyte analysis and DNA mechanical denaturation. In this article, we tackle the following two questions:
How can the geometry of the pore be used to discriminate between a single strand crossing the constriction and a double strand being unzipped at the constriction?
How does the degree of preconfinement before the nucleic acid enters the pore affect the mechanical unzipping process?
Materials and Methods
Buffer and molecules
In this study we used 10 mM Tris-Cl buffer, 1 M KCl, pH 8.4. The single-stranded poly adenines were purchased from Eurogentec (Liege, Belgium). HPLC was purified and used at a final concentration of 5 μM. The hairpins hp polyA and hp blunt were also purchased from Eurogentec, gel-purified and slowly annealed. Their final concentration was 10 μM. Both hairpins share a common sequence:
5′-AGG CTG CGA ATT GCT GTT GTTG CAG GAC GAA TCG CAG CCT-3′.
hp blunt is a blunt hairpin of 18 basepairs. hp polyA has an additional 3′ overhang of 30 poly adenines.
Substep analysis
We used a classical setup for nanopore experiments that is further described in the Supporting Material. Blockade events were first identified by fixing a threshold blockade level (70% of the open pore current). Each trace was then filtered and fitted to a series of unrestricted number of substeps. We used the nonlinear filter described in Haran (33).This nonlinear-smoothing skim efficiently reduces the high-frequency noise with a minimal smoothing of abrupt changes in the current trace. An example of raw and smoothed curves are given later in Fig. 6. The fit of the trace was performed by first evaluating the most probable substep values for each trace determined as the peak values of the trace current histogram. Each data sample was then rounded to the closest peak value. It yields a trace with discrete levels that is further processed to eliminate substeps shorter than 100 μs. Each substep level is then set as the average value of the smoothed current trace over the substep duration. The resulting trace is given later in Fig. 6. We then make a histogram of the substep-level occurrence by counting the number of traces in which a defined level occurs at least once. This skim prevents a few long translocations from dominating the histogram due to their large number of equal substep levels.
Figure 6.
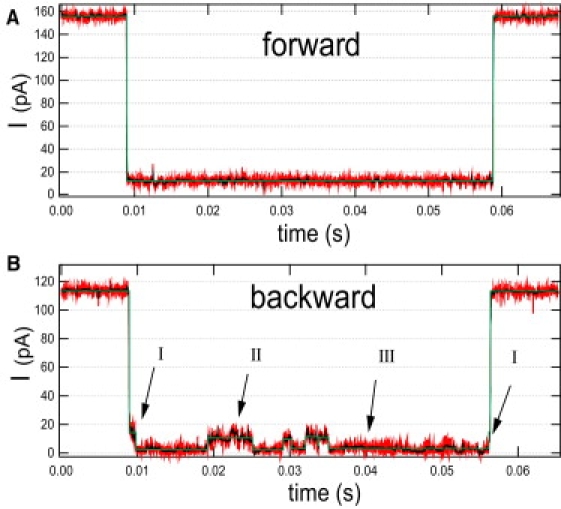
Typical traces for translocation events of hppolyA at 150 mV. The raw data is acquired at 105 S/s and filtered at 10 kHz (red). The nonlinearly filtered data (black) and the multistep analysis (green) are presented for both translocation directions. (A) In the forward direction, the event has a well-defined blocked current level. (B) In the backward direction, the translocation events present a steplike noise with three levels: a high (I) level that occurs only at the beginning and end of the event; an intermediate level (II); and a low level (III). Histograms of these level values are shown on Fig. 7.
Results
To answer these questions we use the α-hemolysin toxin, an asymmetric porin from Staphylococcus aureus with a well-characterized x-ray structure (29). The pore is composed of a vestibule cavity with an inner diameter of 4 nm and a transmembrane stem region with an average lumen diameter of 2.1 nm. These regions are separated by a constriction of 1.5 nm in diameter that constitutes the narrowest part of the pore. When DNA hairpins translocate from the vestibule side (forward direction), they are preconfined by the vestibule cavity before entering the stem at the constriction site. When they translocate from the stem side (backward direction), there is no preconfinement and the constriction site is passed just before the molecule leaves the pore. By inducing the translocation of single-stranded DNA from either side of the pore, we test the influence of the geometrical asymmetry on the translocation time and blocked current level as a function of the DNA orientation in the pore (see Translocation of ssDNA). Performing the same experiments with hairpin DNA (see Translocation of DNA hairpins), we then show that the α-hemolysin pore can discriminate between ssDNA and dsDNA, provided that the DNA enters the pore from the stem side. We address the issue of the transduction of the electrophoretic force (which drives the DNA through the pore) into a denaturing mechanical force (which is exerted on the basepairs of the unzipping hairpin). We explore the changes of this transduction as the contacts between the DNA and the pore are modified, leading to new entry requirements. To illustrate the geometrical changes due to the pore reversion, we draw the configurations of the ssDNA (Fig. 1) and dsDNA (later in Fig. 5) in the pore.
Figure 1.
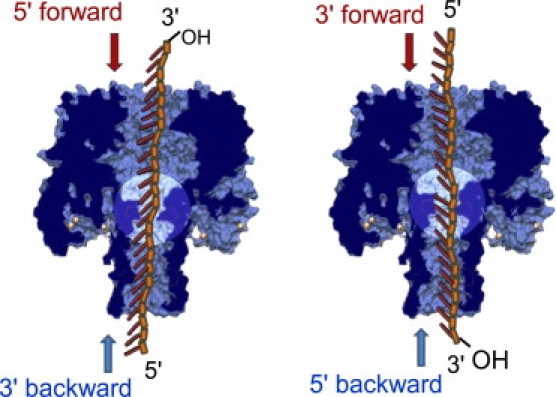
Schematic representations of the DNA inside the pore for both DNA orientations and both translocation directions. The tilt of the bases is purely schematic to illustrate the MD simulation results obtained in Mathé et al. (11). Note the equivalence of the static situations for DNA with their 5′ end first in the forward direction (respectively, 3′ end first in the forward direction) and DNA with their 3′ end first in the backward direction (respectively, 5′ end first in the backward direction).
Figure 5.
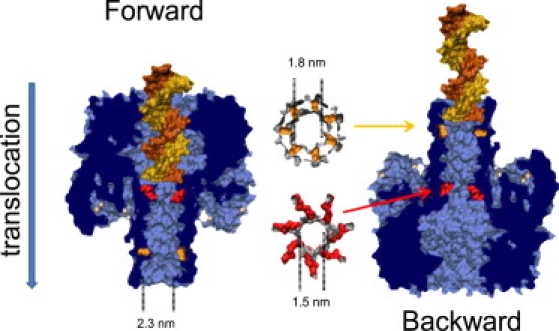
Possible configurations of dsDNA in the α-hemolysin vestibule and docking of dsDNA in the trans part of the stem. Note that, in the backward case, the double-stranded part can penetrate 1.4 nm into the stem. The Lysines 147 corresponding to the vestibule/stem constriction are highlighted in red. The threonines 125 are in orange. (For the sake of clarity, the 3′ single strand overhang is not represented here; however, were it to be represented, it should span the entire stem.)
Translocations of ssDNA: orientation- and direction-dependence
First, we focus on the influence of the translocation direction of single-stranded poly adenines through the pore. Fig. 1 schematically shows the four possible configurations (34) of the pore relative to the DNA orientation. In the forward direction, previous studies (11–13) proved that the translocation times, the blockade levels, and the translocation success rates depend on the orientation of the DNA or RNA when they enter the stem part. All-atoms molecular dynamics (MD) simulations (11,12) suggest that these differences are due to the preferential tilting of the bases toward the 5′ end when the single strand is strongly confined. A Christmas-tree effect can indeed explain why the translocations with 3′ end first are more likely to occur and are subject to a smaller friction from the pore than translocations with the 5′ end first. Each DNA orientation possesses a characteristic current level that was mainly attributed to the local orientation of the bases at the constriction site. The same set of arguments should also hold for DNA translocating from the stem side (backward direction). We show that when the ssDNA enters the pore from the stem side, the 3′-first orientation is the faster and most frequently observed one. The translocation speed of a DNA entering with its 3′ end first does not depend on the direction of translocation. In contrast, the normalized blocked current of DNA with their 3′ end first in the backward direction corresponds to the value of DNA with their 5′ end first in the forward direction. Fig. 2 summarizes these results for a 50-mer of poly adenines at a voltage of 150 mV.
Figure 2.
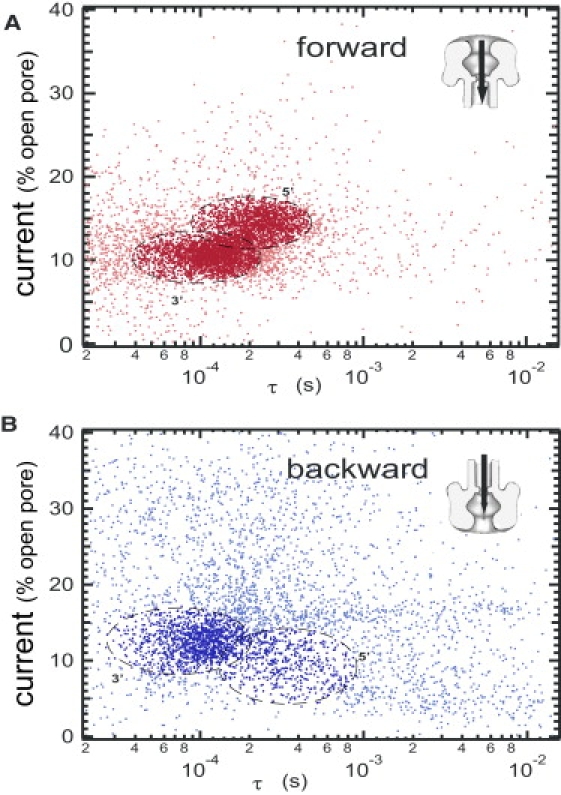
Scatter plot of the normalized blocked current as a function of the event durations in the forward and backward directions. We discriminate two groups of events. The dark-colored events are identified as true translocations. The light-colored events are identified as blocked molecules or aborted translocations. The first group represents 90% of the 5700 events in the forward direction (A) and 62% of the 4700 events in the backward direction (B). In the forward direction, note the bimodal distributions corresponding to DNA, translocating with their 3′ and 5′ end first. In the backward direction, the bimodal distribution turns into a major cluster with a long tail to the low current and long time. We attribute the main cluster to DNA translocating with their 3′ end first and the tail to the other DNA orientation. See text for the clustering criteria.
Qualitatively the scatter plot of Fig. 2 A displays two distinct clusters of points, the boundaries of which are explained in the Supporting Material. The clusters correspond to both DNA orientations as described in the literature (11,13) in the forward direction. The observed bimodal distribution corresponds to the two possible orientations of the DNA in the pore as already observed in Mathé et al. (11). The scatter plot for the backward direction (Fig. 2 B) differs qualitatively from the forward direction, although we used the same thresholding criteria to record our data. We observe a skewed main cluster of points at ∼10−4 s and a large number of events with high blocked currents or long translocation times. These observations can be explained by three main changes in the geometrical constrains due to the pore asymmetry:
-
1.
The absence of the vestibule before the DNA enter the pore. In the backward direction, it results in an increased number of molecules bumping into the pore mouth leading to transient spikes low enough to be detected. It explains the large scatter of points with ib >20%.
-
2.
The asymmetry of the interaction potential between the DNA and the pore. Combined with the previous effect, the entropic and energetic entry barrier into the pore is raised. The exponential inter event distribution with entry rate of 8.5 Hz in the forward direction is reduced to 1.1 Hz in the backward one, in line with what was observed for DNA (35) or symmetric biopolymers (36).
-
3.
The passage of the constriction after the DNA have entered the stem. A larger time spent in the stem increases the probability of strong DNA/pore interactions. Hence the large number of abnormally long events in the backward direction. At long times we find two distinct levels (≃10% and ≃14%) of stuck molecules that we attribute to both DNA orientations.
To analyze our data quantitatively, we defined the boundaries of the two clusters of points for each direction. The definition of the cluster boundaries are given in Supporting Material. Ninety-percent of the 5700 forward events and 62% of the 4100 backward events are selected. These four clusters shift to smaller times when the voltage increases, whereas the rest of the events are nearly voltage-insensitive. This clustering captures the main features of the translocation process. Changing the boundaries of the cluster by 10% for the blocked current and 20% for the time marginally modifies our results. Figs. 3 and 4 show the distributions of blocked current and translocation times, respectively, for the selected events. The blocked current distributions are clearly not Gaussian and for each direction, a double-Gaussian fit identifies two populations of events. In the case of the forward direction, we find that ssDNA with their 3′ end first translocate with a characteristic blocked current ib3′f = 10.6% ± 2.3%. In the 5′ orientation, the blocked current increases to ib5′f = 14.6% ± 2.1%. Based on current discrimination, we also determined the characteristic translocation times for each orientation: τ3′f = 115 ± 5 μs and τ5′f = 239 ± 5 μs. These results agree with the values found in Mathé et al. (11) for poly A at 120 mV.
Figure 3.
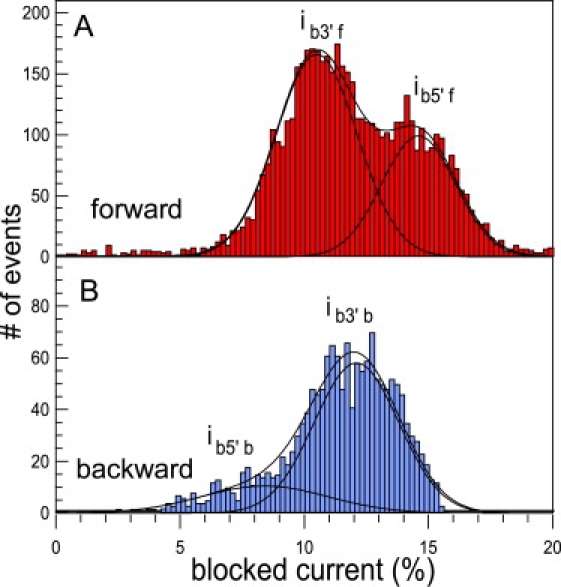
Normalized current distributions for the selected events in the (A) forward and (B) backward directions. Double-Gaussian fits (continuous line) yield the following values for the mean blocked current: forward direction, ib3′f = 10.6% ± 1.9% and ib5′f = 14.6% ± 2.3%; backward direction, ib5′b = 8.5% ± 3.6% and ib3′b = 12.1% ± 2.4%. Each peak corresponds to the entry of the 3′ or 5′ end first as previously demonstrated in the forward geometry. In the case of the backward direction, the double peak does not clearly appear, and a single Gaussian poorly fits the data. Note that ib5′f > ib3′f and ib3′b > ib5′b. The 5′ end first in the forward direction and 3′ end first in the backward direction correspond to the same static configuration of the pore, with respect to the DNA strand.
Figure 4.
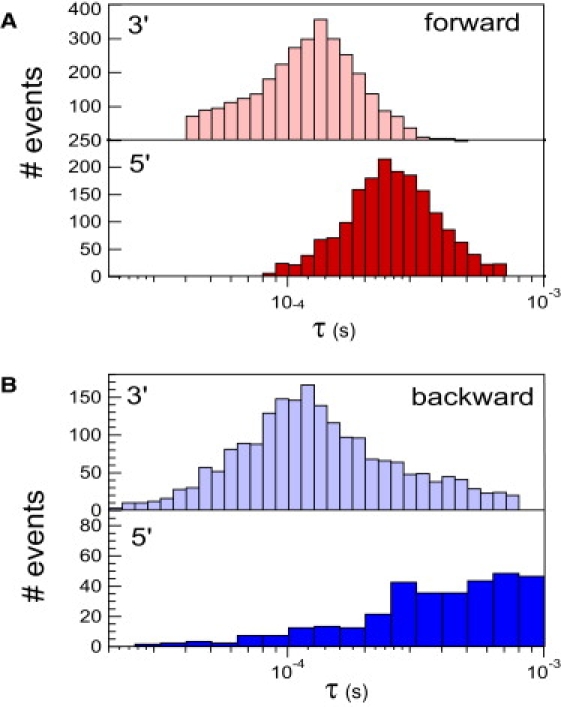
Histograms of the event durations in the forward (A) and backward (B) directions for the 3′ (light) and 5′ (dark) end first. In the forward direction, both distributions are sharply defined with the characteristic times τ3′f = 115 ± 5 μs and τ5′f = 239 ± 5 μs, in agreement with the reported values in the literature. In the backward direction, the distributions are broader with the characteristic times of τ3′b = 110 ± 10 μs and τ5′b = 510 ± 40 μs. The 3′ end-first configuration is the faster one and translocates at the same speed for both pore orientations.
In the backward direction, we identify two populations with ib1 = 8.5% ± 3.6% and ib2 = 12.1 ± 2.4%.
To attribute these values to a DNA orientation, we used DNA hairpins with a single-strand overhang. When the overhang was at the 3′ end of the hairpin, we could identify a blocked current level at ∼13.1%. These experiments are described in Substep Analysis. We hence attribute the value of ib3′b = 12.1 ± 2.4% to DNA translocation with the 3′ end first. The value of ib3′b also corresponds to the blocked current level of the main cluster of events. As in the case of the forward direction, the 3′ end-first orientation thus has the larger success rate. The characteristic time associated with this cluster is τ3′b = 110 ± 10 μs. It is remarkably similar to the characteristic time τ3′f = 115 ± 5 μs that we find for the forward direction. Hence, as previously observed for symmetric dextran-sulfate polymers (36), the force and the friction exerted on the DNA are conserved when the direction of translocation is reversed. We also observe that the passage of the 5′ end-first orientation is less favored and the translocation process is slower. The molecules entering with this orientation are more likely to get stuck in many possible configurations inside the pore stem. It is where the high degree of scattering of the 5′ cluster stems from. All these results are consistent with the base-tilting scenario where the DNA translocation is facilitated or hindered by the spontaneous tilting of the bases toward the DNA 5′-end in a confined environment.
We also point out that ib3′b > ib5′b in contrast with the results in the forward direction where ib3′b < ib5′b. In Mathé et al. (11), it was argued that the difference of current levels between 3′ and 5′ is due to the mean local configuration of the base located at the constriction site. A crude estimate as well as simulations show that the speed of ions in the pore is approximately two-orders-of-magnitude larger than the translocation speed of DNA. (Note that we estimate the K+ ions speed in the pore as follows: First we approximate that all the ionic current is carried by K+ when the pore is occupied. The typical current is I = 10 pA = 1.6 108 K+/s. 1 M KCl corresponds to a density of ρ = 0.6 K+/nm3. The pore section is S = π × 12 nm2. The ion velocity reads νions = I/S.ρ = 9.107 nm/s. The residence time of an ion in the 5-nm stem region is thus ∼50 ns to be compared to the translocation time of the DNA base at ∼2 μs.) To a first approximation, the DNA can be considered immobile with respect to the counterions. The static configuration of the DNA with it 5′ end first (respectively, 3′ end first) in the forward direction is identical to the 3′ end first (respectively, 5′end first) in the backward direction as shown in Fig. 1. For ssDNA, the relative order of the ionic currents should thus be reversed, as we indeed observe. The values of the blocked current and translocation times for both directions are summarized in Table 1.
Table 1.
Orientation and direction dependence of the translocation parameters
| Pore direction | DNA orientation | ib (%) | σ (%) | τ (μs) |
|---|---|---|---|---|
| Forward | 3′ first | 10.6 | 2.3 | 115 ± 5 |
| Forward | 5′ first | 14.6 | 2.1 | 239 ± 5 |
| Backward | 3′ first | 12.1 | 2.4 | 110 ± 10 |
| Backward | 5′ first | 8.5 | 3.6 | 510 ± 40 |
Normalized blocked current and event duration for each subpopulation extracted from the Group-A clouds of the forward and backward experiments scatter plots.
We showed that, independently of the translocation direction, DNA entering the pore with their 3′ end translocate faster than with their 5′ end. Remarkably, at least for the 3′-first orientation, the translocation time does not depend on the pore direction. It leads to the conclusion that, for this DNA orientation, the electrophoretic force and the friction coefficient depends very little on the pore direction. For the 5′-first orientation, the conclusion is less obvious, due to the uncertainty of the cluster definition. In contrast, the values of the blocked current seem to correlate with the static orientation of the bases at the constriction site and hence with the relative pore/DNA orientation. We also showed that the absence of vestibule and the passage of the constriction after the DNA enters the pore entails a large scattering of the data points due to false events and stuck molecules.
Translocation of DNA hairpins: positional noise and force transduction
We now focus on the influence of the pore geometry upon the coupled problem of dsDNA translocation when unzipping of the paired region is required. DNA hairpins of ≤100 bases can be unzipped by threading them across the pore in the forward direction (18,20,25,38). The constriction diameter of 1.5 nm allows ssDNA through, but blocks the double-stranded part. If a single-strand overhang is added at one end of the hairpin, it can enter the stem part where the electric field is larger. At the contact site between the DNA and the pore, the electrophoretic bias applied on the strain inserted in the stem transduces into a mechanical force exerted on the bases. The situation is described in Fig. 5 where the 3′ overhang, inserted in the stem part, was removed for sake of clarity. (Note that we used an 18-mer DNA model generated by http://farwer.staff.shef.ac.uk/PREDICTOR/index.php and submitted as a rigid body ligand for the structure of the α-hemolysin 7AHL.pdb on the PathDock server http://bioinfo3d.cs.tau.ac.il/PatchDock/.) The electrophoretic force acting on the single strand originates from the electric field and the motion of counterions. Its transduction into a mechanical force acting on the bases depends on the physical contact of the DNA with the pore, the local environment around the unzipping fork, and the orientation of the DNA with respect to the pore. In the forward direction, the vestibule cavity reduces or even precludes the variation of the angle between the helix and the pore axis. One can thus expect shear forces to be applied on the DNA hairpin. In the backward direction, the molecular structure of the α-hemolysin shows that the double-stranded helix can penetrate the stem region over 1.4 nm up to the 1.8-nm constriction formed by Thr125. The hairpin is no longer held in place by the 5-nm-long vestibule. The angle of the DNA with the pore can fluctuate, potentially resulting in large variations of the unzipping force. Moreover, the stem/vestibule constriction (Lys147) is passed after the single strand has entered the pore and part of the stem can be filled with a double-stranded part. One might expect different blocked current levels for the occupancy of the stem by a single strand only or by the overhang, plus a part of the double-stranded region. To test these ideas, we used hairpins of 18 bases (see Materials and Methods). We coined hp blunt the blunt terminated hairpins and hp polyA the hairpins with a 3′ overhang of 30 adenines. All experiments presented here are performed at 150 mV.
First we compare the translocation events for hp polyA in the forward and backward direction. Fig. 6 displays two typical translocation traces. In the forward direction, the blocked current level is very steady. The current fluctuations are spectrally identical for both the blocked and the open pore currents. The major noise contribution originates from the setup and we could not extract information on the real-time position of the hairpin in the pore. In the backward direction, the translocation events display a steplike noise between discrete current sublevels. We identify and fit these sublevels as described in Materials and Methods. We plot the histogram of the sublevel values on Fig. 7 A. We distinguish three values: type I sublevels at ∼13.1%, type II at ∼7.3%, and type III at ∼2.3%. As depicted on Fig. 7 B, type I levels occur only as the first and last substep level of the event. These sublevel values are detected in 85% of the cases for hp polyA and only 25% of the cases for hp blunt that lacked the 3′ overhang. The value of 13.1% is also close to the value of 12.1% that we find for ssDNA entering with its 3′ end first. Hence we attribute these levels to the presence of the overhang alone in the stem region and across the constriction. Type III levels correspond to a very efficient blocking of the ionic current. We suggest that it stems from the entrance of the unzipping fork into the first 1.4 nm of the stem. Indeed, on the opposite side of the vestibule, the stem enlarges to a diameter of 2.4 nm over a distance of 1.5 nm (around Thr125). This region was previously found to influence the value of the blocked current for single-stranded homopolymers (40). The situation where the DNA fits into this minor cavity with its 3′ overhang engaged in the pore seems likely to result in the smallest ionic current. For 90% of the translocation, the second substeps have a type-III level, as shown on Fig. 7 B. Type-II levels are intermediate levels with a blocked current at ∼7.3%. We attribute them to dsDNA partially blocking the stem entrance due to side flipping of the DNA or the opening of the unzipping fork. Except for the first and last substeps, the steplike noise occurs between levels of type II and III.
Figure 7.
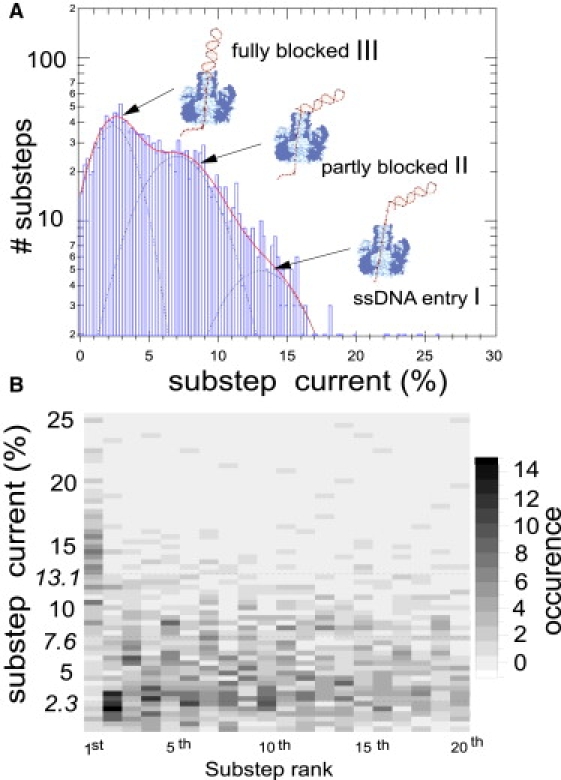
(A) Histogram of the normalized substep levels. The three-Gaussians fit (continuous line) has a major maximum at 2.3%, type III; an intermediate one at 7%, type II; and a minor maximum at 13.1%, type I. (B) Two-dimensional histogram of the sublevels versus the substeps number (up to the 20th substep). Eighty-five-percent of the first substeps have a blocked, type-I current. Eighty-five-percent of the second steps have type II values. Ninety-percent of the translocations end with a type-I sublevel. We have checked that this is not an artifact occasioned by the steep fall (respectively, rise) of the current from (respectively, to) the open pore level. This value of 13% is reminiscent of the blocked current value found for ssDNA entering with its 3′ end first on Fig. 2. Two-hundred-and-thirty translocations were analyzed. We interpret the different blocking levels as: I, the single-stranded overhang alone in the pore; II, the double-stranded part of the DNA partially blocking the trans pore entrance; and III, the double-stranded part lodged in the pore entrance cavity as depicted in panel A.
Our interpretation is further confirmed by the experiments performed on hp blunt. For hp blunt, no translocation is expected, because the hairpins lack an overhang. In that case indeed, we record mostly short events, the distribution of which hardly depends on the applied voltage. However, for some long-enough events, we detect a steplike noise between type II and type III sublevels. Hence, these levels result from the interaction of the dsDNA with the pore. It also shows that the insertion of a double-stranded part in the stem entrance is enough to block the ionic current almost fully. We thus propose that the steplike noise that we observe originates from the real-time local position of the DNA at the stem entrance.
We established a criteria to discriminate real translocation events from molecules bumping into the pore. In the backward direction we considered only events presenting a first and last step at ∼13% and a second step at ∼2%. Fig. 8 shows the scatter plot of the translocation events for both directions. The selected events are dark-colored. For hp polyA, most of the events with translocation times above 0.01s fulfill this criterion. In the case of hp blunt, due to the overlap of the current values for type II and type I events, few events are wrongly identified as translocations. We calculated the histograms of the unzipping times in the forward and backward configuration (Fig. 9). The most probable unzipping time in the forward direction is 10 ms ± 5 ms, in agreement with the literature values for hairpins of the same size. In the backward direction the most probable time is increased to 50 ms. We correlate this increase to the existence of the steplike noise. The position fluctuations of the unzipping fork at the stem entrance must result in fluctuations of the transduction of the electrophoretic drive into the unzipping force. We expect that the mechanical bias applied on the double-helix unzipping region differs for both situations in direction as well as amplitude. The increase of the unzipping time in the backward geometry can be thus explained by the intermittent application of the mechanical force that increases the rezipping probability of the already opened portion of the DNA hairpin. The scenario that we have just discussed appears probable and consistent with all our observations. It could be informative to see whether MD simulations on the millisecond timescales can confirm these ideas.
Figure 8.
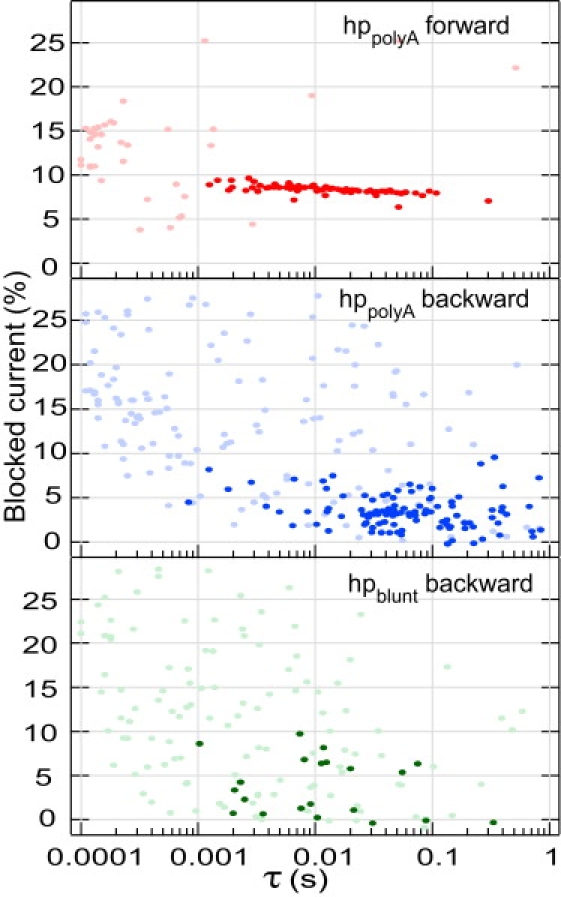
Scatter plot of the normalized blocked current versus translocation times for hppolyA in the forward and backward directions and hpblunt in the backward direction. Dark-colored points are the points selected as real translocations. In the forward direction, only those points that belonged to the main cluster were selected. In the backward direction, we applied a criterion based on the presence of a first and last substep between 10% and 18% (see text for details). Some hpblunt events are unexpectedly identified as true translocations due to the width of the distribution of type II events and are treated as false-positive to the selection criterion.
Figure 9.
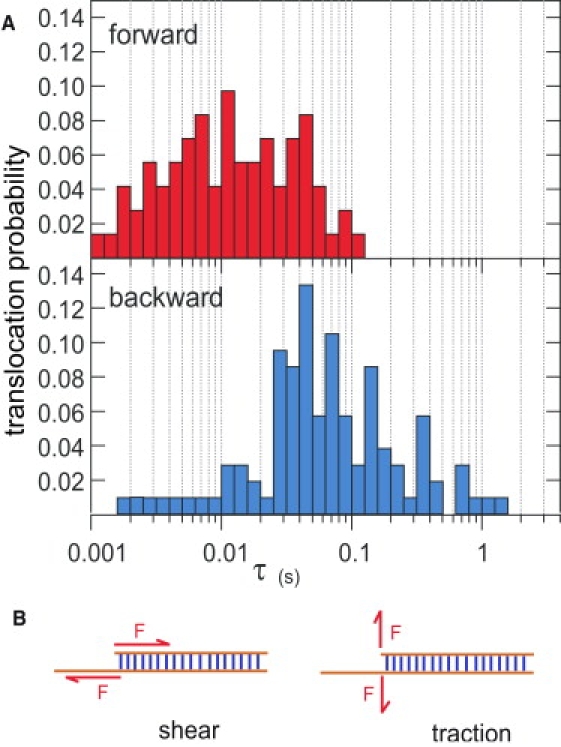
(A) Distribution of the translocation times for the events identified as hairpin translocations in the forward and backward cases. Note that the most probable translocation time is five times slower in the backward geometry (50 ms 8 ± 5 ms) than in the forward geometry (10 ms ± 5 ms). The distribution in the backward direction spans also a decade more toward large unzipping times. We attribute these differences to different modes of force application on the unzipping fork and to enhanced thermal fluctuations of the unzipping force in the backward direction. (B) Schematic representation of the two possible opening modes: shear and traction.
Discussion
Our results for ssDNA have already been discussed in the previous section. We now develop our interpretation of the stochastic current noise for dsDNA. We finally elaborate on the problem of mechanical forces transduction in the context of nanopores.
Origin of sublevels
The occurrence of sublevels in the blocked current have already been reported in the literature for other types of experiments with nanopores. First, we would like to compare our results to previous reports. For α-hemolysin, a well-documented sublevel at ∼50% (41) corresponds to the insertion of a single-stranded or double-stranded DNA in the vestibule cavity without any DNA part in the stem region. Single-stranded RNA composed of alternate regions of poly A and poly C also display distinct sublevels during the molecule translocation (10). In the case of artificial nanopores, various sublevels occur when long single-stranded or double-stranded DNA translocate through pores with a diameter above 10 nm. They are attributed to the simultaneous passage of several strands of the same molecule (42). All these processes correspond to free translocations of DNA molecules through the pore. Some telegraphic noise between the vestibule level and fully blocked current level was reported and analyzed (43,44) for blunt hairpins trapped in the vestibule cavity. In that case the substeps reflect the partial and transient passage of the thermally opened basepairs at the blunt end of the hairpin. When the pore is reversed, we showed that the double-stranded part blocks the current more than the single-stranded part. We explain it by the presence of a minor cavity at the stem entrance that fit double-stranded DNA in size. The steplike noise comes from a discrimination between the blocked current levels of ssDNA alone in the pore, of dsDNA fully engaged in this minor cavity, and of dsDNA partly engaged in the minor cavity. Minor changes in the local radius of the pore before the maximum constriction can thus be enough to allow the real-time monitoring of the position of some molecule moiety in the pore.
Transduction of the electrophoretic drive
A cavity in front of the constriction also plays a role of preconfinement. In the case of α-hemolysin, the diameter of the vestibule part is too large and the vestibule/stem constriction too narrow to generate a contrast of blocked currents due to the presence of a double-stranded part in contact with the constriction when a single-stranded part is already engaged in the stem region. The vestibule, however, efficiently holds the hairpin in front of the constriction. On the other stem side, the minor cavity has a diameter very close to the double-helix diameter. It allows the discrimination between double and single strands engaged in the stem but it hardly constrains the position of the hairpin DNA due to its limited axial extent. The transduction of the electrophoretic force into a mechanical unzipping force is changed when the preconfinement is modified. Opening in a shear mode is more likely to happen in the forward direction where the DNA is held by the vestibule. The strand inserted in the stem at the constriction site undergoes a downward force due to the electrophoretic drive. The other strand, stuck at the constriction, sustains an upward force due to the pore reaction. This force dipole shears the last bases of the hairpin structure. If the DNA tilts sideways as in the case of the backward direction, the unzipping force is now applied in a traction mode within the plane of the paired bases. The reaction pathway for DNA unzipping can thus be changed by changing the pore geometry. Similar geometrical effects have been investigated in the context of artificial nanopores (24,45). Zhao et al. (24) and Comer et al. (45) observed that the voltage threshold required to translocate double-stranded DNA through pores of diameter 1 nm < d < 1.5 nm is smaller than for pores with 1.5 nm < d < 2.3 nm. MD simulations explained this behavior by two modes of translocations involving the unzipping of the basepairs (favored by small diameter) and the stretching of the double-helix (favored by larger diameter). In our case, we likely see the effects of two different unzipping modes. In a broader context, all these studies show that the measure of the translocation time in nanopore experiments is not an unambiguous measurement of the absolute stability of the probed structure. When the translocation process of macromolecules (DNA, proteins) requires the mechanical action of the pore (unzipping, stretching, unfolding, ripping of proteins), the geometry dependence of the transduction of the mechanical force should be considered (16). In particular, nanopore threading selects specific reaction pathways due to the confinement. The basepairing, folding, or binding free energies measured through this technique can depend on the favored pathway and thus on geometrical factors. We are currently further exploring these effects experimentally.
Conclusions
In this article, we explored the role of the geometry on the translocation and on the unzipping process of nucleic acids through nanopores. This was achieved in the particular case of α-hemolysin by translocation of molecules from the stem to the vestibule side. We showed that the translocation time of single-stranded poly A depends mainly on the orientation of the DNA, irrespective of the translocation direction, whereas the values of the blocked current reflect the static relative orientation of the bases at the constriction site. We also reported that a contrast in the ionic current can be obtained between the single-stranded and double-stranded part of the same molecule in the case of a 2.2-nm pore ending with a 1.5-nm constriction. The absence of preconfinement before unzipping yields a higher scattering of the data points, a steplike noise in the block current due to multiple DNA/pore configurations, and an increase of the unzipping time. We point out the importance of the pore shape upon the transduction efficiency of the electrophoretic drive in becoming a mechanical unzipping force.
Supporting Material
Two subsections are available at http://www.biophysj.org/biophysj/supplemental/S0006-3495(10)00206-7.
Supporting Material
Acknowledgments
The group belongs to the Centre National de la Recherche Scientifique consortium, CellTis.
This work was supported by the Agence Nationale Recherche (ANR) Programme en Nanosciences et Nanotechnologies (PNano) grant No. 06-NANO-015.
References
- 1.Meller A., Nivon L., Branton D. Rapid nanopore discrimination between single polynucleotide molecules. Proc. Natl. Acad. Sci. USA. 2000;97:1079–1084. doi: 10.1073/pnas.97.3.1079. [DOI] [PMC free article] [PubMed] [Google Scholar]
- 2.Stefureac R., Long Y.T., Lee J.S. Transport of α-helical peptides through α-hemolysin and aerolysin pores. Biochemistry. 2006;45:9172–9179. doi: 10.1021/bi0604835. [DOI] [PubMed] [Google Scholar]
- 3.Oukhaled G., Mathé J., Auvray L. Unfolding of proteins and long transient conformations detected by single nanopore recording. Phys. Rev. Lett. 2007;98:158101–158105. doi: 10.1103/PhysRevLett.98.158101. [DOI] [PubMed] [Google Scholar]
- 4.Brun L., Pastoriza-Gallego M., Pelta J. Dynamics of polyelectrolyte transport through a protein channel as a function of applied voltage. Phys. Rev. Lett. 2008;100:158302. doi: 10.1103/PhysRevLett.100.158302. [DOI] [PubMed] [Google Scholar]
- 5.Kasianowicz J.J., Brandin E., Deamer D.W. Characterization of individual polynucleotide molecules using a membrane channel. Proc. Natl. Acad. Sci. USA. 1996;93:13770–13773. doi: 10.1073/pnas.93.24.13770. [DOI] [PMC free article] [PubMed] [Google Scholar]
- 6.Kasianowicz J.J., Robertson J.W.F., Stanford V.M. Nanoscopic porous sensors. Annu Rev. Anal. Chem. 2008;1:737–766. doi: 10.1146/annurev.anchem.1.031207.112818. [DOI] [PubMed] [Google Scholar]
- 7.Bezrukov S.M., Vodyanoy I., Parsegian V.A. Counting polymers moving through a single ion channel. Nature. 1994;370:279–281. doi: 10.1038/370279a0. [DOI] [PubMed] [Google Scholar]
- 8.Gu L.Q., Braha O., Bayley H. Stochastic sensing of organic analytes by a pore-forming protein containing a molecular adapter. Nature. 1999;398:686–690. doi: 10.1038/19491. [DOI] [PubMed] [Google Scholar]
- 9.Branton D., Deamer D.W., Schloss J.A. The potential and challenges of nanopore sequencing. Nat. Biotechnol. 2008;26:1146–1153. doi: 10.1038/nbt.1495. [DOI] [PMC free article] [PubMed] [Google Scholar]
- 10.Akeson M., Branton D., Deamer D.W. Microsecond timescale discrimination among polycytidylic acid, polyadenylic acid, and polyuridylic acid as homopolymers or as segments within single RNA molecules. Biophys. J. 1999;77:3227–3233. doi: 10.1016/S0006-3495(99)77153-5. [DOI] [PMC free article] [PubMed] [Google Scholar]
- 11.Mathé J., Aksimentiev A., Meller A. Orientation discrimination of single-stranded DNA inside the α-hemolysin membrane channel. Proc. Natl. Acad. Sci. USA. 2005;102:12377–12382. doi: 10.1073/pnas.0502947102. [DOI] [PMC free article] [PubMed] [Google Scholar]
- 12.Wells D.B., Abramkina V., Aksimentiev A. Exploring transmembrane transport through α-hemolysin with grid-steered molecular dynamics. J. Chem. Phys. 2007;127:125101–125110. doi: 10.1063/1.2770738. [DOI] [PMC free article] [PubMed] [Google Scholar]
- 13.Purnell R.F., Mehta K.K., Schmidt J.J. Nucleotide identification and orientation discrimination of DNA homopolymers immobilized in a protein nanopore. Nano Lett. 2008;8:3029–3034. doi: 10.1021/nl802312f. [DOI] [PubMed] [Google Scholar]
- 14.Butler T.Z., Gundlach J.H., Troll M.A. Determination of RNA orientation during translocation through a biological nanopore. Biophys. J. 2006;90:190–199. doi: 10.1529/biophysj.105.068957. [DOI] [PMC free article] [PubMed] [Google Scholar]
- 15.Hornblower B., Coombs A., Akeson M. Single-molecule analysis of DNA-protein complexes using nanopores. Nat. Methods. 2007;4:315–317. doi: 10.1038/nmeth1021. [DOI] [PubMed] [Google Scholar]
- 16.Zhao Q., Sigalov G., Timp G. Detecting SNPs using a synthetic nanopore. Nano Lett. 2007;7:1680–1685. doi: 10.1021/nl070668c. [DOI] [PMC free article] [PubMed] [Google Scholar]
- 17.Cockroft S.L., Chu J., Ghadiri M.R. A single-molecule nanopore device detects DNA polymerase activity with single-nucleotide resolution. J. Am. Chem. Soc. 2008;23:818–820. doi: 10.1021/ja077082c. [DOI] [PMC free article] [PubMed] [Google Scholar]
- 18.Mathé J., Visram H., Meller A. Nanopore unzipping of individual DNA hairpin molecules. Biophys. J. 2004;87:3205–3212. doi: 10.1529/biophysj.104.047274. [DOI] [PMC free article] [PubMed] [Google Scholar]
- 19.Sutherland T.C., Dinsmore M.J., Lee J.S. An analysis of mismatched duplex DNA unzipping through a bacterial nanopore. Biochem. Cell Biol. 2004;82:407–412. doi: 10.1139/o04-005. [DOI] [PubMed] [Google Scholar]
- 20.Sauer-Budge A.F., Nyamwanda J.A., Branton D. Unzipping kinetics of double-stranded DNA in a nanopore. Phys. Rev. Lett. 2003;90:238101–238104. doi: 10.1103/PhysRevLett.90.238101. [DOI] [PubMed] [Google Scholar]
- 21.Viasnoff V., Chiaruttini N., Bockelmann U. Probing DNA base pairing energy profiles using a nanopore. Eur. Biophys. J. 2009;38:263–269. doi: 10.1007/s00249-008-0372-2. [DOI] [PubMed] [Google Scholar]
- 22.Bundschuh R., Gerland U. Coupled dynamics of RNA folding and nanopore translocation. Phys. Rev. Lett. 2005;95 doi: 10.1103/PhysRevLett.95.208104. 208104–4. [DOI] [PubMed] [Google Scholar]
- 23.Isambert H. Voltage-addressable nanomemories in DNA? C. R. Phys. 2002;3:391–396. [Google Scholar]
- 24.Zhao Q., Comer J., Timp G. Stretching and unzipping nucleic acid hairpins using a synthetic nanopore. Nucleic Acids Res. 2008;36:1532–1541. doi: 10.1093/nar/gkm1017. [DOI] [PMC free article] [PubMed] [Google Scholar]
- 25.McNally B., Wanunu M., Meller A. Electromechanical unzipping of individual DNA molecules using synthetic sub-2 nm pores. Nano Lett. 2008;8:3418–3422. doi: 10.1021/nl802218f. [DOI] [PMC free article] [PubMed] [Google Scholar]
- 26.Storm A.J., Chen J.H., Dekker C. Electron-beam-induced deformations of SiO2 nanostructures. J. Appl. Phys. 2005;98 014307-1–8. [Google Scholar]
- 27.Heng J.B., Ho C., Timp G. Sizing DNA using a nanometer-diameter pore. Biophys. J. 2004;87:2905–2911. doi: 10.1529/biophysj.104.041814. [DOI] [PMC free article] [PubMed] [Google Scholar]
- 28.Wanunu M., Sutin J., Meller A. DNA translocation governed by interactions with solid-state nanopores. Biophys. J. 2008;95:4716–4725. doi: 10.1529/biophysj.108.140475. [DOI] [PMC free article] [PubMed] [Google Scholar]
- 29.Song L.Z., Hobaugh M.R., Gouaux J.E. Structure of staphylococcal α-hemolysin, a heptameric transmembrane pore. Science. 1996;274:1859–1866. doi: 10.1126/science.274.5294.1859. [DOI] [PubMed] [Google Scholar]
- 30.Parker M.W., Buckley J.T., Tsernoglou D. Structure of the Aeromonas toxin proaerolysin in its water-soluble and membrane-channel states. Nature. 1994;367:292–295. doi: 10.1038/367292a0. [DOI] [PubMed] [Google Scholar]
- 31.Faller M., Niederweis M., Schulz G.E. The structure of a mycobacterial outer-membrane channel. Science. 2004;303:1189–1192. doi: 10.1126/science.1094114. [DOI] [PubMed] [Google Scholar]
- 32.Butler T.Z., Pavlenok M., Gundlach J.H. Single-molecule DNA detection with an engineered MspA protein nanopore. Proc. Natl. Acad. Sci. USA. 2008;105:20647–20652. doi: 10.1073/pnas.0807514106. [DOI] [PMC free article] [PubMed] [Google Scholar]
- 33.Haran G. Noise reduction in single-molecule fluorescence trajectories of folding proteins. Chem. Phys. 2004;307:137–145. [Google Scholar]
- 34.Lubensky D.K., Nelson D.R. Driven polymer translocation through a narrow pore. Biophys. J. 1999;77:1824–1838. doi: 10.1016/S0006-3495(99)77027-X. [DOI] [PMC free article] [PubMed] [Google Scholar]
- 35.Henrickson S.E., Misakian M., Kasianowicz J.J. Driven DNA transport into an asymmetric nanometer-scale pore. Phys. Rev. Lett. 2000;85:3057–3060. doi: 10.1103/PhysRevLett.85.3057. [DOI] [PubMed] [Google Scholar]
- 36.Gibrat G., Pastoriza-Gallego M., Pelta J. Polyelectrolyte entry and transport through an asymmetric α-hemolysin channel. J. Phys. Chem. B. 2008;112:14687–14691. doi: 10.1021/jp808088y. [DOI] [PubMed] [Google Scholar]
- 37.Reference deleted in proof.
- 38.Tropini C., Marziali A. Multi-nanopore force spectroscopy for DNA analysis. Biophys. J. 2007;92:1632–1637. doi: 10.1529/biophysj.106.094060. [DOI] [PMC free article] [PubMed] [Google Scholar]
- 39.Reference deleted in proof.
- 40.Clarke J., Wu H.C., Bayley H. Continuous base identification for single-molecule nanopore DNA sequencing. Nat. Nanotechnol. 2009;4:265–270. doi: 10.1038/nnano.2009.12. [DOI] [PubMed] [Google Scholar]
- 41.Butler T.Z., Gundlach J.H., Troll M. Ionic current blockades from DNA and RNA molecules in the α-hemolysin nanopore. Biophys. J. 2007;93:3229–3240. doi: 10.1529/biophysj.107.107003. [DOI] [PMC free article] [PubMed] [Google Scholar]
- 42.Storm A.J., Chen J.H., Dekker C. Translocation of double-strand DNA through a silicon oxide nanopore. Phys. Rev. E Stat. Nonlin. Soft Matter Phys. 2005;71:051903–051910. doi: 10.1103/PhysRevE.71.051903. [DOI] [PubMed] [Google Scholar]
- 43.Vercoutere W.A., Winters-Hilt S., Akeson M. Discrimination among individual Watson-Crick base pairs at the termini of single DNA hairpin molecules. Nucleic Acids Res. 2003;31:1311–1318. doi: 10.1093/nar/gkg218. [DOI] [PMC free article] [PubMed] [Google Scholar]
- 44.Winters-Hilt S. The α-hemolysin nanopore transduction detector—single-molecule binding studies and immunological screening of antibodies and aptamers. BMC Bioinformatics. 2007;8(Suppl 7):S9. doi: 10.1186/1471-2105-8-S7-S9. [DOI] [PMC free article] [PubMed] [Google Scholar]
- 45.Comer J., Dimitrov V., Aksimentiev A. Microscopic mechanics of hairpin DNA translocation through synthetic nanopores. Biophys. J. 2009;96:593–608. doi: 10.1016/j.bpj.2008.09.023. [DOI] [PMC free article] [PubMed] [Google Scholar]
Associated Data
This section collects any data citations, data availability statements, or supplementary materials included in this article.