

Abstract
Occupancy of new habitats through dispersion is a central process in nature. In particular, long-distance dispersal is involved in the spread of species and epidemics, although it has not been previously related with cancer invasion, a process that involves cell spreading to tissues far away from the primary tumour.
Using simulations and real data we show that the early spread of cancer cells is similar to the species individuals spread and we suggest that both processes are represented by a common spatio-temporal signature of long-distance dispersal and subsequent local proliferation. This signature is characterized by a particular fractal geometry of the boundaries of patches generated, and a power-law scaled, disrupted patch size distribution. In contrast, invasions involving only dispersal but not subsequent proliferation (“physiological invasions”) like trophoblast cells invasion during normal human placentation did not show the patch size power-law pattern. Our results are consistent under different temporal and spatial scales, and under different resolution levels of analysis.
We conclude that the scaling properties are a hallmark and a direct result of long-distance dispersal and proliferation, and that they could reflect homologous ecological processes of population self-organization during cancer and species spread. Our results are significant for the detection of processes involving long-range dispersal and proliferation like cancer local invasion and metastasis, biological invasions and epidemics, and for the formulation of new cancer therapeutical approaches.
Keywords: Long-range dispersal, Cancer and species invasion, Complex systems, Self-organization, Power-law scaling
1. Introduction
Long-distance dispersal (LDD) (Kot et al., 1996), even if represented by rare events, is one of the main factors explaining the fast spread of different organisms in new habitats, for example in paleocolonization events (Petit et al., 1997), plant pathogens (Brown and Hovmoller, 2002), and invasive species (Gilbert et al., 2004). In addition, considering cancer as an ecological process (Merlo et al., 2006) spread from primary tumours can be thought as a biological invasion from cancer cells spreading and invading new tissues. Colonization begins with a single or few cells previously dispersed from the primary tumour (Talmadge et al., 1982), originating different clone lines that evolve independently across the new tissues and organs invaded (Nowell, 1976) in a process we can consider as LDD. In spite of its remarkable similarity with species spread, at present no detailed mechanism has been proposed for an ecological interpretation of cancer spread. Both cancer and species invasion can be viewed as being basically the same process of dispersion followed by local proliferation of dispersed propagules (either cells or species individuals) into new environments, despite the different mechanisms acting in each case.
Previous works by several authors have shown that simulated spatial patterns of spread of species with LDD differed from the case when short-distance dispersal (SDD) alone was involved (Shaw, 1995; Xu and Ridout, 1998; Higgins et al., 1996; Clark et al., 2001; Filipe and Maule, 2004; Gilbert et al., 2004). Still, translating the properties of a given pattern into ecologically meaning processes and mechanisms can be intricate. However, Ecology and other related disciplines like Epidemiology have benefited from pattern interpretation using different tools both for forecasting and understanding. In this paper we pursue a step further to characterize in detail the spatial and temporal spread generated by LDD by simulations, corroborating results with patterns from real data, and analysing the simulated and real spatial patterns obtained together in view of the particular model dynamical rules. Since the modelling approach followed is mechanistic, looking closely into the model structure allows for an ecological and biological meaning interpretation of the simulation generated patterns and a more confident understanding of real spatial patterns.
Fat-tailed functions like the power law seem to adequately describe LDD (Kot et al., 1996), and evidence for this is coming from crop pathogens distributions determined experimentally (Gibson, 1997) and from model simulations (Cannas et al., 2006; Shaw 1995). Power-law functions and fractal geometry characterize species dispersal by LDD (Cannas et al., 2006; Wingen et al., 2007), and they reflect the invariance of some property over a range of temporal and spatial scales. There is increasing consensus in that they can be a byproduct of self-organizing processes of populations and communities (Sutherland and Jacobs, 1994; Pascual et al., 2002; Scanlon et al., 2007). The capacity of a system to evolve to an organized state due to intrinsic mechanisms, i.e., self-organization, often characterized by a scale-free geometry, has been attributed to diverse natural phenomena (Mandelbrot, 1982). However, the fundamental dynamics that determine self-organization scaling properties have remained obscure in most cases. Performing independent simulations we show that the pattern properties we found in real data from cancer invasion and species spread are consistent with long-range dispersal mediated by a fat-tailed distribution function such as power-law and subsequent local proliferation.
We performed simulations using a spatially explicit, individual-based model based on a cellular automaton originally developed for the study of biological invasions (Marco et al., 2002; Cannas et al., 2003). We simulated long-range dispersal mechanisms using a power-law dispersal function (Cannas et al., 2006). The main difference between our distribution function and other approaches to model LDD using two normal combined functions (Ibrahim et al., 1996; Le Corre et al., 1997; Bullock and Clarke, 2000) is that the power law, depending on the alpha value, has at least one infinite momentum allowing for unlimited range dispersal over the entire field, i.e., there can be no characteristic dispersal distance. This is drastically different with respect to the use of distribution functions allowing only SDD, where dispersion can reach just close areas to the initial focus (Cannas et al., 2003, 2006). The power-law function also allows for the inclusion of local and LDD events in the same dispersal function, depending on the value of the α exponent (Cannas et al., 2006). The main biological significance of the inclusion of the power law in the model is that dispersion is allowed to reach the whole area considered without distance limits from the very beginning of the simulations, since the first individual becomes reproductive. To characterize the spatial pattern of spread produced by the simulations, we calculated the mean fractal dimension of patches using a box-counting algorithm (Halley et al., 2004), and determined the patch size distribution. We explored the pattern of spread produced by the model to understand the observed patterns of spread of cells from invasive human glioma and of a tree species (Ulmus minor Mill.). From previously published experiments, we analysed the in vivo spread of human glioma cells established by intracranial cross-species transplantations in the brain of mice (Hu et al., 2003) and the in vitro spread of human glioma cells on Matrigel coat (Johnston et al., 2007). We recorded the spread of U. minor into a native forest from an initial small focus using aerial photographs in Central Argentina, where it is a common invasive species. Fruits of U. minor are dispersed by wind (usually assumed to be a LDD mechanism) in high numbers but many seeds remain near the parent providing also local recruitment.
We also tested a result previously predicted from our simulations (Cannas et al., 2006), when LDD dispersal is not followed by local proliferation of dispersed individuals but only the founder parent is allowed to reproduce. This case produces a fractal patch border but not the typical two-scale power-law pattern of patch size distribution found when local recruitment is present (Cannas et al., 2006). A typical biological example of this process of migration but not subsequent proliferation is the normal process of embryonic trophoblast cells invasion of maternal uterine tissues during human placentation. This process has been called “physiological” or “pseudo-malignant” invasion (Even-Ram et al., 1998; Ferretti et al., 2007), since although it shares many properties of cancer processes, it is tightly regulated by endogenous cell programmes and by the maternal environment not allowing for further proliferation after dispersal. Further trophoblast proliferation after migration results in trophoblastic diseases like choriocarcinoma, a placental cancer (Ferretti et al., 2007). We analysed the invasion of trophoblasts in normal human placentation (Goffin et al., 2003; Ferretti et al., 2007) and on Matrigel coat (Pollheimer and Knöfler, 2005).
In this paper we show that the spread of cells in cancer invasion and of invasive species generates a similar patchy pattern characterized by fractal and power-law scaling. Furthermore, we suggest that this common pattern originates from self-organized, homologous mechanisms driven by LDD and subsequent proliferation. We also show that this hallmark is not present in normal, highly regulated “physiological” invasions (Even-Ram et al., 1998) involving only dispersal but not subsequent proliferation, like trophoblast cells invasion during human placentation.
2. Methods
2.1. The model, numerical simulations and spatial pattern analysis
We give a brief account of the model and simulation methods. The simulation software was implemented using standard Fortran 90 language. The model was originally built to study biological invasions, and more details are given in Cannas et al. (2003) and Cannas et al. (2006). The model is embedded on a square grid containing Lx × Ly square cells (to avoid confusion with cancer cells, hereafter, sites), representing the field. For a single species the model associates to every site i in the grid a discrete variable ai(t) which encodes the age of an individual located at it at time t; ai = 0 corresponds to an empty site (Cannas et al., 2003). The index i encodes a pair of discrete coordinates (x; y), with x = 1, 2, …, Lx, y = 1, 2, …, Ly. The grid parameter (i.e., the distance between neighbouring sites) equals one. The spatial length scale is chosen so that each site contains at most one adult individual. The dynamical variables are updated according to a parallel dynamics, that is, the value of all variables at a given (discrete) time t depends on the value of the variables at time t–1. The time scale is chosen to coincide with the minimal reproductive interval in the life history of the invader. Life history traits included are: q, reproductive survival probability, tm, age of reproductive maturity, m, mean propagule production (propagules/individual), and Ps, prereproductive survival probability.
An occupied site ai(t) ≠ 0 is updated according to the following rule:
where q is the reproductive survival probability. Now consider an empty site i at time t−1, that is, ai(t−1) = 0. The site will be colonized at time t, that is, ai(t) = 1 with a probability pi(t) given by
| (1) |
where si(t) is the number of propagules received by site i at time t; pi(t) the probability that at least one propagule survives to the reproductive stage. si is obtained by counting the propagules received by site i coming from the rest of the sites. Propagule dispersion of an individual is assumed isotropic and it is described by some density function f(r), where is the distance to the parental individual. The function f(r) describes the fraction of the total number of propagules produced by a single individual that is dispersed per area unit to a distance r; f(r) is assumed to be normalized in the whole plane. The number of propagules received by a site j coming from an individual located at a site i is then given by mf(rij) where rij is the distance between the centre of sites i and j. Then si is obtained by summing mf(rij) over all sites j containing a reproductive individual.
Let us now analyse the dispersal distribution function f(r). The difference between short and long-range dispersal is related to whether the distribution f(r) has an exponentially bounded tail or not (Kot et al., 1996). In a very general sense this means that the distribution is short ranged if the moments ∫ rnf(r) da are finite for every value of n ≥ 0, where the integral extends over the infinite plane; otherwise, it is long ranged (Kot et al., 1996). An example of short ranged dispersal is given by the negative exponential function
where d = ∫ rnf(r) da is the mean dispersal distance. This function has been shown to appropriately describe the dynamics when the species have short ranged dispersal strategies (Marco et al., 2002). We simulated long-range dispersal mechanisms using a power-law function:
where A is a normalization constant and α>2 (otherwise the density function f cannot be normalized). According to the values of α, when 3<α≤4 the first moment (the mean) remains finite but the second moment (the variance) becomes infinite. The mean dispersal distance is given by d≡<r< = (α−2)/2 (α−3). When 2<α≤3 both first and second moments are infinite, and thus the mean dispersal distance is not defined. Finally, for α>4 both the first and the second moments of the distribution are finite. In this case, even when the distribution is strictly long ranged, it can be well approximated by a normal distribution on finite spatial scales. Hence, no qualitative differences are expected in the global spatial pattern of spread between this last case and the short ranged one. Several results from other physical systems with long-range interactions support this assumption (Cannas, 1998; Gleiser et al., 2000, 2001).
The main biological significance of the inclusion of the power law is that dispersion from a given focus is allowed to reach with finite probability any point of the whole area considered, even when the mean dispersal is finite (see Methods) and much smaller than the area size. This is drastically different with respect to the use of distribution functions allowing only SDD, where the probability of dispersion far away (compared with the mean dispersal distance) to the initial focus is completely negligible. In this way, we avoid difficulties in defining LDD (Nathan, 2005) by simply allowing for no limited dispersal, depending on the value of the α exponent. Although the utilization of distribution functions with infinite tails (such as the power law) has been criticized, there is evidence from different air-borne organisms supporting it (Kot et al., 1996).
Simulations began with a single mature individual located at the centre of a square area. At a fixed time occupied sites are assigned to patches by giving them a label, representing their corresponding patch number. When an unlabelled occupied site is found, the algorithm creates a new patch by assigning a new label to the current site and to all the connected set of occupied sites associated to it. For each site currently in the cluster all the occupied sites in the set of eight closest sites are assigned to the same patch. The algorithm continues recursively until no more sites are added to the current patch. The procedure is repeated until no unlabelled occupied sites are left. A patch is then defined as a label that contains more than one site. The border set of a given patch is defined as the list of all the occupied sites lying at its border. Spatial pattern analysis of species spread is based on the statistics of patches of occupied sites and their borders. For calculating the fractal dimension, we plotted the number of boxes N(l) of linear size l as a function of l; the fractal dimension is defined as N(l) ∝ lD. We fitted the curve using the least square method, and D is the slope value with changed sign. We calculated the mean fractal dimension DP of patches (excluding the main patch) as a function of time, where the averages were taken at fixed times over several simulation runs, and the mean fractal dimension DB of the patch borders. Patch size is defined by the number of sites in each patch. We calculated the relative frequency histogram P(s) of patches with size s (excluding the main patch), in an area of 1024 × 1024 sites at a stationary stage but at a time when less than 50% of the sites were occupied. We determined this by tracking the density of occupied sites as a function of the simulation time. After this time most of the simulation area is very soon completely covered (Cannas et al., 2006). We also calculated P(s) of patches with size s with reproduction restricted to the founder parent (i.e., no local proliferation after LDD outside the original patch). The results for P(s) are averaged for every value of s and every time step in a sample of M independent runs, M being between 100 and 200. β values given are the slopes of the power laws.
2.2. Cancer invasion data
Invasion of cancer cells is an active process that involves the attachment of invading tumour cells to the extracellular matrix and its disruption, and subsequent invading cell penetration into tissues surrounding the primary tumour. This process is mediated by tumour-secreted enzymes called matrix metalloproteases (MMPs) that degrade the extracellular matrix at tumour-invasive borders and invasive areas (Hu et al., 2003, Kaufman et al., 2005). The first moments of invasion are beginning to be described using imaging techniques like confocal microscopic detection of marked individual cells. In vivo, cancer cells can move at high speeds (up to 15 μm a minute), showing a complex process involving the acquisition of motility by tumour cells, driven by cycles of actin polymerization, cell adhesion to the collagen fibres of the extracellular matrix and acto-myosin contraction (Sahai, 2007).
Human glioma invasion in the brain of animals were determined as described previously (Hu et al., 2003), engineered to express an angiogenic regulator, angiopoietin-2 (Ang2) (U87MG/Ang2 cells), capable of promoting glioma cell infiltration into the brain parenchyma. Briefly, U87MG Ang2-expressing cell clones (5 × 10⁵) were stereotactically implanted into individual nude mouse brains with 5 mice per group. When mice developed neurological symptoms due to disturbance of their central nervous system, mice were sacrificed and their brains were removed, processed and analysed. The distance of invading glioma cells from tumour masses were assessed by capturing serial images of hematoxylin/eosin-stained brain sections using a Olympus BX51 (Melville, NY) microscope equipped with a SPOT digital camera (Diagnostic Instruments, Inc., Sterling height, MI) and calculated by the fact that under a 100 × magnification, one frame is equal to 1 mm long. Photographs were digitized and interpreted using image processor software, identifying cells at an individual level. In all cases, using standard image processor software we detected clusters by applying the adequate threshold values to ensure a minimum of 95% individual cells detection. Number and area covered for invasive cell clusters generated from the primary tumour were calculated and the fractal dimension of patch borders was calculated following the box-counting method using square boxes of sides equivalent to 10 μm spanning to 200 μm. Images from human glioma cells cultivated on Matrigel coats (Johnston et al., 2007) were analysed as above.
2.3. Trophoblast cells invasion
The process of normal human placentation begins when cells derived of the morula's trophodectoderm, the trophoblasts, proliferate and then differentiate and migrate to invade the uterine wall. Trophoblast proliferation is restricted to an early stage in the cell columns attached to the uterine wall, and as cells migrate further into the maternal tissues differentiate and lose the ability to divide (Ferretti et al., 2007). In trophoblast invasion, like in cancer invasion, cell migration is not passive but rather an active process mediated by extracellular matrix proteases (Ferretti et al., 2007). Images of normal invasive trophoblasts during early human placentation (cells stained with 4′,6-diamidino-2-pheny-lindole (DAPI) and examined with a fluorescence microscope (Goffin et al., 2003), and using immunohistochemical staining with antibody to cytokeratin 07 (Ferretti et al. 2007) were interpreted using image processor software, identifying cells at an individual level. Also, images from trophoblasts cultivated on Matrigel coats immunohistochemically stained with specific antibodies and photographed under the fluorescence microscope (Pollheimer and Knöfler, 2005) were used. In all cases, using standard image processor software we detected clusters by applying the adequate threshold values to ensure a minimum of 95% individual cells detection. Number and area covered for invasive cell clusters generated from the trophoblast invasion were calculated and the fractal dimension of patches (excluding the primary tumour) and the fractal dimension of patch borders were calculated following the box-counting method using square boxes of side equivalent to 10 μm spanning to 200 μm.
2.4. Field species data
We studied the spatial pattern of spread of U. minor using aerial photographs from a forest area of 7 ha located in a low mountain region of central Argentina. Native forest has been invaded by non-native, competing trees like U. minor, Glossy privet (Ligustrum lucidum) and Honeylocust (Gleditsia triacanthos) (Marco et al., 2002). U. minor is a European tree introduced as ornamental species in the region around the mid-20th century. Reproduction is by seeds, beginning when the individual is between 7 and 10 years old. We found no evidence of vegetative reproduction in the field. Individuals bear hermaphrodite flowers. The winged fruits are released in high numbers and dispersed by wind. Many seeds are dispersed by wind but there is a considerable amount that remains near the parent. After dispersal, they are carried by rain water and tend to accumulate in lower sites. Black and white photographs were taken in 1970 (1:5000), 1987 (1:20 000), and 1996 (1:5000). The 7 ha surveyed comprise a whole hillside of low slope. Photographs allowed us to identify trees at an individual level. Trees distribution was checked using a stereoscope to screen the aerial photographs, detected trees checked in the field, and patches finally drawn on scanned photographs using standard processor images. Photographs edges were not used in the interpretation to avoid image distortion. An estimation of error in the photograph interpretation was made by identifying individual trees in the photograph and then checking if they were correctly assigned to the species. In 97% of cases assignments were correct. In 1970 there were only two near patches of few trees planted, considered as the first dispersal focus in the studied area. Number and area covered of patches generated from the first focus were calculated for 1987 and 1996, and the fractal patch dimension (excluding the main patch) and the fractal dimension of patch borders were calculated following the box-counting method using square boxes of side equivalent to 5 m spanning to 150 m.
3. Results
3.1. Patterns of spread of cancer cells and species individuals
The analysis of pattern generation process with LDD during the simulations allows understanding its mechanism (Fig. 1a, Movie S1 in Supplementary Material), which is essentially different from SDD mechanism. In the SDD case the spatial spread produces a circular compact patch with a defined invasion front of rough border, surrounded by a few isolated individuals and very small patches (Movie S2, Cannas et al., 2003, 2006). A numerical calculation of the average radius of the main patch (and hence the invasion front) shows that it increases at constant velocity (Cannas et al., 2003, 2006).
Fig. 1.

(a) Spatial patterns of spread with long-distance dispersal from simulations and cancer and species spread. Simulation spread from an individual in an area with 320 × 320 sites after 9 years from first reproductive time. Reproductive (black dots) and immature (grey dots) individuals are shown. Power-law LDD with α = 3.11. (b) Spatial spread of human invasive glioma in (black areas) in mouse brain (white ground) (from Hu et al. 2003). (c) Spatial spread of U. minor (black areas) surrounded by a mixed forest of other invasive and native species (white ground).
In LDD, beginning with an initially reproductive individual, a single patch appears surrounded by isolated, immature individuals (green dots, Movie S1) scattered all over the field. At times longer than the time of first reproduction, some of the scattered individuals begin reproduction (black dots, Movie S1), and secondary foci initiate growth into patches showing the same structure as the initial patch. While patches of higher order generation continue arising and growing, the first patch itself continues growing by local recruitment and absorbing the nearest patches. At later invasion times, this coalescence of similar patches originates a fractal border in the initial patch and importantly, it accounts for sudden increments in patch area. The same process of patch growth and coalescence occurs in other patches distant from the main patch. There is no clearly defined invasion front (Movie S1; Fig. 1a), and the spatial extent of the population grows exponentially (Movie S1). To address the effects of interaction on the LDD pattern generation, we performed simulations beginning with the field occupied to 20% by a long-lived resident species dispersing by a SDD exponential function. The invader spread by LDD with α = 2.5 and tm = 3. The pattern generated (Fig. S1 in Supplementary Material) was qualitatively similar to the case without interaction.
In agreement with the simulations results, spread of the invasive, Ang2-expressing gliomas displayed irregular borders with spike-like structures that invaded into the normal brain structures (Fig. 1b), in contrast with the non-invasive control tumours showing smooth, clean borders (Hu et al., 2003) that clearly resemble the SDD process (Cannas et al., 2006, Movie S2). Glioma cells migrated far away from the initial tumour and formed groups of individual tumour clusters that localized at 2.5–4.3 mm from the tumour mass in various invasive tumours, resembling the simulated patterns. Although it is not possible to image cell spreading in the brain tissue of mice in the in vivo model at sequential times, in vitro assays assessing the invasiveness of various glioma cells through membranes coated with Matrigel showed that U87MG/Ang2 cells had a 4-fold exponential increase in invaded area compared with the parental U87MG noninvasive cells in the same period (Hu et al., 2003). In another example, in vitro glioma cells showed the same spatial pattern of invasion with about eight-fold increase of covered areas after 24 h (Kaufman et al., 2005).
The spatial pattern of spread of U. minor from aerial photographs (Fig. 1c) resembled closely the pattern obtained by simulations and glioma spread (Fig. 1a, b). The temporal and spatial patterns of patch generation from the initial focus composed by a small patch present in 1970 explain the resulting similarities (Fig. S2). The number of patches initially grew exponentially and then slowed down. In 1987, about 74 new patches covered a small fraction of the area and were mainly represented by individual trees scattered through the 7 ha forest area. The increase in covered area was also exponential although faster and continued, with 189 patches present 10 years later. The faster and sudden increments in the area growth rate (9-fold between 1987 and 1970, and 5-fold between 1996 and 1987) reveals that after a certain time, few new patches are generated but the increase in area is mainly due to patch growth and coalescence, as occurred in the simulations (Movie S1).
Comparing the pattern generation in simulations, cancer and U. minor invasion, we see that the three processes share common features, namely the fast and early occupancy of an extended area around the primary focus of dispersion, and the subsequent generation of similar patches far away by local proliferation.
3.2. Scale-free geometry of cancer and species spread
The fractal dimension of patches, DP, from simulations showed a continuous increase over time (Fig. 2). This is due to the fast habitat occupation in general but mainly of the area close to the main patch where secondary patches coalesce at early times. The curve is characterized by periodic leaps matching the age of reproductive maturity. The reproductive waves every 7 years produce the periodic increments, when young individuals begin producing offspring. DP values for the xenografted human glioma invasion from Hu et al. (2003) and of U. minor field cover from the digitized aerial images taken in 1996 were 1.20 (R2 = 0.99, n = 8) and 1.30 (R2 = 0.93, n = 9), respectively (Fig. 3a, b). These values should be taken with caution since they represent a DP value in a particular time.
Fig. 2.
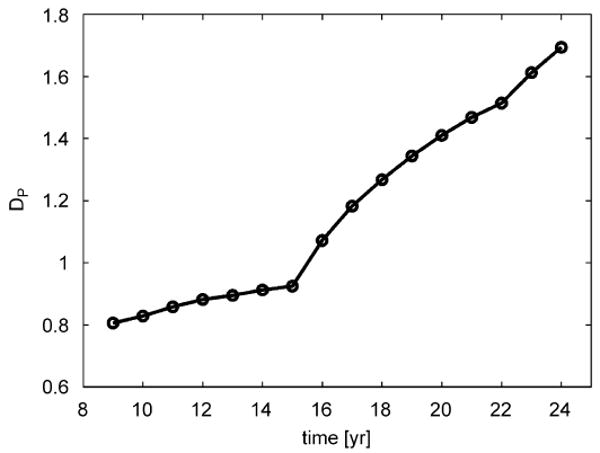
Fractal dimension DP of patches vs. time from simulations. Simulations performed in a 1024 × 1024 area, with tm = 7, α = 3.33. The main simulation patch was excluded from the calculation.
Fig. 3.

Fractal dimension DP of patches: (a) glioma spreading in brain tissue (primary tumour excluded, spatial scale in μm) and (b) invasive tree Ulmus minor spreading in native forest (main patch excluded, spatial scale in m).
We had previously found that the fractal dimension DB of patch borders from simulations as a function of α varied between 1.6 and 1.8 for 2< α≤3 (mean and variance not defined), and it decreased monotonically for 3< α≤4 (mean defined but variance not defined) (Cannas et al., 2006). Here we show two representative DB fits from simulations with tm = 3 and α = 2.5, and α = 3, with DB = 1.86 (R2 = 0.93, n = 8) and DB = 1.61 (R2 = 0.98, n = 8), respectively (Fig. 4a). These DB values are consistent with power law 2< α≤3.
Fig. 4.

Fractal dimension DB of patch borders. Main simulation patch for tm = 3, α = 2.5 (circles) and α = 3.33 (squares) (a), glioma primary tumour spreading in brain tissue (spatial scale in μm) (b), and main patch of invasive tree Ulmus minor in native forest (spatial scale in m) (c).
The fractal dimension of main tumour border calculated from the xenografted human glioma invasion from Hu et al. (2003) was DB = 1.30 (R2 = 0.99, n = 16) (Fig. 4b), in agreement with several experimental examples from primary invasive and metastatic tumours from Brú et al. (1998, 2003). This value is consistent again with power law 3< α≤4 indicating LDD with mean dispersal distance defined (Cannas et al., 2006). This is in agreement with the mechanism of glioma cells dispersion, requiring the action of MMPs disintegrating the surrounding extracellular matrix to allow for cell migration through the invaded tissue. This process would set some constraints to the unrestricted LDD allowed by the power-law function. The DB value for the invasion of glioma cells through Matrigel coat from (Johnston et al., 2007) was lower, DB = 1.20 (R2 = 0.99, n = 9). In contrast, and as we expected for a SDD growing process (Cannas et al., 2006), a non-invasive tumour presents a smooth, non-fractal border. We determined DB from the not invasive tumour shown in Hu et al., (2003, Fig. 3). We determined DB = 0.93, indicating a not fractal object (for a fractal curve 1<D≤2).
We calculated the fractal dimension DB of patch borders from the digitized aerial images of U. minor field cover in 1996. For the main field patch we found DB = 1.88 (R2 = 0.93, n = 9) (Fig. 4c). Several of the remaining biggest patches showed DB values ranged between 1.40 and 1.75 (R2 between 0.95 and 0.99, n = 10 in all cases). These values are consistent with predicted power-law α exponents for LDD distribution functions (Cannas et al., 2006). In particular, DB = 1.88 would correspond to 2< α≤3, with not defined mean dispersal distance (Cannas et al., 2006). An infinite mean in the basic interactions has been observed in diverse systems, and usually implies mean field like behaviour (Cannas, 1998; Gleiser et al., 2000, 2001). This indicates that the exponents of the emergent scale-free properties (for instance, DB) of the system are mainly determined by the interactions of each individual with an average environment. Systems showing mean field behaviour present a high degree of universality, that is, it is expected that most of the global properties will not depend on field details, such as habitat heterogeneity. This seems to be the case for the U. minor spread, since wind dispersion ensures seeds reaching the whole area available as an extreme case of LDD.
Trophoblast cells invasion also showed a not defined invasion front with finger-like structures and patches invading the maternal tissue (Fig. 5). For the in vivo example from Goffin et al. (2003), DP was 1.14 (R2 = 0.97, n = 12). The trofoblast cells invasion also showed a fractal patch border, with DB = 1.33 for both patterns from Ferretti et al. (2007) (R2 = 0.97, n = 8), and Goffin et al. (2003) (R2 = 0.99, n = 11). Both DB values correspond to normally invaded uterine tissue. DB value for invasion through Matrigel coat from Pollheimer and Knöfler (2005) was lower, DB = 1.15 (R2 = 0.98, n = 8).
Fig. 5.

Spatial spread of normal invasive trophoblasts during human placentation. Spatial spread of invasive trophoblasts (black areas) through uterine tissue (white ground) from Goffin et al. (2003). Trophoblast proliferation is restricted to an early stage in the cell columns attached to the uterine wall, and as cells begin migration into the maternal tissues differentiate and lose the ability to divide.
Thus, the fractal DB value of the patch borders generated by LDD can provide information about the degree of constraint of global dispersal (mean dispersal distance defined or not). The lower DB values found for the glioma and trophoblast invasion through the Matrigel coat could reflect the fact that fractal values in vitro are determined on two-dimensional (2D) structures while in vivo the structures develop in three dimensions. Similarly, lower fractal values for borders of tumours growing in vitro compared with tumours in vivo of the same cell line (1.12 and 1.30, respectively) were reported (Brú et al., 2003). Although D values can differ between three-dimensional (3D) and 2D objects, extrapolating results from 2D projection images to 3D structures is a common approach used in several fields, from mineralogy to medicine (see for example, Jennane et al., 2007).
To further characterize the spatial pattern we calculated the patch size distribution P(s) excluding the initial patch from the simulations with LDD. Patch size is calculated as the number of sites in each patch. P(s) showed a disrupted distribution characterized by two different power laws P(s)∼s−β at small and large patch areas s separated by a crossover region (Fig. 6a). β value in the small patch areas was 3.37 (R2 = 0.98), while in the large patch areas was 2.24 (R2 > 0.98). Simulations using different values of α produced P(s) curves with similar characteristics (not shown). Tracking individuals in the simulations we determined that the small area section of P(s) is generated by random dispersal and aggregation of reproductively immature individuals. The large area section corresponds to larger patches generated by reproduction of previously dispersed individuals by LDD forming their own patches by localized dispersal and recruitment, originating a founder effect (Mayr, 1963) of genetically distinct patches, followed by growth and coalescence of neighbouring patches (Movie S1). Large area patches arise only at times greater than first reproduction (Movie S1). The average minimum area of patches generated by a single individual after its first reproductive event, corresponding to localized dispersion and recruitment, is s* = 65 ± 5 sites (ln(s*)≈4.2). These patches, that can be seen in the snapshot from Fig. 1a and Movie S1 as small patches with only one reproductive individual, were located at the beginning of the power law corresponding to large patch areas in the P(s) curve (Fig. 6a). The formation of these patches in a single reproduction event can be understood as a percolation phenomenon. From Eq. (1), the colonization probability at a distance r from the focus is given by pc(r) = 1−(1−Ps)mf(r); this function is almost constant (approximately equal to one) at short distances and decay to zero a large distances. The average radius of the central patch r*(s* = pr*2) is such that the colonization probability falls below the site percolation threshold (0.593 for a square lattice; see Essam, 1980). Then, for a fixed value of m, the obtained expression for s* is a slowly varying function of a in the range 2 < a <4, so that ln(s*) is almost constant in that range. Concerning the dependency with m, s*∼m2/a; for values of m between 103 and 105, ln(s*) varies between 2 and 5. All these behaviours are verified by the numerical simulation results; details of these calculations will be published elsewhere.
Fig. 6.
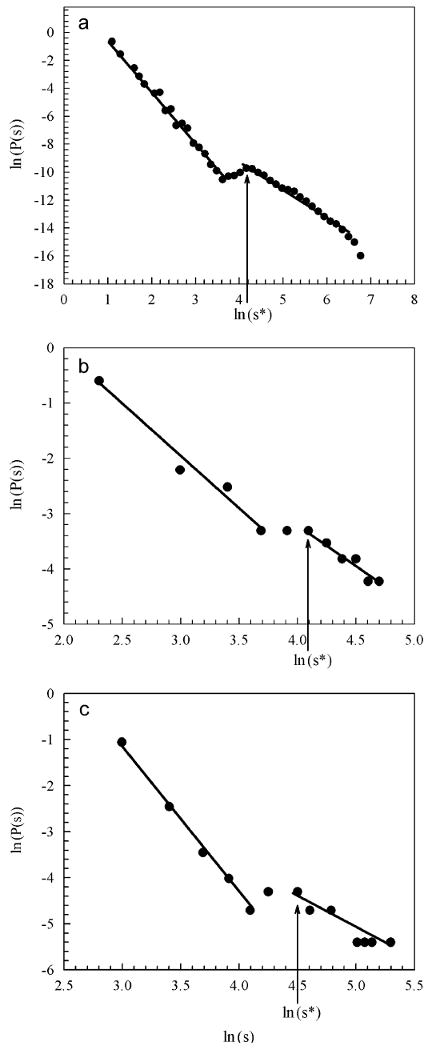
Size distribution of patches P(s) from simulations and cancer and species spread data is characterized by power laws (P(s)∼s−β), corresponding to patches of small and large areas. (a) P(s) for long-distance simulations for α = 3.33…. Standard deviations of the averages are of the order of the symbol size. s is given in number of sites. (b) P(s) for spread of human invasive glioma from Hu et al. (2003); s is given in μm2. (c) P(s) for field spread of U. minor; s is given in m2; β values are given in the text; s* indicates the estimated average minimum size of a patch generated by a single individual by reproduction and localized dispersal.
P(s) obtained for the glioma invasion (Hu et al., 2003) (Fig. 6b) was very similar to the simulated patterns. The small and large area power laws showed β = 1.87 (R2 = 0.97, n = 4), and β = 1.58 (R2 = 0.95, n = 6), respectively. We estimated s* for the glioma as the s value corresponding to the point at the beginning of the second part of the P(s) curve. s* is located around ln(s) = 4, and its value 60 μm2, (ln(s*) = 4.1), is compatible with a cluster of approximately 8 cells, that could indicate the early initiation of a microtumour by localized reproduction from a previously migrated cell. Similarly, P(s) obtained for the glioma invasion through Matrigel coat (Johnston et al., 2007) showed β = 1.59 (R2 = 0.98, n = 3), and β = 1.42 (R2 = 0.92, n = 15), respectively (Fig. S3). s* is located around ln(s) = 4, and its value 40 μm2, (ln(s*) = 3.69), is compatible with a microtumour of approximately 5 cells.
The U. minor field P(s) curve (Fig. 6c) closely resembled the P(s) curves from simulations and glioma invasion. Two power laws appear characterizing the two sections of the curve, with β = 3.27 (R2 = 0.99, n = 109) for the patches with small area and β = 1.48 (R2 = 0.88, n = 11) for patches with large areas. Considering the part of the curve for small areas, the first P(s) point indicates the size cover of individual, probably reproductively immature, trees. The corresponding s value for this point, s = 20 (ln(s = 3)), is lower than the minimum canopy cover of an individual tree at a tm (estimated as 25 m2 from field), and it was checked by tracking the area values for individual trees in the aerial images and in the field. The remaining points in this part of the P(s) curve could correspond either to bigger immature isolated individuals or patches produced from aggregation of seeds after dispersion. We estimated s* for U. minor as the s value corresponding to the point at the beginning of the second part of the P(s) curve, and found s* = 90 m2 (ln(s*) = 4.5) (Fig. 6c). This s* value is 3.6 times higher than the minimum field estimated canopy cover of an individual tree at first reproduction and thus compatible with a young patch originated by reproduction from a patch founder parent, followed by localized dispersal. The scaling pattern of P(s) is remarkable similar to the simulated pattern.
When the probability distribution of patch sizes P(s) is calculated from simulations performed with reproduction restricted to the founder parent (i.e., no local proliferation after LDD dispersal) the small patch area scale power law still appears and ends at around ln(s) = 4, with β = 3.38 (R2 = 0.99, n = 38). However, the large area power law no longer appears (Fig. 7a), since it is a direct effect of local reproduction following LDD dispersal (Cannas et al., 2006). Although the spatial pattern of the trophoblast cells invasion from Pollheimer and Knöfler (2005) (Fig. 5) is apparently similar to glioma spread, its P(s) showed no defined pattern for the large patch area part of the distribution (Fig. 7b), while the small patch area scale power law still appears and ends at around ln(s) = 4, with β = 1.53 (R2 = 0.86, n = 8). In another example, P(s) from in vivo throphoblast uterine invasion from Goffin et al. (2003) showed a similar absence of large patches pattern (Fig. S4). Distribution of higher patch sizes in trophoblast cells invasion only reflects random cell aggregation after migration but no proliferation, and hence no particular patch size arrangement appears for large patch areas.
Fig. 7.

Size distribution of patches P(s) from simulations with no local proliferation after dispersal and trophoblast cells spread data. (a) P(s) calculated from LDD simulations performed with reproduction restricted to the founder parent (i.e., no local proliferation in secondary patches after dispersal), for α = 3.33…. s is given in number of sites. (b) P(s) for in vitro spread of normal invasive trophoblasts from Pollheimer and Knöfler (2005). s is given in μm2.
4. Discussion
The main features of the spatial patterns generated by LDD are the presence of a patchy arrangement of the population, and consequently, the absence of a well-characterized wave front during its spatial expansion (Xu and Ridout, 1998; Filipe and Maule, 2004; Gilbert et al., 2004; Muirhead et al., 2006). Our results agree in general with these and other previous works. However, we specifically characterized in detail the spread generated by LDD, in particular by a power-law dispersal function, and show that both the process of spatial pattern generation and the features of the patterns present clear and specific signatures. We interpreted a whole spatial pattern composed by two scaling features, the fractal borders of patches and patch size distribution. We found that the patch fractal dimension may not be very useful for LDD pattern characterization since it is highly dependent on time due to the fast dynamics of the system. We took also into account the pattern formation in time to interpret the generation of the scaling features. A novel result of this paper is the finding of a neat correspondence between the fractal and scaling characterization of the simulated and real patterns, and the inferred ecological and biological processes and mechanisms acting behind. This allows for a deeper understanding of dispersal mechanisms in apparently diverse and previously unrelated systems. Specifically, we show in detail how the LDD process of spread mediated by a fat-tailed distribution like a power law can generate a fractal patch border pattern by patch growth and coalescence, and how a particular disrupted patch size distribution appears by combination of LDD and localized dispersal and recruitment. We suggest that this is the process driving the early invasion from primary tumours, and invasion by invader species. In both real cases analysed, the mechanism of invasion appear to be consistent with the mechanism inferred from the simulations. Other examples support our present results. For instance, migrated cells of a glioma-astrocytoma originated multiple cell groups by division that appeared to be progenitors of tumour masses on Matrigel experiments (Bernstein et al., 1991). In another study labelling astrocytoma cells undergoing division (mitosis) in vitro, small subpopulations of invading cells were found forming groups of proliferating cells some distance away from the main tumour mass. Similar small clusters of proliferating cells were detected at the tumour edge (Tamaki et al., 1997). In a previous study referred to invasive trees dispersed by LDD, Cryptostegia grandiflora and Pinus ponderosa (Cannas et al., 2006), we found the same LDD signature acting at different spatial and temporal scales (hundreds of km2 and more than 100 year invasion for C. grandiflora, and several hectares for P. ponderosa during a 30-year invasion).
Evidence coming from other fields supports the idea of a specific LDD signature. In a field example, the process of patchy pattern generation we described supports the conjecture of LDD paleocolonization of oak populations occurred 10 000 years ago (Petit et al., 1997; Davies et al., 2004; Bialozyt et al., 2006). The existence of patches which are virtually fixed for a single haplotype of chloroplast DNA scattered over several hundred square kilometres (Petit et al., 1997) can be explained by the LDD process of pattern generation through the founder effect we show. Also, simulations performed allowing for occasional long-distance allele dispersal showed that the lag time between the formation of the advance colonies and the main body of the expanding populations leads to the formation of patches of highly inbred demes founded by migrants from the initial colonies (Ibrahim et al., 1996) although results were not explicitly contrasted with field data.
This founder effect is central to the clonal nature of cancer (Nowell, 1976), and can give explanation for the well-known genetic heterogeneity found at tumoural and metastatic levels in cancer (González-García et al., 2004; Klein et al., 2002). New cell lines disperse far away at very early times from the primary tumour and may give early origin to clonal metastatic tumours through the LDD founder effect we described. The same process can complement previous explanations of the intratumoural genetic heterogeneity (González-García et al., 2004), since we describe how LDD mediated by a power law allowing for local and long-range dispersal produces the coalescence of neighbouring patches, potentially representing different clones. After some dispersal time, these genetically different cell clusters could coalesce and give origin to a genetically heterogeneous tumour. The LDD process could also explain the existence of genetically related multi-focal tumours in some tissues (van Oijen and Slootweg, 2000) through the long-range cell dispersal followed by local proliferation. The LDD mechanism is particularly relevant to the debate on the role of cancer stem cells (Mimeault and Batra, 2007; Reya et al., 2001) on the arising of resistant cell lines during metastatic invasion that challenges the traditional therapeutical approaches (Merlo et al., 2006; Iwasa et al., 2006). If by the LDD process a mutated, resistant cell line with self-renewal ability is dispersed from the primary tumour, a resistant metastatic tumour can develop far away in very short time given the appropriate conditions. Although we used cancer images of gliomas just because they were the clearest examples showing the earliest invasion process we found, the increasing use of novel imaging technology will enable the direct observation of the early spreading of cancer cells from their site of origin and arriving at secondary sites (Sahai, 2007). The general LDD signature we described for gliomas should hold for other types of invasive solid tumours propagating through more structured invaded tissues, for example lung cancer (Li et al., 2004), and adenocarcinomas like breast carcinoma (Imanishi et al., 2007), and pancreatic infiltrating ductal adenocarcinoma (Hingorani et al., 2003). In invasive adenocarcinomas, the growth commonly first begins in the interior of ducts. As images from these ducts are normally taken from histological slices showing sectioned ducts, it is not easy to observe the first invasive steps. However, the spread occurs both along and to the interior of the ducts, and soon the dispersing cells trespass the ducts and invade the organ stroma, in the diffusive way we described (Hingorani et al., 2003, Imanishi et al., 2007).
The LDD signature we found is robust since it depends only on the internal population dynamics and dispersal. Following the definition of self-organization we adhere to, we can say that this signature reflects self-organizing processes in simulations and we suggest that also entails self-organization in the apparently very different real systems analysed. It appears that it is not fundamentally affected by other ecological processes like competitive interactions and habitat heterogeneity, since we found similar results from the single species, homogenous habitat modelling and from simulations involving competitive interactions and habitat occupancy by a resident previously to invader's dispersal. We found the same patterns from the complex field scenario involving the competitive spread of a species into a mountainous forest community (Marco et al., 2002) and from spread of cancer cells involving interaction with tumour microenvironment (Hu et al., 2003; Johnston et al., 2007). A variation appears in the fractal dimension of patch borders in relation to definition of mean distance dispersal and the dispersal environment, from higher DB values for the unrestrictive environment (simulation field) to medium and lower values for progressively restrictive environments for dispersion and progeny recruitment (native forest and extracellular matrix/invaded tissue). In addition, LDD pattern signature is robust to the temporal scale considered (years for first reproduction for the species and hours/days for the cancer cells), and the spatial scale considered (km for the species dispersal and micra for the cancer invasion). It is also consistent under different spatial resolution levels of analysis: while the model resolution is maximal (all individuals including newly born ones were traced in the simulations), resolution of real data is lower (only individuals of a minimum detectable size were recorded from the aerial images and cancer cell recognition depended on threshold detection in stained samples). The consistency of the LDD signature is also supported by the simulations results and real examples of invasions involving only dispersal but not subsequent local proliferation (“physiological invasions”). As we expected from the simulations, trophoblast cells invasion during placentation did not show the typical patch size power-law pattern. “Physiological” invasions can thus be viewed as less self-organized processes more dependent on extrinsic regulations than malignant invasions like cancer. In these malignant invasions robustness against external perturbations like chemotherapy (Kitano, 2004) could be in part the result of the kind of self-organizing, internal processes we describe. Thus, the LDD signature could be useful in the discrimination of malignant, e.g., choriocarcinoma, from benign and “physiological” invasions (like trophoblastic moles and normal placentation).
The choice of an adequate dispersal distribution function, the power law allowing extremely LDD and local subsequent dispersal and recruitment, was crucial both to obtain a sensible and realistic model output and to explain the dynamics of LDD spread. Utilization of bounded or partially bounded distribution functions in modelling LDD process has led to difficulties both in the predictive and explanatory aspects of the models. For example, the use of exponentially bounded dispersal functions for modelling the spread of an invasive moth rendered discrepancies between the observed invasion rates, spatial pattern configuration and fractal characterization (Gilbert et al. 2004, 2005). In another example, brain cancer cell dispersion around the primary tumour was modelled introducing a hypothetical chemotactic attraction (Sander and Deisboeck, 2002). In particular, patterns generated by these models did not reflect the spread of the invasive individuals or cells through a large area at very early invasion times.
5. Concluding remarks
Cancer invasion is a complex, biologically robust process involving many factors (Kitano, 2004; Merlo et al., 2006). However, interpretation of the process of cancer invasion in terms of self-organizing, long-range dispersal ecological mechanisms can help to simplify the problem without loss of its essential features and to develop more effective therapeutical strategies. In biological invasions, the species invasiveness (dispersal ability) is crucial for invasion success and LDD spread guarantees a fast access of the entire habitat (Cannas et al., 2006). If as we suggest, cancer invasion is mediated by similar LDD processes, thus very early and far reaching dispersal of potentially metastatic cells should be expected. This supports the current practice of searching for metastasis as soon as the first tumour is found.
It is also important to remember that once the fast, first dispersal event has occurred, the habitat invasibility, i.e., the habitat characteristics that can facilitate the invasion becomes relevant to the invasion outcome (Marco and Páez, 2000). In the case of plant invasion, these habitat features are well known in many cases, and they include physical environmental conditions (e.g., soil, light, and water availability) and other interacting organisms (e.g., native plants, pollinators, seed predators) (Marco et al., 2002). In the case of cancer invasion, however, only recently the importance of the microenvironment represented by the new tissues and organs reached by the dispersed cells has begun to be acknowledged. The tumour microenvironment is a complex system of many cell types, including endothelial cells and their precursors, pericytes, smooth-muscle cells, fibroblasts of various phenotypes, myofibroblasts, neutrophils and other granulocytes (eosinophils and basophils), mast cells, T, B, and natural killer lymphocytes, and antigen presenting cells such as macrophages and dendritic cells (Albini and Sporn, 2007), to name some of the components. Through activity of these components, the tumour microenvironment can for example exert metastasis suppression effects (Kenny and Bissell, 2003), or promote cancer progress, for example through recruitment of normal stromal cells by that pancreatic cancer cells (Vonlaufen et al. 2007). Also, it has been shown that presence of the primary tumour can inhibit the onset of metastasis from previously widely dispersed cells (Guba et al., 2001; Demicheli et al., 2005). At present, knowledge of role of these factors in the onset and progression, or either suppression of cancer invasion is still too premature to provide a consistent framework for modelling the complex tumour microenvironment in a reliable way. Further research on the relationships between the microenvironment and cancer cells is needed to integrate them in a coherent modelling framework, and we are working in this direction. However, considering the importance of both factors in cancer invasion, invasiveness and invasibility, it is tempting to suggest that in the future, therapeutical approaches could be increasingly directed to early screenings for dispersed cells and to manipulate the potentially targeted microenvironments that could facilitate or not the establishment of metastases.
Supplementary Material
Acknowledgments
We acknowledge Dante Chialvo for a critical reading and Jim Brown and Ricard Solé for helpful general comments on the original manuscript. We are also indebted with anonymous reviewers for helpful comments. This research was supported by grants from Secyt-Universidad Nacional de Córdoba, Agencia Córdoba Ciencia and CONICET (Argentina), the Medical Research Council of the United Kingdom, the National Institute of Health, USA (CA102011), American Cancer Society, USA (RSG CSM-107144) and the Hillman Fellows Program (S.-Y.C. and B.H.). D.E.M. and S.A.C. are members of the National Research Council (CONICET, Argentina).
Footnotes
Appendix A. Supplementary Material: Supplementary data associated with this article can be found in the online version at doi:10.1016/j.jtbi.2008.09.011.
Contributor Information
Diana E. Marco, Email: dmarco@agro.uncor.edu.
Sergio A. Cannas, Email: cannas@famaf.unc.edu.ar.
Marcelo A. Montemurro, Email: m.montemurro@manchester.ac.uk.
Bo Hu, Email: hub@upmc.edu.
Shi-Yuan Cheng, Email: chengs@upmc.edu.
References
- Albini A, Sporn MB. The tumour microenvironment as a target for chemoprevention. Nat Rev Cancer. 2007;7:139–147. doi: 10.1038/nrc2067. [DOI] [PubMed] [Google Scholar]
- Bernstein JJ, Laws ER, Jr, Levine KV, Wood LR, Tadvalkar G, Goldberg WJ. C6 glioma-astrocytoma cell and fetal astrocyte migration into artificial basement membrane: a permissive substrate for neural tumours but not fetal astrocytes. Neurosurgery. 1991;28:652–658. doi: 10.1097/00006123-199105000-00003. [DOI] [PubMed] [Google Scholar]
- Bialozyt R, Ziegenhagen B, Petit RJ. Contrasting effects of long distance seed dispersal on genetic diversity during range expansion. J Evol Biol. 2006;19:12–20. doi: 10.1111/j.1420-9101.2005.00995.x. [DOI] [PubMed] [Google Scholar]
- Brown JKM, Hovmoller MS. Aerial dispersal of pathogens on the global and continental scales and its impact on plant disease. Science. 2002;297:537–541. doi: 10.1126/science.1072678. [DOI] [PubMed] [Google Scholar]
- Brú A, Pastor JM, Fernaud I, Brú I, Melle S, Berenguer C. Super-rough dynamics on tumor growth. Phys Rev Lett. 1998;81:4008–4011. [Google Scholar]
- Brú A, Albertos S, Subiza JL, López García-Asenjo J, Brú I. The universal dynamics of tumor growth. Biophys J. 2003;85:2948–2961. doi: 10.1016/S0006-3495(03)74715-8. [DOI] [PMC free article] [PubMed] [Google Scholar]
- Bullock JM, Clarke RT. Long distance seed dispersal by wind: measuring and modelling the tail of the curve. Oecologia. 2000;124:506–521. doi: 10.1007/PL00008876. [DOI] [PubMed] [Google Scholar]
- Cannas SA. Phase diagram of a stochastic cellular automaton with long-range interactions. Physica A. 1998;258:32–44. [Google Scholar]
- Cannas SA, Marco DE, Páez SA. Modelling biological invasions: species traits, species interactions and habitat heterogeneity. Math Biosci. 2003;183:93–110. doi: 10.1016/s0025-5564(02)00213-4. [DOI] [PubMed] [Google Scholar]
- Cannas SA, Marco DE, Montemurro M. Long range dispersal and spatial pattern formation in biological invasions. Math Biosci. 2006;203:155–170. doi: 10.1016/j.mbs.2006.06.005. [DOI] [PubMed] [Google Scholar]
- Clark JS, Lewis M, Horvath L. Invasion by extremes: population spread with variation in dispersal and reproduction. Am Nat. 2001;157:537–554. doi: 10.1086/319934. [DOI] [PubMed] [Google Scholar]
- Davies S, White A, Lowe A. An investigation into effects of long-distance seed dispersal on organelle population genetic structure and colonization rate: a model analysis. Heredity. 2004;93:566–576. doi: 10.1038/sj.hdy.6800555. [DOI] [PubMed] [Google Scholar]
- Demicheli R, Miceli R, Moliterni A, Zambetti M, Hrushesky WJM, et al. Breast cancer recurrence dynamics following adjuvant CMF is consistent with tumor dormancy and mastectomy-driven acceleration of the metastatic process. Ann Oncol. 2005;16:1449–1457. doi: 10.1093/annonc/mdi280. [DOI] [PubMed] [Google Scholar]
- Essam JW. Percolation theory. Rep Prog Phys. 1980;43:833–912. [Google Scholar]
- Even-Ram S, Uziely B, Cohen P, Grisaru-Granovsky S, Maoz M, et al. Thrombin receptor overexpression in malignant and physiological invasion processes. Nat Med. 1998;4:909–914. doi: 10.1038/nm0898-909. [DOI] [PubMed] [Google Scholar]
- Ferretti C, Bruni L, Dangles-Marie V, Pecking AP, Bellet D. Molecular circuits shared by placental and cancer cells, and their implications in the proliferative, invasive and migratory capacities of trophoblasts. Hum Reprod Update. 2007;13:121–141. doi: 10.1093/humupd/dml048. [DOI] [PubMed] [Google Scholar]
- Filipe JAN, Maule MM. Effects of dispersal mechanisms on spatio-temporal development of epidemics. J Theor Biol. 2004;226:125–141. doi: 10.1016/s0022-5193(03)00278-9. [DOI] [PubMed] [Google Scholar]
- Gibson GJ. Investigating mechanisms of spatio-temporal epidemic spread using stochastic models. Phytopathology. 1997;87:139–146. doi: 10.1094/PHYTO.1997.87.2.139. [DOI] [PubMed] [Google Scholar]
- Gilbert M, Grégoire JC, Freise JF, Heitland W. Long-distance dispersal and human population density allow the prediction of invasive patterns in the horse chestnut leafminer Cameraria ohridella. Ecology. 2004;73:459–468. [Google Scholar]
- Gilbert M, Guichard S, Freise J, Grégoire JC, Heitland W, Straw N, Tilbury C, Augustin S. Forecasting Cameraria ohridella invasion dynamics in recently invaded countries: from validation to prediction. J Appl Ecol. 2005;42:805–813. [Google Scholar]
- Gleiser PM, Tamarit FA, Cannas SA. Self-organized criticality in a model of biological evolution with long-range interactions. Physica A. 2000;275:272–280. [Google Scholar]
- Gleiser PM, Cannas SA, Tamarit FA, Zheng B. Long-range effects in granular avalanching. Phys Rev E. 2001;63:042301. doi: 10.1103/PhysRevE.63.042301. [DOI] [PubMed] [Google Scholar]
- Goffin F, Munaut C, Malassiné A, Evain-Brion D, Frankenne F, et al. Evidence of a limited contribution of feto–maternal interactions to trophoblast differentiation along the invasive pathway. Tissue Antigens. 2003;62:104–116. doi: 10.1034/j.1399-0039.2003.00085.x. [DOI] [PubMed] [Google Scholar]
- González-García I, Solé RV, Costa J. Metapopulation dynamics and spatial heterogeneity in cancer. Proc Natl Acad Sci USA. 2004;99:13085–13089. doi: 10.1073/pnas.202139299. [DOI] [PMC free article] [PubMed] [Google Scholar]
- Guba M, Cernaianu G, Koehl G, Geissler EK, Jauch KW, et al. A primary tumor promotes dormancy of solitary tumor cells before inhibiting angiogenesis. Cancer Res. 2001;61:5575–5579. [PubMed] [Google Scholar]
- Halley JM, Hartley S, Kallimanis AS, Kunin WE, Lennon JJ, Sgardelis SP. Uses and abuses of fractal methodology in ecology. Ecol Lett. 2004;7:254–271. [Google Scholar]
- Higgins SI, Richardson DM, Cowling RM. Modelling invasive plant spread: the role of plant–environment interactions and model structure. Ecology. 1996;77:2043–2054. [Google Scholar]
- Hingorani SR, Petricoin EF, Anirban Maitra A, Rajapakse V, et al. Preinvasive and invasive ductal pancreatic cancer and its early detection in the mouse. Cancer Cell. 2003;4:437–450. doi: 10.1016/s1535-6108(03)00309-x. [DOI] [PubMed] [Google Scholar]
- Hu B, Guo P, Fang Q, Tao HQ, Wang D, et al. Angiopoietin-2 induces human glioma invasion through the activation of matrix metalloprotease-2. Proc Natl Acad Sci USA. 2003;100:8904–8909. doi: 10.1073/pnas.1533394100. [DOI] [PMC free article] [PubMed] [Google Scholar]
- Ibrahim KM, Nichols RA, Hewitt GM. Spatial patterns of genetic variation generated by different forms of dispersal during range expansion. Heredity. 1996;77:282–291. [Google Scholar]
- Imanishi Y, Hu B, Jarzynka MJ, Guo P, Elishaev E, Bar-Joseph I, Cheng SY. Angiopoietin-2 stimulates breast cancer metastasis through the A5B1 integrin-mediated pathway. Cancer Res. 2007;67:4254–4263. doi: 10.1158/0008-5472.CAN-06-4100. [DOI] [PMC free article] [PubMed] [Google Scholar]
- Iwasa Y, Nowak MA, Michor F. Evolution of resistance during clonal expansion. Genetics. 2006;172:2557–2566. doi: 10.1534/genetics.105.049791. [DOI] [PMC free article] [PubMed] [Google Scholar]
- Jennane R, Harba R, Lemineur G, Bretteil S, Estrade A, Benhamou CL. Estimation of the 3D self-similarity parameter of trabecular bone from its 2D projection. Med Image Anal. 2007;11:91–98. doi: 10.1016/j.media.2006.11.001. [DOI] [PubMed] [Google Scholar]
- Johnston ALM, Xueqing Lun X, Rahn JJ, Liacini A, Wang L, et al. The p75 neurotrophin receptor is a central regulator of glioma invasion. PLoS Biol. 2007;5:1723–1737. doi: 10.1371/journal.pbio.0050212. [DOI] [PMC free article] [PubMed] [Google Scholar]
- Kaufman LJ, Brangwynne CP, Kasza KE, Filippidi E, Gordon VD, Deisboeck TS, Weitz DA. Glioma expansion in collagen I matrices: analyzing collagen concentration-dependent growth and motility patterns. Biophys J. 2005;89:635–650. doi: 10.1529/biophysj.105.061994. [DOI] [PMC free article] [PubMed] [Google Scholar]
- Kenny PA, Bissell MJ. Tumor reversion: correction of malignant behavior by microenvironmental cues. Int J Cancer. 2003;107:688–695. doi: 10.1002/ijc.11491. [DOI] [PMC free article] [PubMed] [Google Scholar]
- Kitano H. Cancer as a robust system: implications for anticancer therapy. Nat Rev Cancer. 2004;4:227–235. doi: 10.1038/nrc1300. [DOI] [PubMed] [Google Scholar]
- Klein CA, Blankenstein TJF, Schmidt-Kittler O, Petronio M, Polzer B, et al. Genetic heterogeneity of single disseminated tumour cells in minimal residual cancer. Lancet. 2002;360:683–689. doi: 10.1016/S0140-6736(02)09838-0. [DOI] [PubMed] [Google Scholar]
- Kot M, Lewis MA, van den Driessche P. Dispersal data and the spread of invading organisms. Ecology. 1996;77:2027–2042. [Google Scholar]
- Le Corre V, Machon N, Petit RJ, Kremer A. Colonization with longdistance seed dispersal and genetic structure of maternally inherited genes in forest trees: a simulation study. Genet Res Camb. 1997;69:117–125. [Google Scholar]
- Li F, Sone S, Abe H, MacMahon H, Doi K. Malignant versus benign nodules at CT screening for lung cancer: comparison of thin-section CT findings. Radiology. 2004;233:793–798. doi: 10.1148/radiol.2333031018. [DOI] [PubMed] [Google Scholar]
- Mandelbrot BB. The Fractal Geometry of Nature. W.H. Freeman; San Francisco: 1982. [Google Scholar]
- Marco DE, Páez SA. Invasion of Gleditsia triacanthos in Lithraea ternifolia montane forests of central Argentina. Environ Manage. 2000;26:409–419. doi: 10.1007/s002670010098. [DOI] [PubMed] [Google Scholar]
- Marco DE, Páez SA, Cannas SA. Species invasiveness in biological invasions: a modelling approach. Biol Inv. 2002;4:193–205. [Google Scholar]
- Mayr E. Animal Species and Evolution. Harvard University Press; Cambridge, MA: 1963. [Google Scholar]
- Merlo LMF, Pepper JW, Reid BJ, Maley CC. Cancer as an evolutionary and ecological process. Nat Rev Cancer. 2006;6:924–935. doi: 10.1038/nrc2013. [DOI] [PubMed] [Google Scholar]
- Mimeault M, Batra SK. Functions of tumorigenic and migrating cancer progenitor cells in cancer progression and metastasis and their therapeutic implications. Cancer Metastasis Rev. 2007;26:203–214. doi: 10.1007/s10555-007-9052-4. [DOI] [PubMed] [Google Scholar]
- Muirhead JR, Leung B, van Overdijk C, Kelly DW, Nandakumar K, Marchant KR, MacIsaac HJ. Modelling local and long-distance dispersal of invasive emerald ash borer Agrilus planipennis (Coleoptera) in North America. Diversity Distrib. 2006;12:71–79. [Google Scholar]
- Nathan R. Long-distance dispersal research: building a network of yellow brick roads. Diversity Distrib. 2005;11:125–130. [Google Scholar]
- Nowell PC. The clonal evolution of tumour cell populations. Science. 1976;194:23–28. doi: 10.1126/science.959840. [DOI] [PubMed] [Google Scholar]
- Pascual M, Roy M, Guichard F, Flierl G. Cluster size distributions: signatures of self-organization in spatial ecologies. Philos Trans R Soc Lond B. 2002;357:657–666. doi: 10.1098/rstb.2001.0983. [DOI] [PMC free article] [PubMed] [Google Scholar]
- Petit R, Pineau E, Demesure B, Bacilieri R, Ducousso A, Kremer A. Chloroplast DNA footprints of postglacial recolonization by oaks. Proc Natl Acad Sci USA. 1997;94:9996–10001. doi: 10.1073/pnas.94.18.9996. [DOI] [PMC free article] [PubMed] [Google Scholar]
- Pollheimer J, Knöfler M. Signalling pathways regulating the invasive differentiation of human trophoblasts: a review. Placenta. 2005;26 A:S25–S30. doi: 10.1016/j.placenta.2004.11.013. Trophoblast Research 19. [DOI] [PubMed] [Google Scholar]
- Reya T, Morrison SJ, Clarke MF, Weissman IL. Stem cells, cancer, and cancer stem cells. Nature. 2001;414:105–111. doi: 10.1038/35102167. [DOI] [PubMed] [Google Scholar]
- Sahai E. Illuminating the metastatic process. Nat Rev Cancer. 2007;7:737–749. doi: 10.1038/nrc2229. [DOI] [PubMed] [Google Scholar]
- Sander LM, Deisboeck TS. Growth patterns of microscopic brain tumours. Phys Rev E. 2002;66:051901. doi: 10.1103/PhysRevE.66.051901. [DOI] [PubMed] [Google Scholar]
- Scanlon TM, Caylor KK, Levin SA, Rodriguez-Iturbe I. Positive feedbacks promote power-law clustering of Kalahari vegetation. Nature. 2007;449:209–211. doi: 10.1038/nature06060. [DOI] [PubMed] [Google Scholar]
- Shaw MW. Simulation of population expansion and spatial pattern when individual dispersal distributions do not decline exponentially with distance. Proc R Soc Lond B Biol Sci. 1995;259:243–248. [Google Scholar]
- Sutherland BR, Jacobs AE. Self-organization and scaling in a lattice predator–prey model. Complex Systems. 1994;8:385–405. [Google Scholar]
- Talmadge JE, Wolman SR, Fidler IJ. Evidence for the clonal origin of spontaneous metastases. Science. 1982;217:361–363. doi: 10.1126/science.6953592. [DOI] [PubMed] [Google Scholar]
- Tamaki M, McDonald W, Amberger VR, Moore E, del Maestro RF. Implantation of C6 astrocytoma spheroid into collagen type I gels: invasive, proliferative, and enzymatic characterizations. J Neurosurg. 1997;87:602–609. doi: 10.3171/jns.1997.87.4.0602. [DOI] [PubMed] [Google Scholar]
- van Oijen MG, Slootweg PJ. Oral field cancerization: carcinogen-induced independent events or micrometastatic deposits. Cancer Epidemiol Biomarkers Prev. 2000;9:249–256. [PubMed] [Google Scholar]
- Vonlaufen Alain, Joshi Swapna, Qu Ch, et al. Pancreatic stellate cells: partners in crime with pancreatic cancer cells. Cancer Res. 2007;68:2085–2093. doi: 10.1158/0008-5472.CAN-07-2477. [DOI] [PubMed] [Google Scholar]
- Wingen LU, Brown JKM, Shaw MW. The population genetic structure of clonal organisms generated by exponentially-bounded and fat-tailed dispersal. Genetics. 2007;177:435–448. doi: 10.1534/genetics.107.077206. [DOI] [PMC free article] [PubMed] [Google Scholar]
- Xu XM, Ridout MS. Effects of initial epidemic conditions, sporulation rate, and spore dispersal gradient on the spatio-temporal dynamics of plant disease epidemics. Phytopathology. 1998;88:1000–1012. doi: 10.1094/PHYTO.1998.88.10.1000. [DOI] [PubMed] [Google Scholar]
Associated Data
This section collects any data citations, data availability statements, or supplementary materials included in this article.