Abstract
There is clinical evidence that chronic liver diseases in which MDBs (Mallory Denk Bodies) form progress to hepatocellular carcinoma. The present study provides evidence that links MDB formation induced by chronic drug injury, with preneoplasia and later to the formation of tumors, which develop long after drug withdrawal. Evidence indicated that this link was due to an epigenetic cellular memory induced by chronic drug ingestion. Microarray analysis showed that the expressions of many markers of preneoplasia (UBD, Alpha Fetoprotein, KLF6 and Glutathione-S-Transferase mu2) were increased together when the drug DDC was refed. These changes were suppressed by S-adenosylmethionine feeding, indicating that the drug was affecting DNA and histones methylation in an epigenetic manner. The link between MDB formation and neoplasia formation was likely due to the over expression of UBD (also called FAT10), which is up regulated in 90% of human hepatocellular carcinomas. Immunohistochemical staining of drug primed mouse livers showed that FAT10 positive liver cells persisted up to 4 months after drug withdrawal and they were still found in the livers of mice, 14 months after drug withdrawal. The refeeding of DDC increased the percent of FAT10 hepatocytes.
INTRODUCTION
There is mounting evidence that liver neoplasms develop as a result of the modification of genes and changes in gene expression due to changes in epigenetic cellular memory (Santos-Rosa, Calsada, 2005). The focus of the present study is on epigenetic changes that occur in liver cells when Mallory Denk bodies (MDB) form. MDBs are formed in hepatocytes of mice fed drugs such as DDC, griseofulvin or dieldrin. Liver tumors develop subsequently suggesting that the MDB forming phenotype is a preneoplastic change, which leads to liver cell tumor formation(Roomi et al, 2006; Nan et al, 2006a; Nagao et al, 1999; Nagao et al, 1998a; Cadrin et al, 1990, Tazawa et al, 1983; Meierhenry et al, 1983; Meierhenry et al, 1981). Refeeding the drug or thioacetamide after drug withdrawal, stimulates MDB forming liver cells to proliferate at a growth rate that exceeds the neighboring normal hepatocytes (Roomi et al, 2006; Nagao et al, 1998b).
The markers for the MDB associated preneoplastic phenotype include A2 macroglobin, gamma glutamyl transpeptidase, alpha fetoprotein, GSTmu2, fatty acid synthase, Glypian-3, p38, and Akt (Roomi et al, 2006; Nan et al, 2006a; Nagao et al, 1999; Tazawa et al, 1983; Nagao et al, 1998b; Nan et al, 2006b) 2,3,4,7,10,11.
Microarray analysis of gene expression by livers from drug-primed mice showed that when MDB forming cells increased after feeding or refeeding DDC, many of the genes’ preneoplastic marker were up regulated (Bardag-Gorce et al, 2007)12. The most up regulated gene, however, was UBD (116 fold up regulated). UBD (FAT10) was over expressed in 90% human hepatocellular carcinomas (HCC) (Canaan et al, 2006; Lee et al, 2003; Liu et al, 1999). The expression of a large number of genes was changed when MDB cells formed, including genes for enzymes that make epigenetic modifications like DNA methylation and/or acetylation and methylation of histones. These are the enzymes that regulate many epigenetic events (Santos-Rosa, Calsada, 2005). In the present paper, the changes were documented in FAT10 expression by MDB forming hepatocytes in vivo and in vitro. FAT10 expression, in liver tumors which formed after DDC withdrawal for 8–14 months, was also studied. FAT10 postive cell proliferation was induced by DDC refeeding. The inhibitory effects of S-adenosyl methionine feeding on this phenomenon were studied. The effect of DNA methylation and histone acetylation of genes on MDB formation was also studied. The inhibitors 5-Aza-cytidine and TSA were used here in vitro. MDBs formed spontaneously in primary liver cell cultures derived from drug withdrawn mice (Nan et al, 2006a; Nan et al, 2006b; Wu et al, 2005).
MATERIAL AND METHODS
Animals
One-month-old C3H male mice (Harlan Sprague-Dawley, San Diego, CA) were fed DDC (0.17% diethyl 1,4-dihydro-2, 4, 6-trimethyl-3, 5-pyridinedicarboxylate (Sigma-Aldrich, St Louis, MO) for 10 weeks to induce MDB formation in vivo. The mice were then withdrawn from the drug for 1 month (n=4), 9 weeks (n=4), 11 weeks (n=4), 4 months (n=4) in order to determine the length of time the cellular memory lasted in MDB forming cells. These mice were then refed DDC with or without S-adenosylmethionine (SAMe), 4g/kg body wt/day by gavage (Sigma Aldrich, St Louis, MO) for 7 days. DDC withdrawn mice were sacrificed at 8–9 months (n=11) or 13–14 months (n=11) to access persistence of UBD positive hepatocytes. They were viewed as scattered single cells or within liver cell tumors, which had formed. Some of the livers examined here were used in previous studies (Nan et al, 2006a; Li et al, in press). All mice were treated in a humane manner as approved by the Animal Care Committee at Harbor-UCLA Laboratory BioMedical Research Institute according to the Guidelines of the National Academy of Science. RNA was extracted from some livers for microarrays and Quantitative RT-PCR. Portions of each liver were frozen in liquid nitrogen and stored at −80oC. In addition, samples from each liver were fixed in 10% zinc buffered formalin for 4 hours then stored in 80% alcohol. They were embedded in paraffin for light and immunofluorescence microscopy.
Tissue Culture
Mice which were withdrawn 1 month from DDC feeding were used for the primary tissue culture studies (n=3). Control mice livers were studied in parallel (n=3). The livers were perfused to isolate hepatocytes for use in primary cultures. (the model used to study spontaneous MDB formation in vitro) (Wu et al, 2005).
Hepatocyte Isolation
The mice were anesthetized with 33% ketamine (Phoenix, St Joseph’s, MD) and a catheter was inserted into the hepatic vein. The livers were perfused in a retrograde manner with calcium perfusion buffer containing 100 U/ml collagenase type 1 (Sigma-Aldrich, St Louis, MO) and 0.1 U/ml elastase (Worthington, Lakewood, NJ). After perfusion, the livers were removed and the cells were dispersed in William’s E medium (Sigma-Aldrich, St. Louis, MO) containing fatty acid free bovine albumin (5 mg/ml), insulin (2.4 U/L), dexamethasone (3.9 μg/ml) and ornithine (67 μg/ml). The cell suspension was monitored for the presence of MDBs and phenotype. The hepatocytes were plated at a density of 105 cells per well on 6 well plates with fibronectin (Biochemical technologies Inc., Stroughton, MA) – coated glass coverslips. The cells were incubated for 6 days as untreated controls, vehicle, Trichostatin A (TSA) (500 nM) and 5-Aza-cytidine, (2.5 μM), and combined TSA and 5-Aza-cytidine (n=9).
Immunofluorescence staining
The cover slips and liver biopsy sections were double stained with ubiquitin rabbit polyclonal antibody (DAKO, Carpinteria, CA), mouse monoclonal anti CK8 (RD1, 7 Landers, NJ) or rabbit polyclonal anti UBD (Fat10). Binding of antibodies and double staining with two antibodies from different species were detected with Texas-Red conjugated and FITC-conjugated secondary antibodies (Jackson, West Grove, PA). DAPI was used for nuclear staining.
The slides were examined using a Nikon-400 fluorescent microscope with a triple color band cube to detect simultaneously FITC, Texas Red and DAP1 staining. UBD (FAT10) positive hepatocytes were detected and quantitated using Nikon morphometric software. Using an antibody to 5-methyl cytosine (Calbiochem, San Diego, CA) methylation of nuclear DNA was measured in normal and MDB forming hepatocytes using Nikon morphometric software.
Microarray analysis
Liver tissue from the mice of each treatment group was subjected to microarray analysis. Total liver RNAs were extracted with Ultraspec™ RNA Isolation Systemic (Biotecx Laboratories, Houston, TX) and cleaned with Rneasy columns (Qiagen, Valencia, CA). Five micrograms of total RNA were used for preparing biotin-labeled cRNA. Labeled and fragmented cRNA was subsequently hybridized to Mouse Genome 430 2.0 Array (Affymetrix, Santa Clara, CA). Labeling, hybridization, image scanning and initial data analysis were performed by the Microarray Core at Los Angeles Biomedical Research Institute. Sample preparation and loading, hybridization, staining and microarray data analysis were carried out (Bardag-Gorce et al, 2007).
Quantitative real-time RT-PCR assay
Total liver RNAs were extracted with Trizol Plus RNA Purification Kit (Invitrogen, Carlsbad, CA). Synthesis of cDNAs was performed with 5 μg total RNA, and 50 ng random hexamer primers using SuperSriptIII RNase H− Reverse Transcriptase (Invitrogen, Carlsbad, CA). PCR primers were designed with the assistance of the Primer Express software (Applied Biosystems, Foster City, CA). The primers for mouse liver UBD, KLF6 and AFP were:
| Ubiquitin D | NM_023137 | FmUBD | 5 GATTGACAAGGAAACCACTATCCA |
| Ubiquitin D | NM_023137 | RmUBD | 5 ACAAGGGCAGCTCTTCATCAC |
| KLF6 | NM_011803.2 | FmKLF6 | 5 CTCGGACTCCTGATCGTTCAC |
| KLF6 | NM_011803.2 | RmKLF6 | 5 CCGTTTCGTGCACAATCTGTA |
| AFP | NM_007423 | FmAFP | 5 AGCTCAGCGAGGAGAAATGGT |
| AFP | NM_007423 | RmAFP | 5 GAGTTCACAGGGCTTGCTTCAT |
Sense and anti-sense: Quantitative PCR was achieved using the SYBR Green JumpStart™ Tag ReadyMix (Sigma, St. Louis, MO) on an ABI PRISM 7700 Sequence Detector System (Applied Biosystems, Foster City, CA). The thermal cycling consists of an initial step at 50°C for 2 min, followed by a denaturation step at 95°C for 10 min, then 40 cycles at 95°C for 15 s and 60°C for 1 min. Single PCR product was confirmed with the heat dissociation protocol at the end of the PCR cycles. Quantitative values were obtained from the threshold PCR cycle number (Ct) at which point the increase in signal associated with an exponential growth for PCR product starts to be detected. The target mRNA abundance in each sample was normalized to its 18S level as ΔCt = Cttarget gene − Ct18S. For each target gene, the highest ΔCt was assigned as ΔCtmax.
Cellular fractionation
Mice liver homogenates were prepared by homogenizing 100mg of frozen liver tissue in 2 ml of 20mM Tris-HCl pH 7.5; glycerol 10%; EGTA 1mM; DTT 1mM; NaFluoride 50 mM; proteases and phosphatases inhibitor cocktail (Sigma). The tissues were homogenized using the Ultra-Turrax T25 homogenizer. Protein concentrations were determined using the Bradford method (Bradford, 1976).
Western Blot Analysis
Proteins (50 μg) from liquid nitrogen frozen stored livers were separated by SDS-PAGE gels and transferred to a PVDF membrane (Bio-Rad, Hercules, CA) for 1 h in 25 mM Tris-HCl (pH 8.3), 192 mM glycine and 20% methanol. The membranes were stained using the polyclonal rabbit antibody Dnmt3b (Abcam, Cambridge, MA), OGG1 (Novus Biologicals, Littleton, CO) and FAT10 (BioMol, Plymouth, PA). Appropriate species anti polyclonal and monoclonal HRP-conjugated antibodies were used as the secondary antibodies. The membranes were subjected to chemiluminescence detection using luminal, according to the manufacturer’s instructions (Amersham Pharmacia Biotech, Piscataway, NJ).
Statistical Analysis
P values were determined by ANOVA and student-Newman-Keuls for multiple group comparisons (Sigma-Stat software, San Francisco, CA). Microarrays were analyzed using Wilcoxon’s signed rank test comparison analysis to derive biologically significant results from the raw probe cell intensities on expression arrays. For comparison analysis, each probe set on the experiment array was compared with its counterpart on the control array to calculate the change in P value that was used to generate the difference call of increase (I; P<0.04), marginal increase (MI; P<0.04 to P<0.06), decrease (D; P>0.997), marginal decrease (MD; P>0.992 to P>0.997), or no change (NC: P>0.06 to P<0.997). Comparison analysis was used to generate a signal log ratio for each probe prior to the experimental array to the corresponding probe pair on the control array. This strategy cancels out differences resulting from different probe finding coefficients. Signal log ratio was computed by using a one-step Tukey’s biweight method by taking a mean of the log ratio of probe pair intensities across the two arrays. Functional pathway of gene expression changes were accessed using KEGG software.
Results
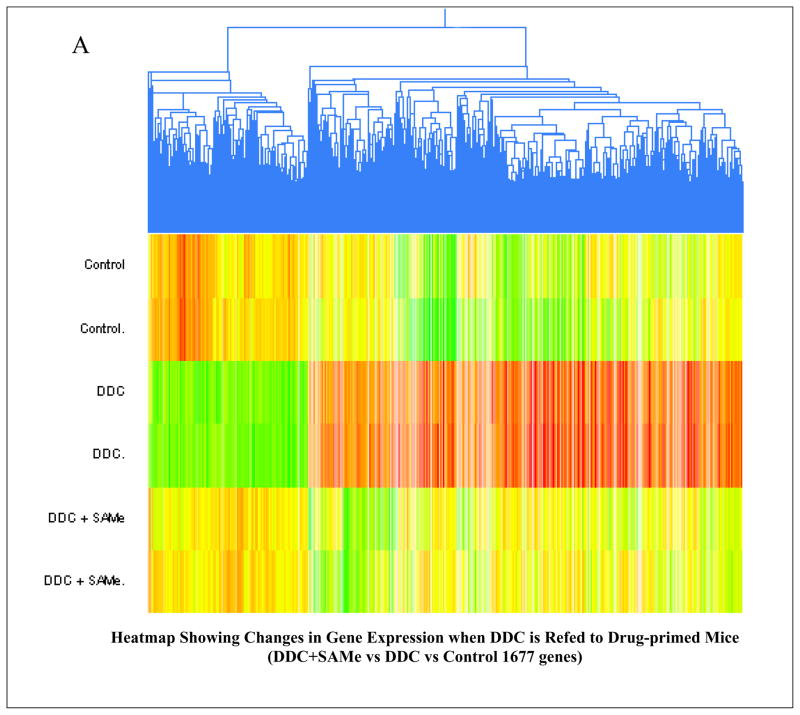
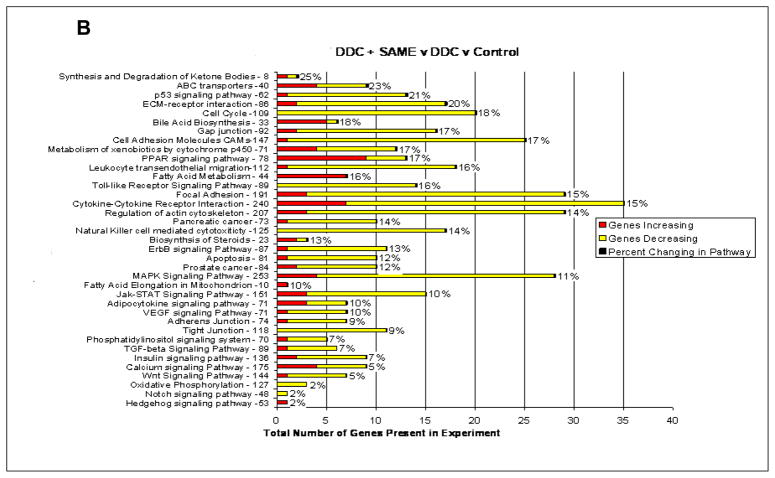
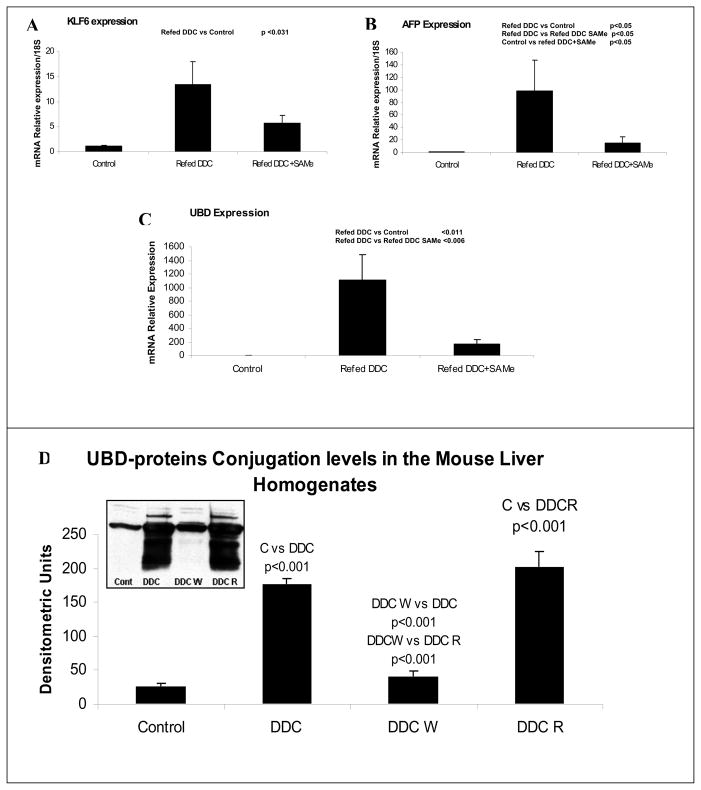
The Heatmap comparing mice refed DDC, with mice refed DDC with SAMe showed that SAMe largely prevented the changes in gene expression induced by DDC refeeding (Fig 1A). When the microarray analysis was organized according to changes in functional categories using KEGG software it was found that SAMe treatment inhibited the up regulation of gene expression in almost all functional categories (Fig 1B). The changes in gene expression inhibited by SAMe, included UBD (FAT10) KLF6 (Kruppel-like factor 6), GSTmu2 (glutathione S transferase 2) and AFP (alpha fetoprotein). The expression of these genes is also up regulated in liver preneoplasia. DDC refeeding up regulated UBD (187±1.7 fold) and SAMe reduced the up regulation (−34±1.3 fold). DDC refeeding up regulated AFP by 53±1.8 fold and SAMe decreased the increase by −12±1.4 fold. DDC refeeding up regulated GST mu2 112±1.2 fold and SAMe reduced the increase −11±1.2 fold. DDC refeeding up regulated KLF6 7±1.2 fold and SAMe reduced the increase −4.5±1.1 fold. KLF6, AFP and UBD expression, measured by RT-PCR, confirmed the increased expression of these genes by DDC refeeding and the decreased expression of them by SAMe (Fig 2). As indicated by Western Blot, DDC increased the expression of FAT10 protein (Fig 2). The smear under the FAT10 band probably represents FAT10 protein degradation products.
Fig 1.
(A) Heat map comparing the changes in gene expression after DDC refeeding vs DDC refeeding + SAMe feeding Mouse MDB Model In vivo (n=2). (B) Functional pathways where the expression of 442 genes changed when DDC refeeding treated mouse were compared with the DDC refeeding + SAMe feeding mouse, using KEGG software. (n=2)
Fig 2.
Changes in the expression of A) KLF6 B) AFP C) UBD (Fat10).. SAMe treatment reduces the induction by DDC refeeding of the expression of the 3 genes, suggesting that the expression of these genes is controlled by epigenetic modifications (n=3,3,5). UBD levels in total protein extract from mice liver tissue, determinated by Western Blot (D).
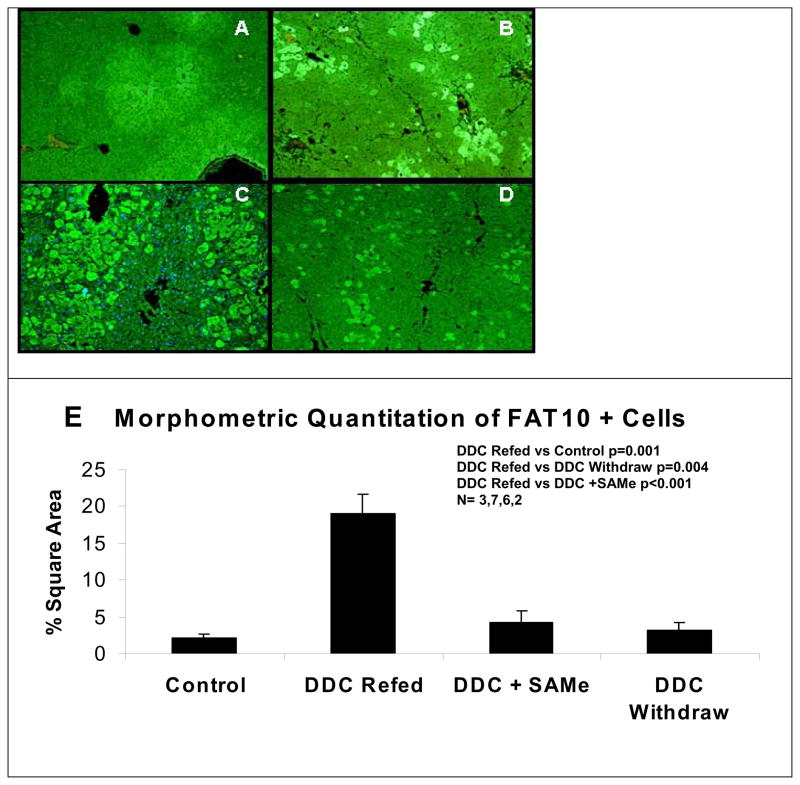
Immunofluoresence antibody detection of UBD in hepatocytes showed a marked increase in UBD positive hepatocytes in the livers of mice refed DDC (Fig 3C) compared to the livers of mice refed DDC with SAMe (Fig 3D). Even after 1 month DDC withdrawal, scattered liver cells expressed FAT10 (Fig 3B) compare to the control (Fig 3A), indicating a cell memory and heritable epigenetic modification which persisted for one month. Morphometric quantitation of UBD positive cells was performed on the livers used in a previous study16 combined with those used in the present study. The results showed that SAMe prevented these changes and that the UBD positives cells were increased by DDC refeeding (Fig 3E).
Fig 3.
Expression of UBD and UB in the tissue sections. A) FAT10 positives hepatocytes lightly marked x200. B) Fat10 forming hepatocytes persist in the liver after one month withdrawal of DDC x200. C) Fat10 positive hepatocytes markedly increased in number in DDC/Refed Mice x200. D) Fat10 positive hepatocytes did not increase in DDC Refed mice when SAMe was added to the diet x200. E) Quantitation of the number of FAT10 positive liver cells as determinated by using morphometric analysis. (N=3,7,6,2)
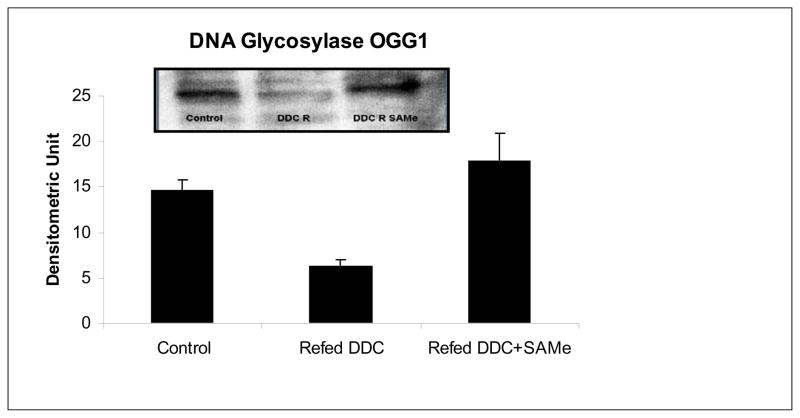
The expression of OGG1 (enzyme repairing oxidized purines) was quantified by Western blot. This expression was down regulated by DDC refeeding and SAMe prevented the down regulation (Fig 4). The down regulation of DNA repair enzyme expression indicated that the rate of mutation during replication of liver cells might increase (Efrati et al, 1999), and lead to the formation of tumors (Frosina, 2007).
Fig 4.
Expression of 8-oxoguanine DNA-glycosylase 1 by Western blot. Refeeding DDC decrease the expression of OGG1. SAMe refeeding restores the expression of OGG1. (C vs DDC R p=0.019, DDC R vs DDC R SAMe p=0.011, N=3)
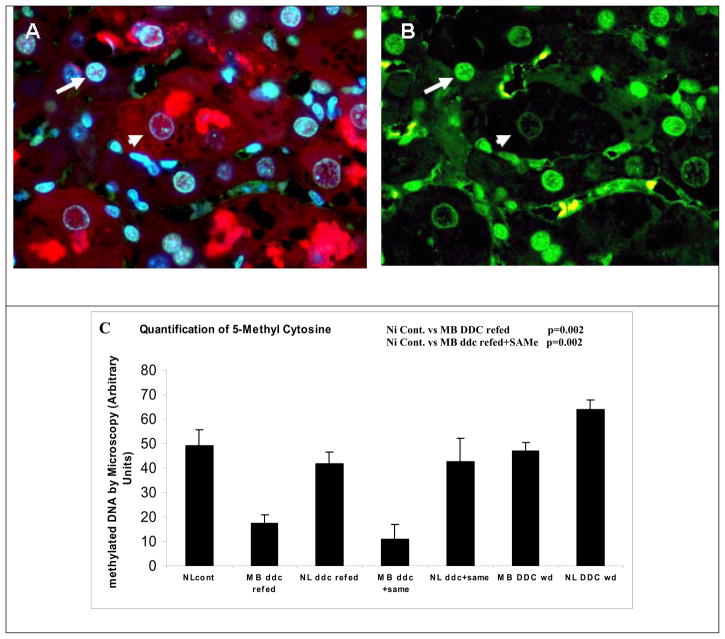
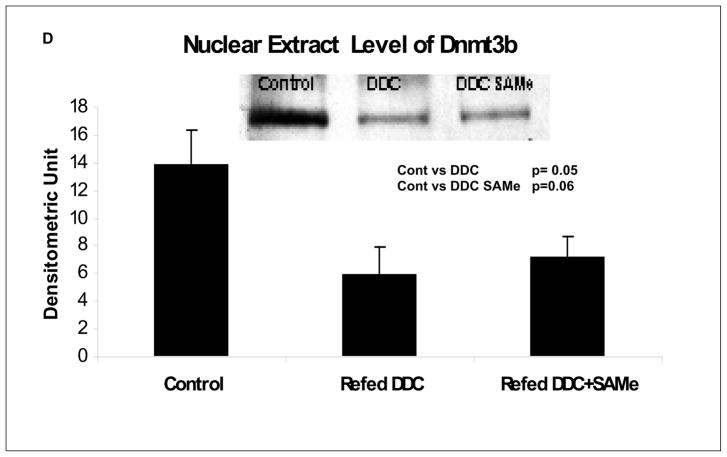
The nuclei of hepatocytes which had formed MDBs fluoresced less intensely using an antibody to 5-methyl cytosine, when compared to the neighboring normal liver cell nuclei (Fig 5A/B). DNA methylation was visualized and measured morphometrically in the nuclei of cells that had formed MDBs compared with neighboring cells which had not formed MDBs. The liver tissue used for this was from mice which had been used in a previous study (Li et al, in press; Oliva et al, 2007) (Fig 5C). The level of 5-methyl cytosine was reduced in the nuclei of hepatocytes forming MDBs whether or not SAMe was given to the mice refed DDC (Fig 5C). The reduction of DNA methylation could be explained by the decrease in the expression of Dnmt3b observed in mice refed DDC (Fig 5D). SAMe treatment didn’t change the decrease in the expression of Dnmt3b induced by DDC, nor did it restore the DNA methylation of the MDB forming cells compared with the normal hepatocytes.
Fig 5.
A/B) Liver double stained for 5 methyl cytosine and ubiquitin. Normal liver cells nuclei (long arrow) and MDB forming liver cell nuclei (short arrow) showing that the DNA methylation was reduced in MDB forming hepatocytes (x200). C) Quantitation of DNA methylation in normal and MDB forming hepatocytes. Methylation was reduced in the nuclei of MDB forming hepatocytes whether or not SAMe was fed with DDC (n=4,5,5,8,8,3) (NL: Normal cells. MB: cells forming MDB). D) Dnmt3b levels in nuclear extracts from mice liver tissue, determinated by Western Blot.
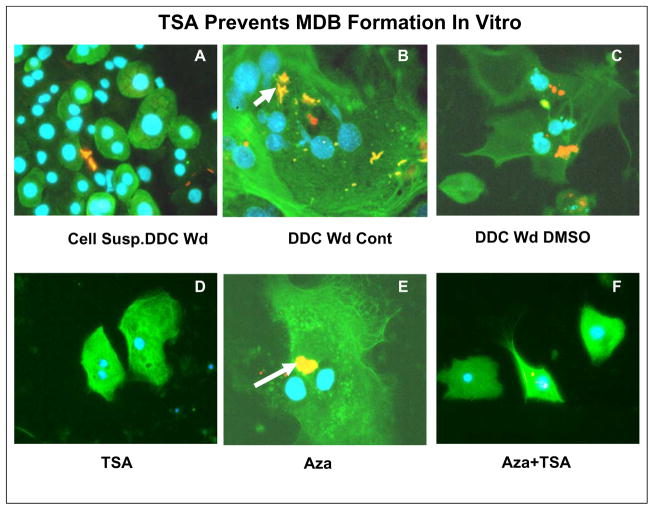
To determine whether methylation of DNA or histone acetylation were involved in the mechanism of MDB formation in vitro, mice were fed DDC for 10 weeks, withdrawn for 1 month, and then used to prepare primary liver cell cultures. Previous studies showed that MDBs spontaneously formed in tissue culture over a 6 day culture period (Wu et al, 2005). The cultures were divided in 6 well plates and treated with TSA or 5-Aza-cytidine (Christman, 2002), or the combination of TSA and 5-Aza-cytidine (Fig 6). Fig 6A shows the cell suspension of the isolated hepatocytes from a DDC Wd mouse. The liver cells were viable and stained positive for CK8, (green) but a few extracellular MDBs (yellow) were also present using a double stain (CK8 green, ubiquitin red, colocalized yellow) (Fig 6A). After 6 days culture, the DDC withdrawn mouse liver cells spontaneously formed numerous MDBs, which also stained yellow (double stained colocalized CK8 and ubiquitin) (Fig 6B, C). TSA prevented MDB formation (Fig 6D, F) whereas 5-Aza-cytidine did not (Fig 6E). The results indicated that regulation of acetylation was involved in MDB formation, since TSA is a deacetylase inhibitor. 5-Aza-cytidine did not inhibit MDB formation.
Fig 6.
Tissue culture showing MDB formation in vitro using primary cultures from 1 month DDC withdrawn (wd) mice n=9 CK8/UB double immunostain (x800). A) Cell suspension of DDC Wd mouse. B) 6 day primary culture from a DDC Wd mouse where numerous MDBs (arrows) had spontaneously formed in large multinucleated hepatocytes. C) DDC Wd hepatocytes with DMSO vehicle added where MDBs formed. D) DDC Wd hepatocytes where TSA was added. No MDBs were formed. E) DDC Wd hepatocytes where Aza was added, MDBs formed (arrow). F) DDC Wd hepatocytes with both TSA and Aza were added, residual tiny MDBs had persisted in the middle hepatocyte (x800).
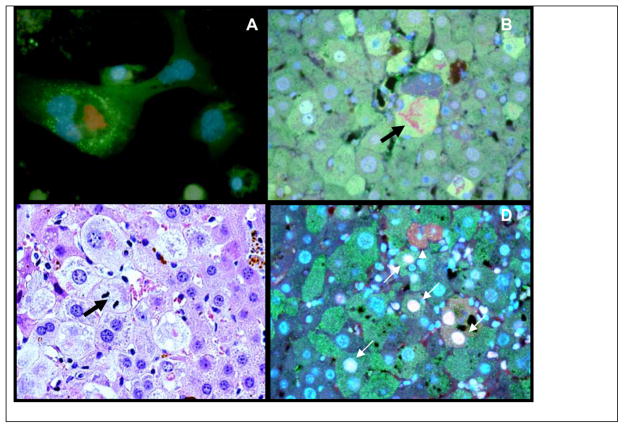
Cell, that formed MDBs in tissue culture, stained positive for UBD after 6 days in culture (Fig 7A), as did liver cells that had forming MDBs in vivo (Fig 7B). The MDB forming hepatocytes during DDC refeeding, out grew the normal hepatocytes in vivo, as indicated by the frequent mitosis observed in the MDB forming hepatocytes (Fig 7C). The cells forming MDBs had a growth advantage compared to the neighboring cells. Fig 7D showed an over expression of UBD in the liver cells from mice refed DDC. A marker for proliferation, PCNA (Moldovan et al, 2007), was expressed predominantly in the nuclei of the cells which were over expressing UBD. This provided a link between UBD expression and the proliferation of the UBD positive liver cells (white arrows). There were also cells present which were in telophase (arrow head) (Fig 7D).
Fig 7.
A) Drug primed tissue culture UB/FAT10. Spontaneous formation of MDB after 6 days in primary culture x800. B) Mouse refed DDC plus SAMe. Note: the red MDB within a Fat10 Positive Cell x800 (Arrow). C) Liver cell in mitosis which had formed a MDB (Arrow) in the liver tissue from a mouse refed DDC 7 Days. Note: The UB positive immunostained MDB forming hepatocytes have a growth advantage (are proliferating) compared to neighboring normal hepatocytes (x800). D) Liver cell from DDC refed mouse double stained with UBD (Green) and PCNA (White) (white arrows). One cell is in telophasis (arrow head) (x800).
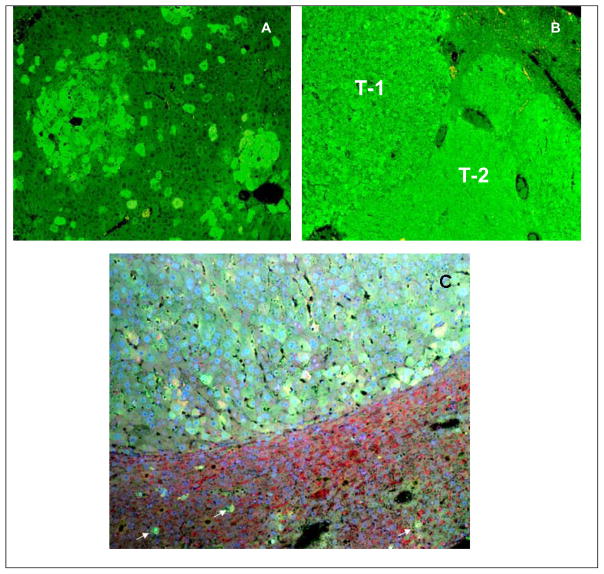
Previous studies have shown that DDC withdrawn mouse liver cells retained the epigenetic cellular memory to form MBDs when refed DDC (Li et al, in press; Oliva et al, 2007). The memory lasted for at least 4 months. These mice developed numerous tumors in the liver after many months of DDC withdrawal (Nan et al, 2006a). In the present study, the cellular memory in the form of UBD positive hepatocytes was present in the livers of mice which were withdrawn from DDC for 8–14 months (Fig 8A/B). Most of the livers showed scattered UBD positive hepatocytes, which were located mostly around the central veins (Fig 8A). However, small tumor-like clusters of UBD positive hepatocytes were also present (Fig 8A). Hepatic cell tumors of various sizes were also UBD positive (Fig 8). Some of the tumor cells formed MDBs (Fig 8C).
Fig 8.
Immunohistochemical stain of UBD of a mice liver tissue. A) Early liver tumors forming in a background of scattered UBD positive preneoplastic hepatocytes in a mouse withdrawn from DDC 11 months (x200). B) Two Fat10 positive tumors T-1 and T-2 after 8 months DDC withdrawal. C) Mouse liver tumor that stained positive for UBD from a mouse withdrawn from DDC for 8 Months (x80). The tumor cells have formed MDBs. Scaterred single UBD positive hepatocytes are present in the surrounding liver (white arrows).
DISCUSSION
There is a clinical link between MDB formation in chronic hepatitis with cirrhosis and hepatocellular carcinoma formation (Nakanuma, Ohta, 1985). In the present study, drug-induced MDB forming cells and tumor formation were linked as an epigenetic phenomenon. The results supported the concept that MDB formation was the result of a change in the cellular memory of liver cells as a result of epigenetic changes in gene expression regulation. These changes were global in nature and included changes in gene expression in all functional categories. This would likely be the result of a heritable modification of histones and DNA, since the changes in FAT10 expression persisted for 14 months. At this time, FAT10 positive tumors had formed. The epigenetic memory of MDB formation is a nonspecific response to a large variety of different types of liver cell injury (French et al, 2001) that are linked to proliferation response signaling (Roomi et al, 2006; Nan et al, 2006b; Wu et al, 2005).
The evidence that methylation and acetylation of histones and methylation of DNA are responsible for the phenotypically changed MDB forming hepatocytes is as follows: 1. MDBs persisted for at least 4 months after drug withdrawal indicating the cellular memory of the gene expression response to refeeding the drug (Li et al, in press; Oliva et al, 2007). 2. The formation of MDBs and the gene expression response to drug refeeding was inhibited by S-adenosylmethionine (SAMe) (Li et al, in press; Oliva et al, 2007). 3. SAMe prevented MDB formation in vitro (Li et al, in press; Oliva et al, 2007). 4. TSA prevented MDB formation in vitro. 5. SAMe reversed the up regulation of Dnmt3a and HDAC9 expression, induced by drug refeeding (Li et al, in press; Oliva et al, 2007) but not for Dnmt3b. 6. Drug feeding and refeeding increased the acetylation of H3K9 when MDBs formed (Bardag-Gorce et al, 2007) 7.
The MDB forming hepatocytes invariably expressed tumor marker proteins, including UBD (Fat10), gamma glutamyl transpepidase ( Tazawa et al, 1983), GST mu2 (Roomi et al, 2006) and AFP (Nan et al, 2006a) consistent with a preneoplastic phenotype. 8. SAMe feeding prevented an increase in FAT10 positive cells induced by drug refeeding. 9. 5-Aza-cytidine did not prevent MDB formation in vitro. 10. MDB forming cell nuclei had reduced levels of DNA methylation as indicated by morphometric analysis and this did not change with SAMe treatment. 11. Liver tumor formation developed beginning at 8 months of drug withdrawal associated with the persistence of FAT10 positive hepatocytes. The tumor cells stained UBD positive and sometimes formed MDBs. 12. MDB forming cells had a proliferation advantage over adjacent normal hepatocytes (Nan et al, 2006a).
The expression of FAT10 was increased in the livers of the DDC refed mice in the present study and in previous studies and the over expression of FAT10 was prevented by feeding SAMe with DDC (Bardag-Gorce et al, 2007; Li et al, in press; Oliva et al, 2007). FAT10 was known to interact with NEDD8 (Hipp et al, 2004) and MAD2 (Liu et al, 1999). FAT10 belongs to the family of ubiquitin-like proteins, with 2 glycines at the C-terminal similar to ubiquitin, indicating that FAT10 is covalently linked to the lysines of target proteins (Raasi et al, 2001). FAT10 expression was associated with MDB forming cells in vivo and in vitro, including tumors formed after prolonged withdrawal of DDC. This strong association with MDBs and neoplasia indicated that FAT10 was a marker for preneoplastic change. FAT10 was over expressed in 90% of human hepatocellular carcinomas (Lee et al, 2003). FAT10 was also localized within some nuclei in the tumor forming mouse livers and in human hepatocellular carcinomas. FAT10 played a role in regulation of chromosomal stability, where it interacted with MAD2 at the kinetochore during the prometaphase stage of the cell cycle (Ren et al, 2006). When FAT10 was over expressed it caused variability in chromosome number in vitro (Ren et al, 2006) However, in the present study, the incidence of aneuploidy was not changed at any stage, including tumor formation (data not shown).
KLF6 was over expressed when DDC was refed and this change was inhibited by feeding SAMe with DDC refeeding. KLF6 is a zinc finger tumor suppressor gene that is frequently mutated in several human cancers (Song et al, 2006), and forms splicing isoforms (KLF6 SV1) which could act as a dominant negative. The role played and the mechanisms of the isoform formation are not well understood. However, the isoform is known to block KLF6 function and plays a role in the progression of the tumor (Difeo et al, 2006; Narla et al, 2005). Hepatocellular carcinoma cell lines express KLF6 and when this expression was inhibited by RNA intereference in vitro, the following changes were observed: impaired cell proliferation induced G (1)-phase arrest, inhibited cyclin-dependent kinase 4 and cyclin D1 expression, up regulated p53 expression and inhibition of Bcl-Xi expression inducing apoptosis (Sirach et al, 2007).
5-Aza-cytidine did not inhibit MDB formation in vitro, suggesting that DNA methylation was already reduced in the MDB forming cells. 5-Aza-cytidine is a potent inhibitor of Dnmt3a (Schneider-Stock et al, 2005). Dnmt3a was up regulated by DDC refeeding when MDBs formed, and down regulated by SAMe when MDB formation was prevented in vivo (Li et al, in press; Oliva et al, 2007).. The decrease in global methylation of DNA is an early event in tumorigenesis (Christman, 2002). The hypomethylation of some regulatory DNA sequences can activate the transcription of protooncogenes such as c-myc, N-Ras, and retrotransposon, as well as genes encoding proteins involved in genomic instability and tumor cell metastasis (Luczak, Jagodzinski, 2006).
TSA, with or without 5-Aza-cytidine, inhibited MDB formation in vitro, suggesting that histone acetylation may prevent MDB formation in vitro. HDAC levels were increased when DDC was fed and MDBs formed in vivo. H3K9 acetylation was increased both after feeding and refeeding DDC in vivo (Bardag-Gorce et al, 2007). Similarly, HDAC9 and 7a gene expression was up regulated when DDC was refed (Li et al, in press; Oliva et al, 2007). SAMe feeding reduced the expression of HDAC9 when MDB formation was inhibited in vivo (Li et al, in press; Oliva et al, 2007). Since TSA inhibited HDAC activity and MDB formation in vitro, it is possible that deacetylase reduction of histone acetylation may be one factor that is involved in the mechanism of the epigenetic cellular memory of MDB formation. Recently, Roomi et al (2002) showed that the cells forming MDB had a proliferative advantage over normal hepatocytes. The cells forming MDBs over expressed FAT10, similar to the liver tumors (Lee et al, 2003). The hypomethylation of DNA, the over expression of FAT10, the decrease in the expression of OGG1 and the proliferation advantage are all involved in the induction of the formation of tumors in the livers observed over 8 to 14 months of DDC withdrawal.
Both post translational acetylation and methylation of histones (the histone code) determined the epigenetic phenotype of cells. The perturbation of the histone code balance may change the gene expression, phenotype and ultimately tumor formation (Santos-Rosas, Caldasa, 2005). Furthermore, trimethylation of histones, in particular, are regarded as the most robust signal for the establishment of long term epigenetic memory (Jenuwein, 2006). Trimethylation of H3K9, among others, is stable and can persist through mitoses without demethylation over several cell generations (Lachner et al, 2004). H3K9me3 sets the molecular stage for DNA methylation (Volkel, Angrad, 2007).
Acknowledgments
The authors thank Adriana Flores for typing the manuscript. The study was supported by NIH/NIAAA grants 8116 and the Alcohol Center Grant on Liver and Pancreas P50-011999, including the morphology core. The results of this study have been reported in part in an abstract (Oliva et al, 2007)
Abbreviations
- MDB
Mallory Denk Bodies
- FAS
fatty acid synthase
- A2M
alfa 2 macroglobulin
- GGT
gamma glutamyl transferase
- GSTmu2
glutathione S transferase mu2
- GPC3
glypian-3
- AFP
alpha fetoprotein
- DDC
3,5-diethoxycarbonyl-1,4-dihydrocollidine
Footnotes
Publisher's Disclaimer: This is a PDF file of an unedited manuscript that has been accepted for publication. As a service to our customers we are providing this early version of the manuscript. The manuscript will undergo copyediting, typesetting, and review of the resulting proof before it is published in its final citable form. Please note that during the production process errors may be discovered which could affect the content, and all legal disclaimers that apply to the journal pertain.
References
- Bardag-Gorce F, Dedes J, French BA, Oliva J, Li J, French SW. Mallory body formation is associated with epigenetic phenotypic change in hepatocytes in vivo. Exp Mol Pathol. 2007;83:160–168. doi: 10.1016/j.yexmp.2007.03.003. [DOI] [PMC free article] [PubMed] [Google Scholar]
- Bradford MM. A rapid and sensitive method for the quantification of microgram quantities of protein utilizing the principle of protein-dye binding. Anal Biochem. 1976;72:248–254. doi: 10.1006/abio.1976.9999. [DOI] [PubMed] [Google Scholar]
- Cadrin M, Kawahara H, Ohta M, Katsuma Y, Marceau N, French SW. Mallory bodies in hepatomas and hyperplastic nodules in vitro and in vivo studies. Prog Clin Biol Res. 1990;331:231–248. [PubMed] [Google Scholar]
- Canaan A, Yu X, Booth CJ, Lian J, Lazar I, Gamfi SL, Castille K, Kohya N, Nakayama Y, Liu YC, Eynon E, Flavell R, Weissman SM. FAT10/diubiquitin-like protein-deficient mice exhibit minimal phenotypic differences. Mol Cell Biol. 2006;26:5180–9. doi: 10.1128/MCB.00966-05. [DOI] [PMC free article] [PubMed] [Google Scholar]
- Christman JK. 5-Azacytidine and 5-aza-2′-deoxycytidine as inhibitors of DNA methylation: mechanistic studies and their implications for cancer therapy. Oncogene. 2002;21:5483–95. doi: 10.1038/sj.onc.1205699. [DOI] [PubMed] [Google Scholar]
- DiFeo A, Narla G, Hirshfeld J, Camacho-Vanegas O, Narla J, Rose SL, Kalir T, Yao S, Levine A, Birrer MJ, Bonome T, Friedman SL, Buller RE, Martignetti JA. Roles of KLF6 and KLF6-SV1 in ovarian cancer progression and intraperitoneal dissemination. Clin Cancer Res. 2006;12:3730–9. doi: 10.1158/1078-0432.CCR-06-0054. [DOI] [PubMed] [Google Scholar]
- Efrati E, Tocco G, Eritja R, Wilson SH, Goodman MF. “Action-at-a-distance” mutagenesis. 8-oxo-7, 8-dihydro-2′-deoxyguanosine causes base substitution errors at neighboring template sites when copied by DNA polymerase beta. J Biol Chem. 1999;274:15920–6. doi: 10.1074/jbc.274.22.15920. [DOI] [PubMed] [Google Scholar]
- French BA, van Leeuwen F, Riley NE, Yuan QX, Bardag-Gorce F, Lue YH, Marceau N, French SW. Aggresome formation in liver cells in response to different toxic mechanisms. Role of the ubiquitin-proteasome pathway and the frame shift of ubiquitin. Exp Mol Pathol. 2001;71:241–246. doi: 10.1006/exmp.2001.2401. [DOI] [PubMed] [Google Scholar]
- Frosina G. Tumor suppression by DNA base excision repair. Mini Rev Med Chem. 2007;7:727–43. doi: 10.2174/138955707781024544. [DOI] [PubMed] [Google Scholar]
- Hipp MS, Raasi S, Groettrup M, Schmidtke G. NEDD8 ultimate buster-1L interacts with the ubiquitin-like protein FAT10 and accelerates its degradation. J Biol Chem. 2004;279:16503–10. doi: 10.1074/jbc.M310114200. [DOI] [PubMed] [Google Scholar]
- Jenuwein T. The epigenetic magic of histone lysine methylation. FEBS J. 2006;273:3121–3135. doi: 10.1111/j.1742-4658.2006.05343.x. [DOI] [PubMed] [Google Scholar]
- Lachner M, Sengupta R, Schotta G, Jenuwein T. Trilogies of histone lysine methylation as epigenetic landmarks of the eukaryotic genome. Cold Spring Harb: Symp Quant Biol. 2004;69:209–218. doi: 10.1101/sqb.2004.69.209. [DOI] [PubMed] [Google Scholar]
- Lee CG, Ren J, Cheong IS, Ban KH, Ooi LL, Yong Tan S, Kan A, Nuchprayoon I, Jin R, Lee KH, Choti M, Lee LA. Expression of the FAT10 gene is highly upregulated in hepatocellular carcinoma and other gastrointestinal and gynecological cancers. Oncogene. 2003;22:2592–603. doi: 10.1038/sj.onc.1206337. [DOI] [PubMed] [Google Scholar]
- Li J, Bardag-Gorce F, Dedes J, French BA, Oliva J, Amidi F. French SWS-adenosylmethionine prevents Mallory Denk body formation in drug-primed mice by inhibiting epigenetic memory. Hepatology. doi: 10.1002/hep.22029. in press. [DOI] [PMC free article] [PubMed] [Google Scholar]
- Liu YC, Pan J, Zhang C, Fan W, Collinge M, Bender JR, Weissman SM. A MHC-encoded ubiquitin-like protein (FAT10) binds noncovalently to the spindle assembly checkpoint protein MAD2. Proc Natl Acad Sci U S A. 1999;96:4313–8. doi: 10.1073/pnas.96.8.4313. [DOI] [PMC free article] [PubMed] [Google Scholar]
- Luczak MW, Jagodzinski PP. The role of DNA methylation in cancer development. Folia Histochem Cytobiol. 2006;44:143–54. [PubMed] [Google Scholar]
- Meierhenry EF, Rubner B, French SW. Mallory body formation in hepatic nodules of mice ingesting dieldrin. Lab Invest. 1981;44:392–396. [PubMed] [Google Scholar]
- Meierhenry EF, Rubner B, French SW. Mallory bodies in hepatic tumours. Hepatology. 1983;3:90–95. doi: 10.1002/hep.1840030115. [DOI] [PubMed] [Google Scholar]
- Moldovan GL, Pfander B, Jentsch S. PCNA, the maestro of the replication fork. Cell. 2007;129:665–79. doi: 10.1016/j.cell.2007.05.003. [DOI] [PubMed] [Google Scholar]
- Nagao Y, French BA, Cai Y, French SW, Wan YS. Inhibition of PPAR/RXR-mediated direct hyperplasia pathways during griseofulvin induced hepatocarcinogenesis. J Cell Biochem Microbiol Mol Genet. 1998a;69:189–200. doi: 10.1002/(sici)1097-4644(19980501)69:2<189::aid-jcb9>3.0.co;2-o. [DOI] [PubMed] [Google Scholar]
- Nagao Y, Yuan QX, Wan YJY, French BA, French SW. Pathogenesis of Mallory bodies formation: studies using the drug-primed mouse model. Hepatol Res. 1998b;13:42–54. [Google Scholar]
- Nagao Y, Wan YJY, Yuan QX, Kachi K, Marceau N, French SW. Mouse model of hyperplastic nodule formation. Characterization of mRNA expression. Hepatol Res. 1999;15:110–123. [Google Scholar]
- Nakanuma Y, Ohta G. Is Mallory body formation a preneoplastic change? A study of 181 cases of liver bearing hepatocellular carcinoma and 82 cases of cirrhosis. Cancer. 1985;55:2400–2404. doi: 10.1002/1097-0142(19850515)55:10<2400::aid-cncr2820551017>3.0.co;2-b. [DOI] [PubMed] [Google Scholar]
- Nan L, Bardag-Gorce F, Wu Y, Li J, French BA, French SW. Mallory body forming cells express the preneoplastic hepatocyte phenotype. Exp Mol Pathol. 2006a;80:109–118. doi: 10.1016/j.yexmp.2005.11.001. [DOI] [PubMed] [Google Scholar]
- Nan L, Dedes J, French BA, Bardag-Gorce F, Li J, Wu Y, French SW. Mallory body (cytokeratin aggresomes) formation is prevented in vitro by p38 inhibitor. Exp Mol Pathol. 2006b;80:228–240. doi: 10.1016/j.yexmp.2006.01.003. [DOI] [PubMed] [Google Scholar]
- Narla G, DiFeo A, Yao S, Banno A, Hod E, Reeves HL, Qiao RF, Camacho-Vanegas O, Levine A, Kirschenbaum A, Chan AM, Friedman SL, Martignetti JA. Targeted inhibition of the KLF6 splice variant, KLF6 SV1, suppresses prostate cancer cell growth and spread. Cancer Res. 2005;65:5761–8. doi: 10.1158/0008-5472.CAN-05-0217. [DOI] [PubMed] [Google Scholar]
- Oliva JV, French BA, Amidi F, Bardag-Gorce F, Li J, Dedes J, McPhaul L, French SW. Mallory body formation is an epigenetic phenomenon which is prevented by treatment with SAMe. Abstract Hepatology 2007 [Google Scholar]
- Raasi S, Schmidtke G, Groettrup M. The ubiquitin-like protein FAT10 forms covalent conjugates and induces apoptosis. J Biol Chem. 2001;276:35334–43. doi: 10.1074/jbc.M105139200. [DOI] [PubMed] [Google Scholar]
- Ren J, Kan A, Leong SH, Ooi LL, Jeang KT, Chong SS, Kon OL, Lee CG. FAT10 plays a role in the regulation of chromosomal stability. J Biol Chem. 2006;281:11413–21. doi: 10.1074/jbc.M507218200. [DOI] [PubMed] [Google Scholar]
- Roomi MW, Gaal K, Yuan QX, French BA, Fu P, Bardag-Gorce F, French SW. Preneoplastic liver foci expansion induced by throacetamide toxicity in drug-primed mice. Exp Mol Pathol. 2006;81:8–14. doi: 10.1016/j.yexmp.2006.02.006. [DOI] [PubMed] [Google Scholar]
- Santos-Rosa H, Caldasa C. Chromatin modifier enzymes, the histone code and cancer. Europ J Cancer. 2005;41:2381–2402. doi: 10.1016/j.ejca.2005.08.010. [DOI] [PubMed] [Google Scholar]
- Schneider-Stock R, Diab-Assef A, Folter-Jourdainne C, Boltze C, Hartig R, Schonfeld P, Roessner A, Gali-Muhtasik H. 5 aza-cytidine is a potent inhibitor of DNA methyltransferase 3a and induces apoptosis in HCT-116 colon cancer via Gadd 45—and p53-dependent mechanisms. J Pharmacol Exp Therap. 2005;312:525–536. doi: 10.1124/jpet.104.074195. [DOI] [PubMed] [Google Scholar]
- Sirach E, Bureau C, Péron JM, Pradayrol L, Vinel JP, Buscail L, Cordelier P. KLF6 transcription factor protects hepatocellular carcinoma-derived cells from apoptosis. Cell Death Differ. 2007;14:1202–10. doi: 10.1038/sj.cdd.4402114. [DOI] [PubMed] [Google Scholar]
- Song J, Kim CJ, Cho YG, Kim SY, Nam SW, Lee SH, Yoo NJ, Lee JY, Park WS. Genetic and epigenetic alterations of the KLF6 gene in hepatocellular carcinoma. J Gastroenterol Hepatol. 2006;21:1286–9. doi: 10.1111/j.1440-1746.2006.04445.x. [DOI] [PubMed] [Google Scholar]
- Tazawa J, Irie T, French SW. Mallory body formation run parallel to gamma glutamyl transferase induction in hepatocytes of griseofulvin fed mice. Hepatology. 1983;3:989–1001. doi: 10.1002/hep.1840030617. [DOI] [PubMed] [Google Scholar]
- Volkel P, Angrad PO. The control of histone lysine methylation in epigenetic regulation. Biochimie. 2007;89:1–20. doi: 10.1016/j.biochi.2006.07.009. [DOI] [PubMed] [Google Scholar]
- Wu Y, Nan L, Bardag-Gorce F, Li J, French BA, Wilson LT, Dedes J, French SW. Role of ERK activated by laminin-integrin in signaling trigged MB formation. An in vivo and in vitro study. Exp Mol Pathol. 2005;79:1–8. doi: 10.1016/j.yexmp.2005.03.005. [DOI] [PubMed] [Google Scholar]


