Abstract
Metabolomics experiments seldom achieve their aim of comprehensively covering the entire metabolome. However, important information can be gleaned even from sparse datasets, which can be facilitated by placing the results within the context of known metabolic networks. Here we present a method that allows the automatic assignment of identified metabolites to positions within known metabolic networks, and, furthermore, allows automated extraction of sub-networks of biological significance. This latter feature is possible by use of a gap-filling algorithm. The utility of the algorithm in reconstructing and mining of metabolomics data is shown on two independent datasets generated with LC–MS LTQ-Orbitrap mass spectrometry. Biologically relevant metabolic sub-networks were extracted from both datasets. Moreover, a number of metabolites, whose presence eluded automatic selection within mass spectra, could be identified retrospectively by virtue of their inferred presence through gap filling.
Electronic supplementary material
The online version of this article (doi:10.1007/s11306-009-0196-9) contains supplementary material, which is available to authorized users.
Keywords: Metabolic network, Graph algorithm, Gap-filling, Metabolomics
Introduction
Studies into metabolism have generally concentrated on individual metabolic pathways with a focus on specific metabolic functions (e.g. glycolysis). The development of global and high throughput metabolomic techniques has made it possible to investigate metabolism at the scale of the global metabolic network, which is the union of all pathways and can be formally defined as “a collection of objects and the relations among them. The objects correspond to chemical compounds, biochemical reactions, enzymes and genes” (Lacroix et al. 2008).
The representation proposed by the BioCyc Cellular Overview is an increasingly popular style of visualising individual pathways in many organisms (Paley and Karp 2006) (Fig. 1a, a′). Within the BioCyc architecture, nodes belonging to different pathways are duplicated, since the objective of that visualisation is to prioritise the pathway as the central feature (see (Bourqui et al. 2007) for a discussion on node duplication). Such duplication of nodes is advantageous when considering individual pathways, but fails to capture linkage information of metabolites belonging to multiple pathways. Insight into the whole network is gained by removing duplication and connecting metabolites to all possible neighbours. However, this results in a much higher complexity as can be seen in Fig. 1, where the nodes representing identified metabolites were coloured green (Fig. 1b, b′). Zooming into local parts of the total representation reveals a dense mesh of edges, caused by the high degree of connectivity across the network (Jeong et al. 2000) (Fig. 1c, c′). This complexity confounds the objective of creating interpretable metabolomics networks. A major aim therefore, is to reduce the complexity of the visual representations of metabolic networks, thus enabling extraction of relevant information. To do so, we have developed a method that constructs a sub-network containing the selected metabolites, regardless of their occurrence in disparate metabolic pathways. Fig. 2 shows the result of this method (note that all of the identified metabolites are present in the drawing and most of them are connected).
Fig. 1.
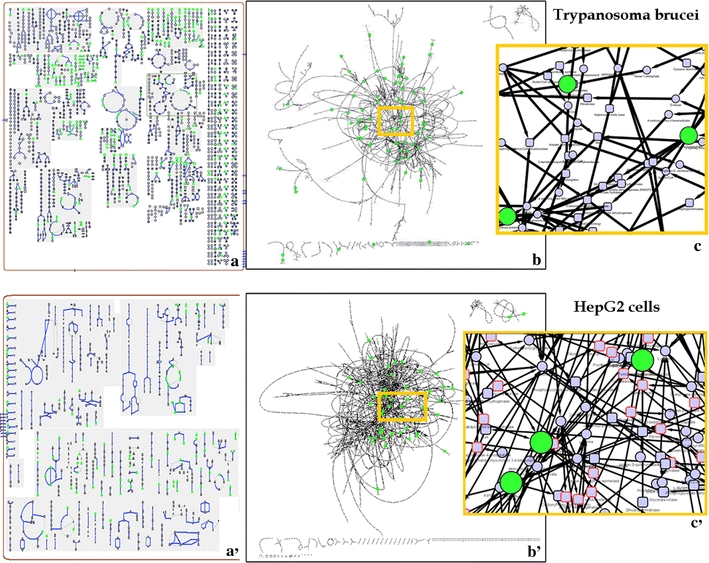
Each panel corresponds to one of two separate datasets: the upper panel is from Trypanosma brucei and the lower from HepG2 cells (human liver cells). a, a′ Parts of cellular overview diagram from BioCyc, grey boxes represent pathways and green nodes identified metabolites. b, b′ Metabolic network visualized using Cytoscape, green nodes are identified metabolites. c, c′ Zoomed in view of the network
Fig. 2.
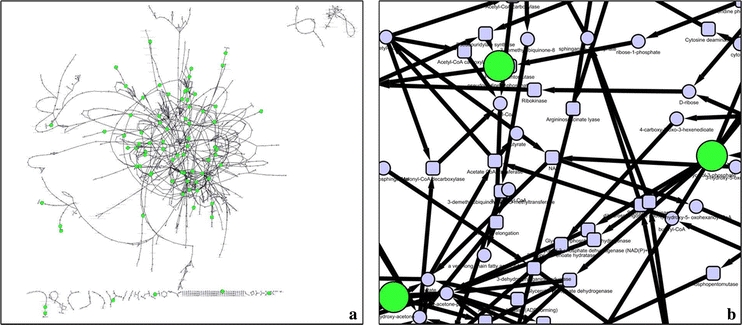
a Trypanosoma brucei metabolic network (derived from the BioCyc database) with identified metabolites highlighted in green. b Sub-network extracted by our method where all the identified metabolites are present (green nodes), reactions and metabolites, whose presence is inferred based on the BioCyc reconstruction, were added to create a pseudo-complete and descriptive sub-network (smaller nodes)
Truly comprehensive “metabolomic” data acquisition does not yet exist. A variety of measurement tools (e.g. LC–MS, GC–MS) and extraction methods (e.g. ethanol, acetonitrile, methanol, water and various gradients) exist (Fiehn 2001), but the combination of all approaches in individual experiments is rarely possible. Networks built solely on identified metabolites from such sparse datasets have limits to their overall utility. Approaches where inference is combined with observation, can, therefore, be helpful in terms of data mining. Here we introduce a methodology that applies such an approach to two datasets acquired with the high-resolution LTQ-Orbitrap in an LC–MS setup. The first dataset is derived from the parasitic protozoan Trypanosoma brucei, which is the causative agent of human African trypanosomiasis (Barrett et al. 2007). The second dataset is derived from human liver cells (HepG2). We were able to extract biologically relevant metabolic sub-networks for both datasets. The gap filling process allowed us to connect identified metabolites and detection of metabolites that had been discarded during the data pre-processing or simply were not detected due to the LTQ-Orbitrap configuration.
The algorithm presented in this article can be used on our web server called MetExplore (http://metexplore.toulouse.inra.fr/metexplore/).
Materials and methods
Metabolomics data generation and processing
Metabolite extraction from trypanosomes
Metabolite extraction and quantification was performed as described in (Kamleh et al. 2008).In brief, pooled cells were pelleted at 1,250 RCF (4°C, 10 min), re-suspended in 1 ml of serum free medium, and kept on ice whilst measuring cell density. The volume was adjusted to a final concentration of 109 cells/ml, and the cells incubated at 28°C for 30 min to allow steady-state metabolism to re-establish. Total metabolites were extracted by adding 200 μl of concentrated cell suspension (at 109 cells/ml) to 800 μl of 100% ethanol at 80°C for 2 min. For the measurements, a ZIC-HILIC HPLC (5 μm 150 × 4.6 mm; HiChrom, Reading UK) was coupled to an LTQ-Orbitrap (Thermo Scientific). Both positive and negative ionization centroid mode were registered in two separate runs, with a mass scanning range of 50–1200 m/z and a resolution of 30,000.
Metabolite extraction from HepG2 cells
HepG2 cells were grown in DMEM medium supplemented with FBS, l-glutamine, penicillin and streptomycin. Medium was removed and kept at −20°C (medium sample) and cells were scraped into acetonitrile/water (50:50, v:v) and frozen (cell sample). Medium and cell samples were concentrated under vacuum. Proteins were precipitated by adding ethanol and centrifugation. Supernatants were concentrated again by vacuum before LC–MS analysis. LC was performed on a C18 column (2 mm I.D.) using H2O/acetonitrile gradient elution.
Mass spectrometric data were generated on an LTQ-Orbitrap hybrid instrument coupled to a Surveyor LC system. Samples were diluted tenfold before injection (10 μl) onto a Hypercarb LC column (Thermo Fisher, Les Ulis, France). Compounds were separated using a water–0.5% acetic acid (solvent A) and acetonitrile (solvent B) gradient at a flow rate of 0.2 ml/min by varying solvent B. Mass spectrometric acquisition was carried out using positive electrospray ionisation and collecting data from m/z 100 to m/z 700 at a resolution power of 30,000. Exact mass measurements were achieved by external calibration.
Data processing
Data for the HepG2 cell was recorded in profile mode and converted to centroid mode with ReadW (http://sashimi.sourceforge.net/software_glossolalia.html). Signals were extracted with a “greedy” approach, resulting in all real signals but also a large number of noise signals. Signals from technical and biological replicates were grouped together into a replicate-set. For this project only reproducible signals were considered of interest, expressed as a RSD (Relative Standard Deviation) value of less than 35%. The LTQ-Orbitrap is expected to quantify metabolites from the same sample reproducibly within 20% (Shah et al. 2000), which was extended to take minor biological variation into account. After this step the replicate sets are combined into one global set. Peaks removed by the RSD filter matching reproducible peaks of the other set were recovered. The remaining noise was removed with the CoDA-DW approach (Windig et al. 2005). As a last measure extensive de-isotoping and other related peak removal based on correlation analysis of intensity patterns and peak shapes is performed (Scheltema et al.; bioanalysis December 2009—in press), ensuring that mostly signals of interest are included for further analysis.
Metabolic networks
Mass mapping
High resolution mass spectrometry facilitates identification of metabolites by exact mass mapping to, for example, the KEGG database (Breitling et al. 2006). This mapping is not completely satisfactory as isomeric compounds (e.g. fructose and glucose) cannot be discriminated, unless standard compounds are used as reference for retention time comparison, or use of orthogonal approaches such as fragmentation patterns generated by tandem mass spectrometry. In addition, the electrospray ionisation process is known to be subject to matrix effects and ion suppression (Annesley 2003) and to some selectivity, thus hindering collection of certain compounds (Cech and Enke 2001). In our approach we chose to take all the possible isomers for a given exact mass into account as a first approximation, with a user definable mass range of 2 ppm. This approach is similar to that proposed in Masstrix (Suhre and Schmitt-Kopplin 2008), which is a web server allowing mass mapping to KEGG maps. To circumvent the limitations of mass mapping, however, the application can also be supplied with a list of BioCyc identifiers instead of the masses. In this case it is assumed that the user has made a correct interpretation of the mass spectrum.
Network reconstruction
Both networks were derived from metabolic reconstructions made by the Pathologic tool used to build BioCyc-like databases (Karp et al. 2002). This tool determines a putative list of biochemical reactions by comparing a list of around 7,500 genes (from curated metabolic data of more than 1,600 organisms) with assigned enzymatic functions to the genome of the organism in question. The appropriate data for Trypanosoma brucei and Human dataset was derived from TrypanoCyc (Chukualim et al. 2008) and HumanCyc (Romero et al. 2005) respectively.
Graph model and filtering
The metabolic network was modelled as a bipartite graph, which is composed of two types of nodes: corresponding here respectively to the reactions and to the metabolites (see Fig. 3). There is an edge between a metabolite and a reaction node if the metabolite is a substrate of the reaction, and there is an edge between a reaction and a metabolite node if the reaction produces the metabolite. Each edge has an arrow indicating its relation to the reaction and reaction nodes are filled with a colour according to their reversibility. Unlike simple metabolic graphs, which are characterised by a single type of node (compounds or reactions), the models represented here depict the complete linkage pattern between the set of substrates and the set of products of a reaction. In those cases where the direction of the reaction is not strictly defined in the metabolic databases, the direction is determined as follows: if a reaction occurs in the same direction, whatever the metabolic pathway in MetaCyc, then the reaction is considered irreversible and a direction is assigned. Conversely, if a reaction occurs in two directions according to MetaCyc pathway attributes, then the reaction is assigned as reversible. As any reaction can be reversible under the correct thermodynamic conditions we confine ourselves, in this first approximation, to database assignments on reversibility, although manual curation is possible.
Fig. 3.
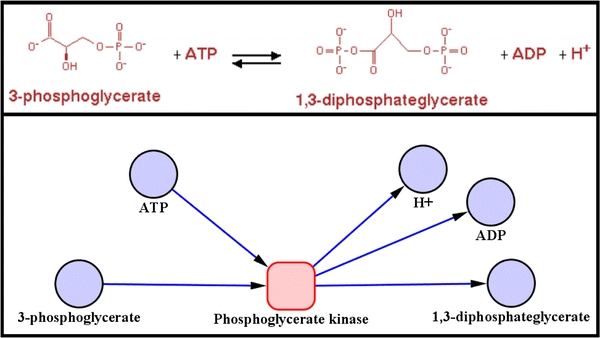
The upper panel shows a textual description of a reaction. The lower panel shows the bipartite graph modelling of this reaction. Blue nodes are metabolite and the pink node is the reaction. Arrows indicate the direction of a reaction, but in that case the reaction is reversible which is indicated by red border of the reaction node
To obtain a faithful and interpretable metabolic network it is necessary to apply filters to the primary network built on all metabolites and reactions listed in a database. For example nodes that short circuit the network (e.g. water and the common “currency metabolites” including ATP, ADP, NAD(H), NADP(H) and other cofactors) as well as higher molecular weight cellular components (nucleic acids, proteins, glycoconjugates etc.) must be pruned (Arita 2004). For this purpose, we used a published list of 59 cofactor transformations (Handorf et al. 2008), of which 32 were present in the T. brucei network and 44 in the Homo sapiens network. The reduced T. brucei metabolic network contains 925 reactions, 922 compounds, and 2113 edges and the reduced Homo sapiens metabolic network (considered here as the HepG2 network) contains 1,416 reactions, 1,402 compounds, and 3,379 edges. Finally, the filtered metabolic network was exported into edge-lists and attribute files, which can be read by the biochemical network visualization software Cytoscape (Shannon et al. 2003).
Metabolic sub-network extraction and gap filling
Sub-network extraction
The simplest method of extracting sub-networks involves retaining only those metabolites identified in a given experiment. In this case a reaction is kept when its substrates and products are present in the set of all identified metabolites (for example see Fig. 4a, c). However, such a sub-network can be very sparse and difficult to interpret. For instance, when applying this method to the T. brucei dataset, 17 of the 91 identified metabolites are not connected to any other metabolites (isolated nodes on Fig. 4c) and thus cannot be integrated directly into a metabolic reaction or a metabolic process. To overcome this problem we propose to extend the sub-network extraction using a gap filling algorithm.
Fig. 4.
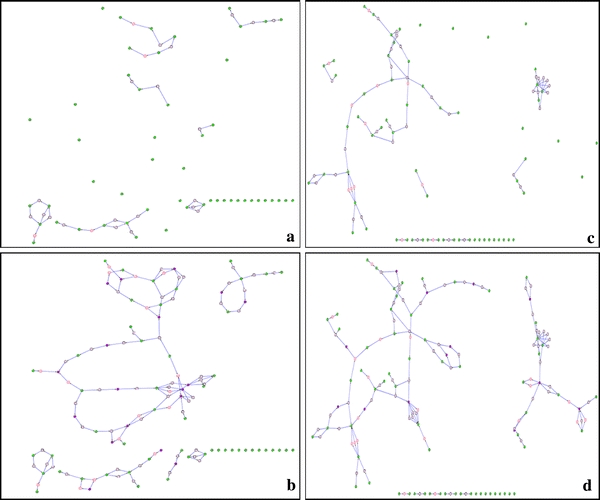
a Sub-network extracted with only identified compounds for HepG2 cells. b Sub-network with gaps filled for HepG2 cells. c Sub-network extracted with only identified compounds for the trypanosome. d Sub-network with gap filled for the trypanosome
Gap filling
Several methods already exist for finding paths between two metabolites (Arita 2000; Rahman et al. 2005). However, these methods do not check the availability of the co-substrates, while in fact a reaction should be taken into account if all its co-substrates are present. For instance in Fig. 5b metabolite H belongs to a path connecting E and I, but the reaction requires F if it is to be fired. This notion of co-substrate necessity is used by the method which looks for the scope of a set of compounds, where the scope is the set of compounds that can be produced from a set of seed compounds (Handorf et al. 2005). The method to compute such a scope is iterative. At each iteration, the reactions are considered and found feasible (fired) if all of its substrates are in the seed set. When this is the case, all of the products of the reactions are added to the seed set and the method re-iterates. The process stops when the last iteration fails to fire any reaction. Figure 5c shows the scope on a set of identified compounds, note that H is not in the scope as F is not an available compound.
Fig. 5.
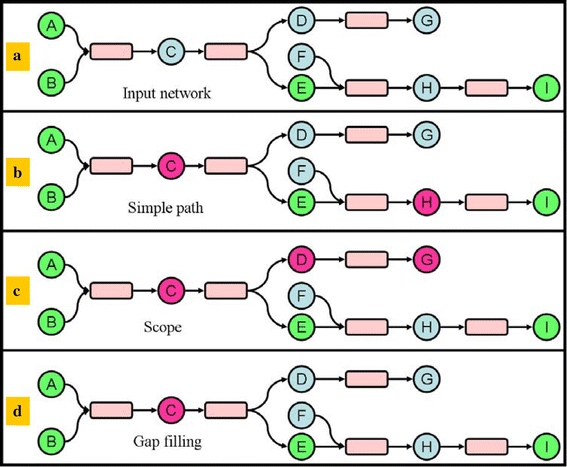
Different options to connect identified metabolites. a The input network where green nodes are identified metabolites. b Purple nodes belong to simple paths between identified metabolites. c Purple nodes belong to the scope of all the identified metabolites. d Purple nodes belong to a path defined by our gap filling algorithm
Our approach improves this since we do not take metabolites into account that are not on the path between two identified metabolites. For instance metabolites D and G in Fig. 5 will not be selected. The adapted scope algorithm works as follows. For each identified metabolite we look at all of the reactions that use this metabolite as a substrate. If all of the other substrates of this reaction are present in the dataset, we consider all of the products of the reaction as potential candidates. For each of these candidates, we search the list of all reactions for which the candidate is a substrate. If for at least one of these reactions all required substrates and products are present in the dataset, we consider that the metabolite in question is a relevant candidate. Finally, we add both the candidate metabolite and the associated reactions which helped us to localise it in the sub-network of the previous iteration. With this method only single metabolite gaps are captured, but by rerunning the process multiple times larger gaps can be filled. We have tried this, however the significance of these results (discussed in the next section) and the biological relevance of networks built with a single gap barely improved on subsequent iterations.
Results and discussion
Statistical significance of sub-networks
In order to asses the quality of sub-networks we compute their statistical significance. The P-values obtained measure the probability that a random set of metabolites results in a more connected sub-network than one computed using the measured dataset. This is similar to the approach presented by (Antonov et al. 2009). However, our method can result in multiple separately connected components, making it necessary to analyze the sub network individually. On the two datasets presented here, a single iteration of the gap filling algorithm resulted in a significant p-value of below 0.01 (verbatim use of the algorithm presented by Antonov et al. resulted in similar significance). When iterating the process P-values below 0.01 were also found.
Obtaining improved connectivity
Figure 4b and d show the result of our algorithm on the two different datasets studied here. For the T. brucei dataset (Fig. 4c, d) the number of unconnected compounds reduces from 17 to 9. The number of connected components (i.e. a sub-network in which any two nodes are connected by paths) is 17 (as opposed to 27 before application of the algorithm). For the HepG2 dataset the number of unconnected compounds reduces from 22 to 17. The number of connected components is 20 (as opposed to 27 before application of the algorithm). A comparison was also made for multiple iterations of the gap-filling procedure. However, the gain of connectivity was low, while the sub-network grew denser at each iteration (data not shown).
Biological relevance of sub-networks
Trypanosomes contain an unusual “signature” metabolite, trypanothione, that comprises two molecules of glutathione linked through a spermidine. Its presence, along with metabolites involved in its biosynthesis, offers an interesting proof of concept for the pathway extraction method. Fig. 6 shows that the trypanothione biosynthetic pathway sub-network was indeed correctly extracted.
Fig. 6.
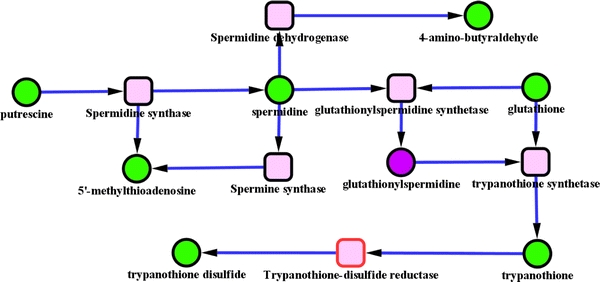
Green nodes are metabolites identified in the dataset. Purple nodes are the ones inferred by our gap filling method. Square nodes are reactions nodes, when the border is red it means that the reaction can occur in both directions. This pathway is part of amino acids degradation. The sub-network reported here was produced from the current version of Trypanocyc. It is notable that this version has not benefited from expert pruning so the reactions catalysed by spermine synthase and spermidine dehydrogenase have not been reported in T. brucei. Furthermore the reaction catalysed by trypanothione reductase, usually converts the oxidised form of trypanothione to its reduced form, which is then involved in multiple cellular reductions prior to its being enzymatically reconverted to the reduced form
The HepG2 cells were derived from a human hepatocellular carcinoma and are a commonly used hepatocyte model cell line. The subnetworks we extracted dealt with major hepatic metabolic pathways, such as deamination of amino-acids and catabolism of nucleic acids. We identified some metabolites from the urea cycle (including citrulline and arginine), which occurs specifically in the liver. Moreover, glutamine and glutamate were also present in the liver. Finally, metabolites associated with purine (Fig. 7a) and pyrimidine (Fig. 7b) pathways were detected (adenosine, hypoxanthine, cytosine and uracil). These pathways are linked by ribose 1-phosphate (whose presence is inferred from the reconstruction method) and also converge in production of ammonia whose presence is also inferred (ammonia being too small to be found in the mass spectrometry experiments used here) and links the urea cycle and glutamate metabolism in liver. This demonstrates how sparse datasets can be linked across modules using the automated procedure outlined here.
Fig. 7.
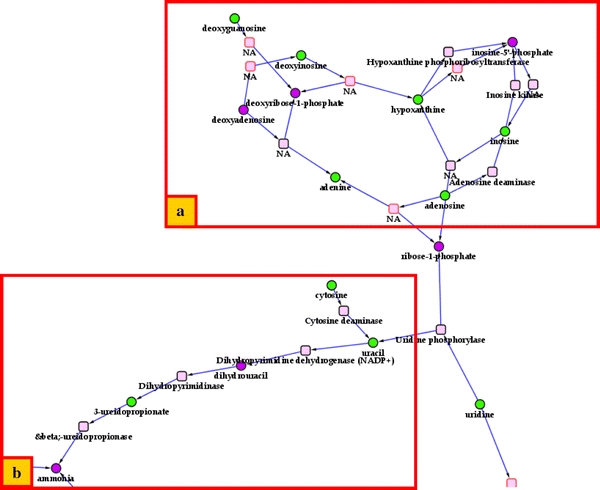
Sub-networks for HepG2 cell experiment. a Purine pathway. b Pyrimidine pathway
The gap filling process enhances metabolomics raw data processing
To obtain a comprehensive view using mass spectrometry requires a combination of different sample preparation techniques, solvents, chromatography types and detection systems. Comprehensive metabolomics is thus seldom, if ever, possible for most experimental setups. An example of such a sparse collection is the HepG2 dataset, which was acquired only in positive ionisation mode with a mass range of 100–700 amu. Thus all metabolites exclusively detectable in negative ionisation mode or outside the mass range are not included in the dataset. Additionally, a number of metabolites were removed from the dataset by the pre-processing method. However, by exploiting the gap filling process it was possible to extract parts of the network which contained precisely those metabolites (see Table 1 for a complete overview). For example, several acidic compounds such as 2-keto-6-aminocaproate, 4-(3-pyridyl)-3-butenoate, O-succinyl-homoserine or phosphorylated compounds were not observed, likely due to unfavourable ionisation conditions (although these conditions notably did allow the detection of phenylpyruvate) while their presence could be inferred based on the presence of observed masses and using the gap-filling algorithm within the context of the known metabolic network.
Table 1.
List of predicted metabolites using the gap filling method
| Name | Formula | Massa | Observation |
|---|---|---|---|
| Ammonia | H3N1 | 17.02600 | Below mass acquisition range |
| Acetaldehyde | C2H4O1 | 44.02567 | Below mass acquisition range |
| Glycine | C2H5N1O2 | 75.03148 | Below mass acquisition range |
| l-Alanine | C3H7N1O2 | 89.04713 | Bellow mass acquisition range |
| Dihydrouracil | C4H6N2O2 | 114.04238 | Observed |
| 5-Aminopentanamide | C5H12N2O1 | 116.09441 | Observed |
| l-Cysteine | C3H7N1O2S1 | 121.01920 | Observed |
| l-Glutamate gamma-semialdehyde | C5H9N1O3 | 131.05769 | Observed |
| l-Homocysteine | C4H9N1O2S1 | 135.03485 | Not observed in positive mode |
| 2-Keto-6-aminocaproate | C6H11N1O3 | 145.07334 | Not observed in positive mode |
| 4-(3-Pyridyl)-3-butenoate | C9H9N1O2 | 163.06278 | Not observed in positive mode |
| Phenylpyruvate | C9H8O3 | 164.04680 | Observed |
| O-Phospho-l-homoserine | C4H10N1O6P1 | 199.02402 | Not observed in positive mode |
| Deoxyribose 1-phosphate | C5H11O7P1 | 214.02369 | Not observed in positive mode |
| O-Succinyl-l-homoserine | C8H13N1O6 | 219.07374 | Not observed in positive mode |
| Ribose 1-phosphate | C5H11O8P1 | 230.01861 | Not observed in positive mode |
| Deoxyadenosine | C10H13N5O3 | 251.10129 | Observed |
| Inosine 5′-phosphate | C10H13N4O8P1 | 348.04655 | Not observed in positive mode |
The last column presents the result of the mass spectrometric analysis based on the detection of metabolite MH+ ions
aCalculated mass for the considered metabolite (the searched m/z ratio were 1.00723 mass unit above due to protonation)
Reducing network analysis complexity through enhanced visualization
The two examples we described above show that our method allows improved biological interpretation of datasets as well as providing a convenient and accessible means for visualisation. By presenting data within the context of the global metabolic network, rather than the fragmented pathway representation, characteristic of other metabolic pathway visualisation tools (e.g. BioCyc (Karp et al. 2005) and KEGG (Aoki and Kanehisa 2005; Kanehisa et al. 2004; Okuda et al. 2008), the new method permits enhanced contextualisation of identified metabolites. This can be particularly useful when considering subsets of the organism’s total metabolic potential as is usually seen in cell-type specific expression patterns. With the integration of our method into Cytoscape (which already offers many functions to represent biological networks) and the ability to import datasets, we offer a very easily navigable tool to visualise and mine metabolomics datasets.
Recently, Antonov et al. (2009) proposed a web tool which also offers the capability of highlighting metabolites identified in metabolomics experiments within the context of known metabolic pathways. However, this graph model does not take the plurality of the substrates in a reaction into account. So far our approach is restricted to a single reaction gap, while Antonov et al. permit multiple absent steps by using a shortest path principle. Clearly additional routes to gap filling are desirable for these types of visualization and this will be a focus of our continuing efforts in this area.
Concluding remarks
Metabolic networks provide what is, arguably, the best context for interpretation of metabolomics data. Classical approaches consist of highlighting metabolites within the represented global network. However, this generally results in a representation overload, in which individual metabolic processes cannot be readily traced. Our aim was to lower the complexity of the network structure that connects compounds in a given experiment. We propose an approach based on sub-network extraction and a gap filling algorithm, which takes reaction direction and substrate availability into account. As we have shown, such an approach helps in creating a connected sub-network, while also resulting in a better interpretation of data acquired in metabolomics experiments. Based on the investigated data, we were able to identify biologically relevant sub-networks. Moreover, manual data mining in the raw spectra confirmed that those metabolites identified by the gap filling algorithm were relevant to the context of those experimentally measured. Some metabolites remain un-connected using our approach and we plan future developments to allow use of multiple steps in filling gaps between metabolites. A part of this effort will be directed towards taking localisation of metabolites within cells into account. It is important to recognise that even Orbitrap data, with mass accuracies better than 1 ppm and resolution up to 600,000 requires orthogonal approaches to provide true identification of metabolites. The algorithm itself works well and users must ensure the robustness of their metabolite identification in exploiting the tool.
Electronic supplementary material
Below is the link to the electronic supplementary material.
Acknowledgments
This research was funded by the ANR-BBSRC Systryp project.
Open Access
This article is distributed under the terms of the Creative Commons Attribution Noncommercial License which permits any noncommercial use, distribution, and reproduction in any medium, provided the original author(s) and source are credited.
References
- Annesley TM. Ion suppression in mass spectrometry. Clinical Chemistry. 2003;49(7):1041–1044. doi: 10.1373/49.7.1041. [DOI] [PubMed] [Google Scholar]
- Antonov AV, Dietmann S, Wong P, Mewes HW. Ticl—a web tool for network-based interpretation of compound lists inferred by high-throughput metabolomics. The FEBS Journal. 2009;276(7):2084–2094. doi: 10.1111/j.1742-4658.2009.06943.x. [DOI] [PubMed] [Google Scholar]
- Aoki, K. F., & Kanehisa, M. (2005) Using the KEGG database resource. Current Protocols in Bioinformatics, Chap. 1, Unit 1.12. [DOI] [PubMed]
- Arita M. Metabolic reconstruction using shortest paths. Simulation Practice and Theory. 2000;9:109–125. doi: 10.1016/S0928-4869(00)00006-9. [DOI] [Google Scholar]
- Arita M. The metabolic world of Escherichia coli is not small. Proceedings of the National Academy of Sciences of the United States of America. 2004;101(6):1543–1547. doi: 10.1073/pnas.0306458101. [DOI] [PMC free article] [PubMed] [Google Scholar]
- Barrett MP, Boykin DW, Brun R, Tidwell RR. Human African trypanosomiasis: Pharmacological re-engagement with a neglected disease. British Journal of Pharmacology. 2007;152(8):1155–1171. doi: 10.1038/sj.bjp.0707354. [DOI] [PMC free article] [PubMed] [Google Scholar]
- Bourqui R, Cottret L, Lacroix V, Auber D, Mary P, Sagot M-F, Jourdan F. Metabolic network visualization eliminating node redundance and preserving metabolic pathways. BMC Systems Biology. 2007;1:29. doi: 10.1186/1752-0509-1-29. [DOI] [PMC free article] [PubMed] [Google Scholar]
- Breitling R, Pitt AR, Barrett MP. Precision mapping of the metabolome. Trends in Biotechnology. 2006;24(12):543–548. doi: 10.1016/j.tibtech.2006.10.006. [DOI] [PubMed] [Google Scholar]
- Cech NB, Enke CG. Practical implications of some recent studies in electrospray ionization fundamentals. Mass Spectrometry Reviews. 2001;20(6):362–387. doi: 10.1002/mas.10008. [DOI] [PubMed] [Google Scholar]
- Chukualim B, Peters N, Fowler C, Berriman M. Trypanocyc—a metabolic pathway database for trypanosoma brucei. BMC Bioinformatics. 2008;9:5. doi: 10.1186/1471-2105-9-S10-P5. [DOI] [Google Scholar]
- Fiehn O. Combining genomics, metabolome analysis, and biochemical modelling to understand metabolic networks. Comparative and Functional Genomics. 2001;2(3):155–168. doi: 10.1002/cfg.82. [DOI] [PMC free article] [PubMed] [Google Scholar]
- Handorf T, Christian N, Ebenhöh O, Kahn D. An environmental perspective on metabolism. Journal of Theoretical Biology. 2008;252(3):530–537. doi: 10.1016/j.jtbi.2007.10.036. [DOI] [PubMed] [Google Scholar]
- Handorf T, Ebenhöh O, Heinrich R. Expanding metabolic networks: Scopes of compounds, robustness, and evolution. Journal of Molecular Evolution. 2005;61(4):498–512. doi: 10.1007/s00239-005-0027-1. [DOI] [PubMed] [Google Scholar]
- Jeong H, Tombor B, Albert R, Oltvai ZN, Barabási AL. The large-scale organization of metabolic networks. Nature. 2000;407(6804):651–654. doi: 10.1038/35036627. [DOI] [PubMed] [Google Scholar]
- Kamleh A, Barrett MP, Wildridge D, Burchmore RJS, Scheltema RA, Watson DG. Metabolomic profiling using orbitrap Fourier transform mass spectrometry with hydrophilic interaction chromatography: A method with wide applicability to analysis of biomolecules. Rapid Communications in Mass Spectrometry. 2008;22(12):1912–1918. doi: 10.1002/rcm.3564. [DOI] [PubMed] [Google Scholar]
- Kanehisa, M., Goto, S., Kawashima, S., Okuno, Y., & Hattori, M. (2004). The KEGG resource for deciphering the genome. Nucleic Acids Research, 32(Database issue), D277–D280. [DOI] [PMC free article] [PubMed]
- Karp PD, Paley S, Romero P. The pathway tools software. Bioinformatics. 2002;18(1):225–238. doi: 10.1093/bioinformatics/18.suppl_1.s225. [DOI] [PubMed] [Google Scholar]
- Karp PD, et al. Expansion of the BioCyc collection of pathway/genome databases to 160 genomes. Nucleic Acids Research. 2005;33(19):6083–6089. doi: 10.1093/nar/gki892. [DOI] [PMC free article] [PubMed] [Google Scholar]
- Lacroix, V., Cottret, L., Thébault, P., & Sagot, M.-F. (2008). An introduction to metabolic networks and their structural analysis. IEEE/ACM Transactions on Computational Biology and Bioinformatics, 18(1), 97–99. [DOI] [PubMed]
- Okuda, S., Yamada, T., Hamajima, M., Itoh, M., Katayama, T., Bork, P., et al. (2008). KEGG atlas mapping for global analysis of metabolic pathways. Nucleic Acids Research, 36(Web Server issue), W423–W426. [DOI] [PMC free article] [PubMed]
- Paley SM, Karp PD. The pathway tools cellular overview diagram and Omics viewer. Nucleic Acids Research. 2006;34(13):3771–3778. doi: 10.1093/nar/gkl334. [DOI] [PMC free article] [PubMed] [Google Scholar]
- Rahman SA, Advani P, Schunk R, Schrader R, Schomburg D. Metabolic pathway analysis web service (pathway hunter tool at cubic) Bioinformatics. 2005;21(7):1189–1193. doi: 10.1093/bioinformatics/bti116. [DOI] [PubMed] [Google Scholar]
- Romero P, Wagg J, Green ML, Kaiser D, Krummenacker M, Karp PD. Computational prediction of human metabolic pathways from the complete human genome. Genome Biology. 2005;6(1):R2. doi: 10.1186/gb-2004-6-1-r2. [DOI] [PMC free article] [PubMed] [Google Scholar]
- Shah VP, Midha KK, Findlay JW, Hill HM, Hulse JD, McGilveray IJ, McKay G, Miller KJ, Patnaik RN, Powell ML, Tonelli A, Viswanathan CT, Yacobi A. Bioanalytical method validation—a revisit with a decade of progress. Pharmaceutical Research. 2000;17(12):1551–1557. doi: 10.1023/A:1007669411738. [DOI] [PubMed] [Google Scholar]
- Shannon P, Markiel A, Ozier O, Baliga NS, Wang JT, Ramage D, Amin N, Schwikowski B, Ideker T. Cytoscape: A software environment for integrated models of biomolecular interaction networks. Genome Research. 2003;13(11):2498–2504. doi: 10.1101/gr.1239303. [DOI] [PMC free article] [PubMed] [Google Scholar]
- Suhre, K., & Schmitt-Kopplin, P. (2008). Masstrix: Mass translator into pathways. Nucleic Acids Research, 36(Web Server issue), W481–W484. [DOI] [PMC free article] [PubMed]
- Windig W, Gallagher NB, Shaver JM, Wise BM. A new approach for interactive self-modeling mixture analysis. Chemometrics and Intelligent Laboratory Systems. 2005;77:85–96. [Google Scholar]
Associated Data
This section collects any data citations, data availability statements, or supplementary materials included in this article.


