


Abstract
The occupancy of nucleosomes along chromosome is a key factor for gene regulation. However, except promoter regions, genome-wide properties and functions of nucleosome organization remain unclear in mammalian genomes. Using the computational model of Increment of Diversity with Quadratic Discriminant (IDQD) trained from the microarray data, the nucleosome occupancy score (NOScore) was defined and applied to splice junction regions of constitutive, cassette exon, alternative 3′ and 5′ splicing events in the human genome. We found an interesting relation between NOScore and RNA splicing: exon regions have higher NOScores compared with their flanking intron sequences in both constitutive and alternative splicing events, indicating the stronger nucleosome occupation potential of exon regions. In addition, NOScore valleys present at ∼25 bp upstream of the acceptor site in all splicing events. By defining folding diversity-to-energy ratio to describe RNA structural flexibility, we demonstrated that primary RNA transcripts from nucleosome occupancy regions are relatively rigid and those from nucleosome depleted regions are relatively flexible. The negative correlation between nucleosome occupation/depletion of DNA sequence and structural flexibility/rigidity of its primary transcript around splice junctions may provide clues to the deeper understanding of the unexpected role for nucleosome organization in the regulation of RNA splicing.
INTRODUCTION
In eukaryotic cells, genomic DNA is highly compacted in the nucleus into several levels of chromatin structures that ultimately make up the chromosomes. At the lowest level of compaction, a ∼147 bp DNA sequence is tightly wrapped around the histone-octamer core (composed of pairs of the four core histones H2A, H2B, H3 and H4) into the elementary structural unit of chromatin, known as nucleosome (1). The packaging of DNA around the histone-octamer not only facilitates the storage and organization of the long eukaryotic chromosomes, but also plays a crucial role in diverse DNA-related biological processes, such as transcriptional regulation, replication, repair and recombination (2–4). Several reports have demonstrated that transcription start sites and transcription factor binding sites are selectively devoid of nucleosomes in the Saccharomyces cerevisiae genome (5–7). These findings were also confirmed for promoter regions of human genes using genome-tiling microarrays (8) and by analysis of high-throughput sequencing data (9). However, it was suggested that nucleosomes adopt more random positions in the interior of genes (10). Thus, revealing the detailed nucleosome organization beyond promoter regions will provide novel insights into the full understanding of subsequent steps of gene expression.
The general link between nucleosome and gene exon–intron architecture has been suggested in previous studies (11,12). These authors observed the common sequence periodicity around splice junctions. On the basis of the observed dinucleotide periodicities, Kogan and colleagues proposed that nucleosomes are positioned at splice sites due to a protection mechanism (12). Recently, by analyzing the ChIP-Seq data (9), Andersson et al. (13) have reported that nucleosomes are well positioned in exons and carry characteristic histone modifications, and Schwartz et al. (14) have described that the chromatin organization marks the exon–intron structure. They represent an important step toward the understanding of genome-wide nucleosome organization and function. However, mechanisms responsible for the relation between nucleosome positioning and transcriptional splicing remain unclear. To solve this problem, more detailed analyses on nucleosome positioning in different splicing events—constitutive, cassette exon, alternative 3′ and 5′ splicing events, etc., respectively—are required. The aim of this study is to investigate the nucleosome organization along DNA sequences around the exon/intron boundary and explore its relation to RNA splicing.
The sequence dependent nucleosome occupancy along DNA has been demonstrated and lots of work has been done to elucidate nucleosome occupancy signals that determine the preference of a particular region to bind to histones and form a nucleosome (15–17). Based on these studies, a new computational model, called Increment of Diversity with Quadratic Discriminant (IDQD), trained using human microarray data is presented to identify DNA sequences that either favor or inhibit nucleosome occupation. Using this model, we have calculated the nucleosome occupancy score (NOScore) around the splice junction sequences and found the distinct NOScore trends between exon and intron regions in constitutive, cassette exon, alternative 3′ and 5′ splicing events in the human genome. These results are in accord with the experimental nucleosome positioning data (13,14). Moreover, we have defined folding diversity-to-energy ratio (FDE) to describe RNA structural flexibility and found the negative correlation between nucleosome occupation/depletion of DNA sequence and RNA structural flexibility/rigidity around splice junctions. These observations will provide important clues to the deeper understanding on the relationship between the nucleosome occupancy along DNA and the splicing of primary RNA.
MATERIALS AND METHODS
Nucleosome occupancy and depleted probes
The top (nucleosome occupancy) 1000 and bottom (nucleosome depleted) 1000 probes (length of 50-mer) were picked out by Gupta et al. (18) from the DNA microarray data (19) to train their support vector machine (SVM) model for nucleosome occupancy sequence prediction. To avoid prediction bias in this study, a sequence alignment for each of the probes against the human cDNA (http://atidb.cshl.org/maize/Homo_sapiens.NCBI36.50.cdna.all.fa) was carried out with a local installation of BLSAT using default parameters. Of the 2000 probes, 322 probes that have sequence identities with cDNA were removed. The new dataset contains 762 nucleosome occupancy and 916 nucleosome depleted probes, constituting the positive and negative training samples, respectively.
Splice junction sequences
Human splice junction sequences are downloaded from the latest AltSplice Database (Human release 3) of EBI (20,21), which is available at http://www.ebi.ac.uk/asd/altsplice/index.html. Splice sites obeying the GT–AG rule and with exons ranging from 140 to 160 bp, 160 to 180 bp and 190 to 210 bp were all collected for constitutive, cassette exon, alternative 3′ and 5′ splicing events, respectively. Two data sets of splice junction sequences were formed for AG- and GT-junction containing sequences, and each set consists of 1000-bp-long sequences with the splice site in the middle (AG at positions 499, 500; GT at positions 501, 502, respectively). For each of the splicing events, the number of splice junction sequences sorted by exon-size is listed in Supplementary Table S1.
Introduction to IDQD
The Increment of Diversity with Quadratic Discriminant (IDQD) method was proposed and successfully applied in the prediction of exon–intron splice sites for several model genomes (22). The method has also been used in the prediction of transcription start sites (23). In this method, the sequence features are converted into the increment of diversity (ID), defined by the relation of sequence X with standard source S (24),
| (1) |
Given a sequence X with r sets of feature variables (ID1 to IDr), we obtain an r-dimensional feature vector R = (ID1, ID2, …, IDr) and need to integrate the vector into a non-linear discriminant function ξ through quadratic discriminant analysis (QD) (25). QD can be deduced from Bayes’s theorem and under the assumption of ID1 to IDr obeying the r-dimensional normal distribution (26). The parameter ξ gives the decision for sample X. As ξ > ξ0, the sample X is classified into the positive group, or into the negative group as ξ ≤ ξ0 (see Part I in Supplementary Data for more information).
In this study, the feature vector R is designed by the following consideration. The rotational and translational settings of DNA around the histone core are determined by the sequence-dependent structure of DNA (27,28). The absolute occurrences of the six k-mers (k = 1, 2, …, 6) are responsible for the discrimination between nucleosome occupancy and depleted sequences (18,29), and therefore they construct the diversity sources. Based on this, 12 increments of diversities ID1(ID2), ID3(ID4), …, ID11(ID12) between sequence X and the standard source in positive (negative) training set can be easily introduced as the feature parameters for the computational model (see Part I in Supplementary Data for more information).
NOScore
Given the ξ value for a probe-sized (50 bp, the same length as given in ref. 18) DNA sequence, we can assess its nucleosome occupation/depletion potential by calculating the NOScore, S,
| (2) |
here ξMax and ξMin are the maximum and minimum of the ranked ξ of sequences in the training dataset. When ξ equals ξ0, the corresponding NOScore S is designated as the threshold value S0. If the NOScore of a probe-sized DNA sequence is larger than S0, it is predicted as the nucleosome occupancy sequence; otherwise, as the nucleosome depleted one.
The nucleosome occupation/depletion potential of an L bp-long DNA sequence can be measured by the average NOScore  ,
,
| (3) |
Here Si is the NOScore of the ith (i = 1, 2, …, m) 50-bp window, and the summation is over the m windows with a width of 50-bp and step size of 10-bp along the DNA sequence.
RNA folding energy and structural variability
The dynamic programming algorithm RNAstructure V4.5 (30,31), available for download from http://rna.chem.rochester.edu, was employed to predict RNA secondary structures and folding free energies with a temperature parameter setting of 37°C.
We folded the L bp-long (L = 150, 170 or 200 bp in this study) RNA sequence as a whole using this program and defined FDE ratio to describe its structural flexibility.
 |
(4) |
| (5) |
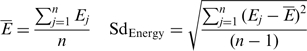
Here Ej is the folding free energy of the jth (j = 1, 2, …, n) structure. The parameter n is the number of the optimal secondary structures with the least folding free energies and n = 20 is taken in this study; SdEnergy is the standard deviation of diverse folding free energies, representing the structural variability of RNA folding.
RESULTS
Validation of IDQD model
To estimate its performance, we applied the IDQD model to the training dataset and compared its prediction quality with that of the SVM model (18) by measuring the area under the receiver operating characteristic (ROC) curve. By this metric, a random classifier achieves an area under ROC curve (auROC) of 0.5, while 1.0 corresponding to a perfect one (32). Our IDQD model obtained a mean auROC of 0.958 in the 10-fold cross-validation, superior to the SVM model with an auROC of 0.907 (Figure 1a) for the discrimination between nucleosome occupancy and depleted sequences in the same dataset.
Figure 1.

Evaluation of the performance of IDQD model. The IDQD model trained on the ChIP-chip data was compared with the SVM model and further validated on the independent high-resolution nucleosome occupancy data. (a) ROC curves for IDQD (marked with triangles) and SVM (marked with squares) models were plotted for the discrimination between nucleosome occupancy and depleted probes in the ChIP-chip data. The mean auROC of 0.958 was obtained for IDQD model in the 10-fold cross-validation experiments, higher than the SVM model with a mean auROC of 0.907. (b) An ROC curve with the auROC of 0.935 was obtained for the validation of the IDQD model in the independent nucleosome occupancy data.
As a further evaluation, the IDQD model trained based on the ChIP-chip data was tested on the independent high-resolution nucleosome occupancy data (see Part II in Supplementary Data for more information) which has been analyzed in recent studies (13,14). It gives an ROC curve with the auROC of 0.935 (Figure 1b), indicating the excellent performance of IDQD model in distinguishing between nucleosome occupancy and depleted sequences.
Nucleosome occupancy analysis around splice sites
By using IDQD model, the NOScore was calculated in a 50-bp sliding window with a step size of 10-bp along the 1000 bp regions around the donor and acceptor splice sites. Figure 2 shows the NOScore against the position of sliding windows over the regions around the acceptor (AG) and donor (GT) sites of constitutive splicing event.
Figure 2.

The nucleosome occupancy score around splice junctions in constitutive splicing event. The score was smoothed with a 50-bp sliding window in 10-bp increments from −500 to 500 bp relative to the splice sites and given for the acceptor (top panel) and donor (down panel) sites, respectively. (a–c) correspond to sequences with exons that ranging from 140 to 160 bp, 160 to 180 bp and 190 to 210 bp, respectively. The x-axis gives the position of the sliding window labeled by its center relative to acceptor site AG (denoted as 0) or to donor site GT (denoted as 0) and the y-axis represents the nucleosome occupancy score.
The NOScore peaks in the range of exons, with the value higher than the threshold S0 = 0.188 (see Part I in Supplementary Data for more information), indicating their strong affinities for nucleosome occupation, while the NOScore is lower than the threshold value S0 in the flanking intron regions both for donor and acceptor junctions, suggesting their weaker potential to wrap on the histone-octamer compared with exons. These results obtained from our computation model are of prediction nature, but they are consistent with experimental nucleosome positioning data as indicated in recent reports (13,14). Moreover, we found that the lowest NOScore is at ∼25 bp upstream of the acceptor site, corresponding to the location of the branch site in the RNA transcript.
In parallel, we also analyzed the atlases of nucleosome occupancy in splice junction regions for the three major alternative splicing events (cassette exon, alternative 3′ and 5′) and found that the NOScores still peak in the exon regions and the contrasts of nucleosome occupation/depletion potentials between exons and their flanking intron regions remain obvious (Supplementary Figures S1–S3), basically same as those in constitutive splicing event. In addition, the region between two alternative acceptor sites in alternative 3′ splicing event and that between two alternative donor sites in alternative 5′ splicing event also exhibit nucleosome occupation potential, with the NOScore higher than the threshold value S0.
The above findings were obtained from the IDQD model trained on the ChIP-chip data (18). To verify these uncommon results, we trained the model based on the high-resolution ChIP-Seq data (9) and reanalyzed the NOScore in intron/exon junctions for constitutive, cassette exon, alternative 3′ and 5′ splicing events. The result of reanalysis confirmed the predictions that there exists a higher NOScore in exons for all the splicing events (see Part II in Supplementary Data, Supplementary Figures S4–S7).
The higher nucleosome occupancy potential in exon regions has been observed in a sample of individual human genes (PRRC1, UHRF1BP1, EXOSC9 and PKM2) by analyzing the H3K36 tri-methylation signal (13). Here, we applied the IDQD model trained on the ChIP-chip data to predict nucleosome occupancy profiles in exon and surrounding intron regions of these genes. In most cases, exons exhibit higher NOScores than their surrounding introns (Figure 3 and Supplementary Figure S8). Simultaneously, the predicted nucleosome profiles are in accord with experimental nucleosome positioning signals indicated by the number of tags (Figure 3 and Supplementary Figure S8), demonstrating the reliability of the above statistical prediction.
Figure 3.

Nucleosome occupancy profiles for individual genes. The IDQD model was applied to predict nucleosome occupancy profiles around splice junctions in human PRRC1 gene. The experimental (ChIP-Seq) nucleosome positioning signals were given in the top panel (number of tags), blue: exons; black: introns. The theoretically (IDQD) predicted nucleosome profiles were shown in the second panel (NOScores), blue: exons; black: introns. In the third panel, unambiguous comparisons between experimental and theoretical nucleosome profiles for exons and surrounding introns were shown. For both experimental and theoretical methods, if the maximum signal in the exon region is evidently stronger (weaker) than that both in the 50-bp up- and down-stream intron regions we assign a character ‘Y (N)’ to indicate that the exon has higher (lower) potential to form a nucleosome, otherwise we assign a character ‘F’ to indicate that the signal strength discrepancy is somewhat obscure around splice junctions. Exons and surrounding introns according to Ensembl annotation were shown by blue rectangles (scale to exon size) in the bottom panel. The red arrow in each figure indicates the transcript orientation. The result shows that in most cases, exons exhibit higher nucleosome occupancy scores than their surrounding introns, in good accordance with experimental nucleosome signals as seen from the accordance rate of Y in the third panel of this figure. However, for several cases the theoretical predictions and experimental results are obscure (marked by F in the third panel), which may be explained partly by the possible formation of fuzzy nucleosomes (6) and the apparent similarity of nucleosome formation potential in exon and intron regions.
Effect of AT and dinucleotide contents on nucleosome occupancy
Human intronic regions tend to be AT-rich when compared to exons. Since AT-rich sequences have a looser association with nucleosome (29), it is necessary to check if the observed nucleosome depletion within introns is fully caused by AT content. We therefore generated 909 (equal to the number of sequences in constitutive splicing event analyzed above) control sequences by randomization of bases under the same nucleotide composition and length as natural intron and exon sequences in constitutive splicing event, and deduced the average nucleosome occupancy profile using the IDQD model (Figure 4 and Supplementary Figure S11). We found that the nucleosome profile of control sequences is markedly different from that of natural ones, and does not show lower NOScore in intron regions compared to exons. This result ruled out the possibility that the observed NOScore was contaminated by AT content.
Figure 4.

The nucleosome occupancy score around splice site in natural and control splice junction sequences of constitutive splicing event. The score was smoothed with a 50-bp sliding window in 10-bp increments from −500 to 500 bp relative to the splice site of control (blue line) and natural sequences (black line) with exons ranging from 140 to 160 bp. The x-axis gives the position of the sliding window labeled by its center relative to acceptor site AG (denoted as 0) and the y-axis represents the nucleosome occupancy score. This plot indicates that the nucleosome profile of control sequences is markedly different from that of natural ones, does not show lower NOScores in intron regions compared to surrounding exons (those for exons ranging from 160 to 180 and 190 to 210 bp are the same, data not shown).
Next, we studied the dinucleotide distribution around splice junctions. With the same window length and step size as the plots of NOScore, we depicted dinucleotide profiles (Supplementary Figures S12–S13) and noticed some peculiarities of frequency distribution in splice junction region. However, by using IDQD model, we found that the dinucleotide information alone only gives an auROC of 0.53 for nucleosome positioning sequences prediction (Figure 5), much lower than that given by combination information of all k-mers (k = 1, 2, …, 6). These results indicate that apart from AT content and dinucleotide composition, the oligomer (k > 2) information is also important for understanding the pattern of nucleosome organization observed in exon and intron regions. As an illustration, we listed the top tri-, tetra-, penta- and hexamers (ranked by one-side P-values from the Mann–Whitney’s U test) which provide significant contributions to nucleosome positioning around splice junctions in the human genome (Supplementary Table S2).
Figure 5.

Dinucleotide contribution to nucleosome positioning sequence prediction. ROC curves were plotted for nucleosome positioning sequence (independent high-resolution nucleosome occupancy data) prediction using IDQD method with different parameters. The black ROC curve (same as that in Figure 1b) is for the prediction using combination information extracted from all k-mers (k = 1, 2, …, 6) and the green one is by use of dinucleotide information alone. The dinucleotide information only gives an auROC of 0.53 no better than random guessing (ROC curve with an auROC of 0.5, blue line), suggesting that dinucleotides alone can not fully explain the pattern of nucleosome occupancy observed within exon and intron regions.
FDE evaluation in the HIV-1 genome
In this section, the validity of the definition of RNA FDE ratio was evaluated. Recently, Watts et al. (33) reported the structure of an entire HIV-1 RNA genome using SHAPE experiment, and suggested that SHAPE reactivities are indicative of local nucleotide flexibility and disorder (34,35). Regions with median reactivities below 0.25 indicate domains with substantial base-paired secondary RNA structure, whereas median SHAPE reactivities of 0.5 and greater indicate regions of largely unstructured nucleotides. So, high median reactivity means relatively flexible while low median reactivity means relatively rigid (33). Since FDE is defined in a region spanning ∼150-bp, we observe the SHAPE reactivities in a 150-bp sliding window with a 10-bp offset. If the number of nucleotides with SHAPE reactivities <0.25 (>0.5) is larger than 60 and that with SHAPE reactivities >0.5 (<0.25) is smaller than 40, then the 150-bp long sequence is classified into the rigid (flexible) group of low (high) median SHAPE reactivity (MSR). There are 84 samples belong to low MSR group and 76 samples to the high MSR group in the HIV-1 RNA genome. We studied if the low/high MSR classifications are consistent with those given by FDE. By calculating FDE for each sample, we differentiated the low and high MSRs (rigid and flexible sequences) and obtained an ROC curve with the auROC of 0.88, Figure 6, indicating the reasonability of our definition of FDE. The connection between FDE and SHAPE reactivity is understandable since the latter can be converted to RNA free-energy change terms that constrain the thermodynamic folding algorithm.
Figure 6.

Validation of the definition of RNA folding diversity-to-energy ratio. The ROC curve is plotted for classifying rigid and flexible subsequences in the HIV-1 RNA genome by employing folding diversity-to-energy ratio (FDE). In this validation, an auROC of 0.88 is obtained, which indicates FDE is an appropriate quantity to describe RNA structural flexibility.
RNA structural flexibility around splice sites
The pre-mRNA splicing proceeds through a series of reactions completed in RNA sequence. Together with some splicing factors and other additional proteins, the snRNPs (including U1, U2, U5, U4, U6 and others) form the spliceosome. The snRNA components of the splicing apparatus interact both among themselves and with the substrate RNA. These interactions allow for changes in structure that may bring reacting groups into apposition and may even create catalytic centers (36). So, any deeper understanding of splicing events should require the knowledge on pre-mRNA structure.
Since there is no direct experimental data on RNA structural flexibility, we employed FDE to analyze the structural flexibility of RNA sequences around splice junction regions. Considering the length of the shortest exon in each of the four (constitutive, cassette exon, alternative 3′ and 5′) splicing events (given in Supplementary Table S1), we extracted the exon-sized (L = 150, 170, 200 bp) sequences in the exon region (directly downstream of the acceptor sites AG), upstream of the acceptor site (AG) and downstream of the donor site (GT), and designated them as Exon, Iup and Idown. The intron–exon junctions (AG and GT) were included in Iup and Idown, respectively. For alternative 3′ (or 5′) splicing event, the most upstream acceptor site (or downstream donor site) was considered. Following Equation (5), we calculated FDE for exons of different sizes and found that the structural flexibility of RNA transcribed from the up- and down-stream intron regions are significantly larger than those from the exon regions on average (Table 1). Since the nucleosome occupation potential is different among Iup, Idown and Exon sequences, the results show that the nucleosome occupation potential of DNA sequences is correlated with the structural flexibility of RNA transcribed from them. The higher the nucleosome occupation potential of the DNA is, the less the structural flexibility of the RNA is.
Table 1.
Comparison of RNA structural flexibilitya
| Splicing Event | Comparisons | Exon size (bp) |
||
|---|---|---|---|---|
| 140–160 | 160–180 | 190–210 | ||
| Constitutive | <FDE (Iup)/FDE (Exon)> | 1.26 (0.54) | 1.24 (0.55) | 1.26 (0.64) |
| <FDE (Idown)/FDE (Exon)> | 1.19 (0.52) | 1.19 (0.53) | 1.19 (0.44) | |
| Cassette exon | < FDE (Iup)/FDE (Exon)> | 1.27 (0.60) | 1.26 (0.58) | 1.24 (0.57) |
| <FDE (Idown)/FDE (Exon)> | 1.19 (0.56) | 1.20 (0.51) | 1.21 (0.53) | |
| Alternative 3′ | < FDE (Iup)/FDE (Exon)> | 1.24 (0.60) | 1.26 (0.78) | 1.30 (0.85) |
| <FDE (Idown)/FDE (Exon)> | 1.16 (0.53) | 1.17 (0.56) | 1.24 (0.60) | |
| Alternative 5′ | <FDE (Iup)/FDE (Exon)> | 1.22 (0.55) | 1.25 (0.59) | 1.20 (0.56) |
| <FDE (Idown)/FDE (Exon)> | 1.17 (0.56) | 1.21 (0.57) | 1.21 (0.55) | |
aThe average ratios of RNA structural flexibility in introns to that in exons are listed for exons of different sizes. The standard deviations are given in brackets by subscript numbers. The sequences in exon, upstream of acceptor site and downstream of donor site are labeled by Exon, Iup and Idown, respectively.
Nucleosome occupancy associates with RNA structural flexibility
The anti-correlation between the nucleosome occupation potential of DNA and the structural flexibility of RNA can be proved by direct statistics. We investigated the relationship between nucleosome occupation potential and structural flexibility in splice junction regions. Since the FDE is defined for an L-bp (L = 150, 170 or 200) long RNA sequence, it is necessary to use the NOScore of DNA averaged over the same long sequence, namely use  [Equation (3)] in the computation. The obtained relationship between FDE and
  is given in Figure 7 for constitutive splicing event. It shows a significant negative correlation between the average NOScore and FDE (Pearson correlation coefficient r = −0.56; P < 0.0001) with the regression coefficient of −0.03 in the linear regression equation. For three major alternative splicing events, the results are the same but the regression coefficient equals −0.02 (Supplementary Figures S15–S17).
Figure 7.

Correlation between structural flexibility and average nucleosome occupancy score in constitutive splicing event. The relation between the structural flexibility of RNA and the average nucleosome occupancy score of DNA is plotted for constitutive splicing event. The figure shows a significant negative correlation (Pearson correlation coefficient, r = −0.56; P < 0.0001) between the structural flexibility (FDE, x-axis) and the average NOScore (y-axis). The linear regression equation is y = −0.03x + 0.28.
The negative correlation existing between FDE and  indicates that the nucleosome occupancy along DNA indeed influence RNA structural flexibility in splice junction regions. RNA sequences transcribed from nucleosome-occupied regions are relatively rigid, while those transcribed from nucleosome-depleted regions are relatively flexible. This gives a clue to understand why the difference of the NOScore occurs between exons and introns in splice junction regions and why the difference may regulate the process of pre-mRNA splicing.
DISCUSSION
Performance of IDQD model in nucleosome positioning prediction
Nucleosome positioning is a combinational process, including rotational and translational settings. The periodical presence of certain dinucleotides (2-mer) presumably provides a rotational setting of DNA on the histone surface because AA or TT dinucleotides tend to expand the major groove of DNA (10), while other sequence combinations (other k-mers) could create subtle bends in the DNA or alter the flexibility of DNA to contribute to the rotational and translational settings of nucleosomal DNA (6,37). The pentamers and other longer oligomers may also provide the binding sites for chromatin remodeling complexes or spacing complexes of the imitation switch, which play important roles in nucleosome organization (10,38–41).
We have developed a novel computational model for nucleosome positioning recognition and to predict known nucleosome occupancy and depleted sequences (see Part I in Supplementary Data) by use of k-mer information (k = 1, 2, …, 6). The prediction was made in a 10-fold cross-validation experiment and evaluated using ROC curve method. The predictive results (Figure 1a and b) demonstrate the excellent performance of IDQD model in distinguishing between nucleosome occupancy and depleted sequences. The success of the prediction is primarily due to the appropriate synthesis of dinucleotide information and oligomer information of binding sites extracted from both nucleosome occupancy and depleted sequences. The ID defined in our model is essentially a measure of entropy increase as a sequence merged to a standard set of nucleosome occupancy or depleted sequences. The advantage of the ID method is the utilization of content measure, signal measure and similarity measure synthetically in a simple and unified approach. The different types of sequence information extracted by IDs are then integrated into one non-linear discriminant function through quadratic discriminant (QD) analysis. The accuracy of IDQD method in solving classification problem is comparable with SVM (42). As the information about nucleosome positioning beyond promoters is still rare, our IDQD model provides a useful tool for the genome-wide analysis of nucleosome distribution.
Nucleosome organization patterns in the splice junction regions
Knowledge of how nucleosomes are distributed in particular genomic regions could result in valuable and novel insights into DNA replication, mRNA splicing and so on. There is emerging evidence suggesting that splicing in most cases is initiated co-transcriptionally and that introns are removed while the nascent transcript is still tethered to the DNA by the RNA polymerase II (43). Thus, it is not impossible that the nucleosome positioning at DNA level may affect the exon recognition at RNA level. We have utilized the IDQD model trained by the top- and bottom-scoring probes in the dataset of Gupta et al. (18) which were taken from DNA sequences upstream of genes to predict the nucleosome organization in exon/intron regions within a gene. We found that the nucleosome occupancy potential is significantly higher in exons than in adjacent introns. To avoid the possible bias due to the particular dataset choice, we checked and reconfirmed the result by use of the high-resolution nucleosome occupancy data from human CD 4+ T cells (Supplementary Figures S4–S7). Our prediction can be proved by direct observation of the nucleosome-positioning data in splice junction region and the evidence has been offered in literatures (13,14). The success of the prediction of nucleosome organization in exon/intron regions by use of data taken from promoter sequences means both DNA regions from gene or promoter obeys the same law of nucleosome positioning.
We have studied nucleosome positioning in more detail around splice sites in different kinds of splicing events. In addition to constitutive splicing event, we have studied cassette exons, alternative 3′ and 5′ splicing events. We found the common feature that the nucleosome occupation potential is significantly stronger in exons but weaker in their adjacent intron regions and a sharp valley of NOScore locates at ∼25 bp upstream of the acceptor site. The higher NOScore in exon regions may be related to the selection operating on DNA to impact codon usage, amino acid composition and synonymous and non-synonymous rates of evolution in coding sequences that has been analyzed in the Saccharomyces cerevisiae genome (44). It may also be related to enriched histone modifications existed in exons (13,14). However, the sharp NOScore valley immediately proceeding exons may be related to the signal for the branch point. Recent study has demonstrated that most of the branch point in the human genome are located 21–34 nucleotides upstream of the acceptor site and the polypyrimidine stretch spanning 4–24 nucleotides downstream of the branch point are enriched of ‘U’ nucleotide (45). These A+T frequencies present important features responsible for nucleosome inhibition in DNA sequence (29), which may be helpful to the function of branch point. This explains the nucleosome score valley ∼25 bp upstream of the acceptor site.
Due to the presence of repetitive elements, introns may display a higher level of chromatin compaction than exons (46). We determined whether repetitive elements introduce bias into the above conclusions. All the splice junction sequences were annotated using the RepeatMasker program (47) and then grouped into two categories according to whether they contain repetitive elements. We computed the NOScores of the annotated sequences using the nucleosome positioning recognition model and found no significant nucleosome occupancy discrimination between repetitive-element-containing and repetitive-element-less sequences (Supplementary Figure S14), ruling out the possibility that repetitive elements would confound our observations.
The lower NOScore presents not only in splicing intron regions but also in distal intronic sequences. The frequency of exons taking higher NOScore (>0.24) is twice more than corresponding distal introns, while the frequency of exons taking lower NOScore (<0.22) is less than distal introns by a factor 2 (Supplementary Figure S9). On the other hand, it was reported that the nucleosome occupation potential in promoter regions is weaker than that in coding regions for the yeast genome (29,48,49). The systematic comparison of the NOScores in different regions of human genes shows a particularly unambiguous behavior: the highest in exon regions, intermediate in intron regions and lowest in promoter regions on average (Supplementary Figure S10a). However, the distribution of the standard deviation of NOScores is: the largest in promoters, intermediate in introns and lowest in exons (Supplementary Figure S10b), indicating the higher variability of the nucleosome occupancy in promoter regions. The above results show that promoter regions are more inhibitory on average and the complex regulatory functions require some regions of them to be nucleosome free and others to be bound by nucleosomes (29). The nucleosome organization of introns, to some extent, near that of promoters possibly supports the hypothesis that many undiscovered cis- and trans-acting regulatory elements reside in introns (50).
Mechanism for exonic nucleosome positioning and RNA structural flexibility analysis
Nucleosome occupation or depletion occurs in DNA sequences. How do they influence pre-mRNA splicing occurred at RNA level? Recently, several new insights were gained into the mechanism for nucleosome organization in exon/intron junction region. Chromatin is a highly regulated environment and its association with the pre-mRNA would provide many opportunities to guide and modulate splicing. For example, information present on the chromatin could facilitate the detection of introns (46). The consensus sequences located at the intron–exon boundaries are highly degenerate and additional epigenetic information may be required for the accurate selection of splice sites. It was demonstrated that H3K36me3 and H3K79me1 in internal exons are related to splicing (13,51), as the internal exons might be visible to the spliceosome by well-positioned nucleosomes carrying H3K36me3 and/or H3K79me1. Simultaneously, nucleosomes bound within exons could improve the selection of exons by slowing the rate of RNA polymerase II (46,51–53), as a reduction in transcription rate has been shown to increase the inclusion of alternatively spliced exons (54).
As an alternative possible mechanism, we propose that the structural flexibility divergence between exons and introns also may be an important factor influencing pre-mRNA splicing. The accurate exon/intron discrimination requires splicing signals, including the splice sites, a polypyrimidine tract, a branch site and other splicing-regulatory elements that have been optimized in the evolution of RNA landscape (55). The interaction of the spliceosome with substrate RNA is also a basic event for the splicing process. It is influenced by local RNA structure, since the sequestration of RNA into double strands could prevent its binding to regulatory proteins (56).
The binding and motion of splicing apparatus along RNA sequences requires enough flexibility of these sequences. However, the flexibility of pre-mRNA is difficult to define. The flexibility of DNA and RNA duplexes in aqueous solution and crystal form was studied in refs (57,58) through molecular dynamics simulation and database analysis. These authors have pointed out that ‘the flexibility is a dangerous word for describing macromolecules, unless it is clearly defined’. The circumstance for pre-mRNA is more complicate, since different from the helix structure of B-DNA and A-RNA duplexes, the secondary structure of single-stranded RNA has more structural components, including base-pairs, bulges, interior loops, end loops, multi-branch loops, etc., and their complex combinatoriality.
In view of this, we defined FDE ratio directly from RNA folding energy data. The FDE, defined in Equation (5), means the relative folding flexibility of an RNA sequence. It contains two factors, the average  and the deviation (SdEnergy) of RNA folding free energies. The former roughly describes how many base pairs form stems and how many bases are in loops in the secondary structure, while the latter describes the variability of the folding for an L-bp long RNA sequence. Both two factors influence the effective interaction and binding of the spliceosome with substrate RNA on some sites of the sequence.
Since RNA folding free energy deduced from the RNA-structure program (30,31) is dependent on the sequence length, we set L equal to the characteristic length of the splicing process, namely L equals the exon size. Table 1 gives the ratio of the FDE for up- and down-stream intron sequences to that for exons of different sizes. We found that the FDE for up- and down-stream introns is ∼25, 19% higher than that for exons, respectively.
The discrepancy of FDE between exon and adjacent intron splicing regions is helpful to the recognition of splice sites and the accurate removal of introns. First, the high variability of the RNA structure and the small stem/loop ratio contained in intron sequences may facilitate the recruitment of snRNPs and many additional proteins to form the spliceosome in these regions and therefore promote the removal of the intron sequences through RNA–RNA, RNA–protein, RNA–chromatin (51) and protein–protein interactions. Secondly, the sequences transcribed from exons are relatively rigid, and due to the larger stem/loop ratio, their local structures are relatively stable, difficult to be bound by the spliceosome. It means that they can generally tolerate stronger mechanical stress, except at their two ends linking to introns. So it is likely that the breaking of pre-mRNA sequence in the splicing process always happens at the exon–intron boundaries.
The comparatively higher structural flexibility of up- and down-stream introns and lower structural flexibility of exons has been statistically tested by regression analysis. We found that the stronger anti-correlation does exist between the NOScore of DNA and the structural flexibility of RNA in splice junction regions (Figure 7 for constitutive splicing event, correlation coefficient r = −0.56, P < 0.0001; Supplementary Figures S15–S17 for alternative splicing ones, correlation coefficient r = −0.34 to −0.46, P < 0.0001). Simultaneously, the same but weaker anti-correlation was also found in the distal intron regions (Supplementary Figure S18, correlation coefficient r = −0.26, P < 0.0001). This means that FDE is an appropriate definition introduced for splicing analysis and this quantity bears some relation with nucleosome organization along DNA sequence.
In conclusion, our results have added a new layer to the understanding of nucleosome positioning and pre-mRNA splicing.
SUPPLEMENTARY DATA
Supplementary Data are available at NAR Online.
NOTE ADDED IN REVISION
The manuscript was submitted to Nucleic Acids Research in January, 2009, in which we primarily investigated and predicted the relation between nucleosome positioning and RNA splicing. In revision of the manuscript, we found the same views were proposed independently by Andersson et al. in Genome Research (August 2009) and by Schwartz et al. in Nature Structural and Molecular Biology (August 2009). Moreover, they demonstrated the relation by directly comparing with experimental nucleosome positioning data. So, in this revision, the related discussions are added in reference to newly published literatures, but our original prediction and all computational results on the nucleosome positioning around splice sites in different splicing events remain unchanged.
FUNDING
National Natural Science Foundations of China (No. 90403010 to L.F.L., No.10447003 and No. 60963015 to L.R.Z.). Funding for open access charge: Distinguished Scientist Award 2008 of Inner Mongolia Autonomous Region, China.
Conflict of interest statement. None declared.
Supplementary Material
ACKNOWLEDGEMENTS
We wish to express our gratitude to executive editor and three anonymous reviewers whose constructive comments were very helpful in strengthening the presentation of this article. We would like to thank Prof. Noble William Stafford of the Department of Computer Science and Engineering at University of Washington for providing the processed microarray data. We thank Dustin Schones at National Institutes of Health for his helpful discussions. We thank Xiaoli Li at Beijing Language and Culture University for her help in language correction of the manuscript. We are also grateful to Yongqiang Xing and Dr Jun Lv for fruitful discussions.
REFERENCES
- 1.Luger K, Mäder AW, Richmond RK, Sargent DF, Richmond TJ. Crystal structure of the nucleosome core particle at 2.8 Å resolution. Nature. 1997;389:251–260. doi: 10.1038/38444. [DOI] [PubMed] [Google Scholar]
- 2.Gerbi SA, Bielinsky AK. DNA replication and chromatin. Curr. Opin. Genet. Dev. 2002;12:243–248. doi: 10.1016/s0959-437x(02)00292-7. [DOI] [PubMed] [Google Scholar]
- 3.Yasuda T, Sugasawa K, Shimizu Y, Hanaoka F. Nucleosomal structure of undamaged DNA regions suppresses the non-specific DNA binding of the XPC complex. DNA Repair. 2005;4:389–395. doi: 10.1016/j.dnarep.2004.10.008. [DOI] [PubMed] [Google Scholar]
- 4.Schlissel MS. Perspectives: transcription. A tail of histone acetylation and DNA recombination. Science. 2000;287:438–440. doi: 10.1126/science.287.5452.438. [DOI] [PubMed] [Google Scholar]
- 5.Yuan GC, Liu YJ, Dion MF, Slack MD, Wu LF, Altschuler SJ, Rando OJ. Genome-scale identification of nucleosome positions in S. cerevisiae. Science. 2005;309:626–630. doi: 10.1126/science.1112178. [DOI] [PubMed] [Google Scholar]
- 6.Lee W, Tillo D, Bray N, Morse RH, Davis RW, Hughes TR, Nislow C. A high-resolution atlas of nucleosome occupancy in yeast. Nat. Genet. 2007;39:1235–1244. doi: 10.1038/ng2117. [DOI] [PubMed] [Google Scholar]
- 7.Narlikar L, Gordan R, Hartemink AJ. A nucleosome-guided map of transcription factor binding sites in yeast. PLoS Comput. Biol. 2007;3:e215. doi: 10.1371/journal.pcbi.0030215. [DOI] [PMC free article] [PubMed] [Google Scholar]
- 8.Ozsolak F, Song JS, Liu XS, Fisher DE. High-throughput mapping of the chromatin structure of human promoters. Nat. Biotechnol. 2007;25:244–248. doi: 10.1038/nbt1279. [DOI] [PubMed] [Google Scholar]
- 9.Schones DE, Cui K, Cuddapah S, Roh TY, Barski A, Wang Z, Wei G, Zhao K. Dynamic regulation of nucleosome positioning in the human genome. Cell. 2008;132:887–898. doi: 10.1016/j.cell.2008.02.022. [DOI] [PMC free article] [PubMed] [Google Scholar]
- 10.Jiang C, Pugh BF. Nucleosome positioning and gene regulation: advances through genomics. Nat. Rev. Genet. 2009;10:161–172. doi: 10.1038/nrg2522. [DOI] [PMC free article] [PubMed] [Google Scholar]
- 11.Baldi P, Brunak S, Chauvin Y, Krogh A. Naturally occurring nucleosome positioning signals in human exons and introns. J. Mol. Biol. 1996;263:503–510. doi: 10.1006/jmbi.1996.0592. [DOI] [PubMed] [Google Scholar]
- 12.Kogan S, Trifonov EN. Gene splice sites correlate with nucleosome positions. Gene. 2005;352:57–62. doi: 10.1016/j.gene.2005.03.004. [DOI] [PubMed] [Google Scholar]
- 13.Andersson R, Enroth S, Rada-Iglesias A, Wadelius C, Komorowski J. Nucleosomes are well positioned in exons and carry characteristic histone modifications. Genome Res. 2009;19:1732–1741. doi: 10.1101/gr.092353.109. [DOI] [PMC free article] [PubMed] [Google Scholar]
- 14.Schwartz S, Meshorer E, Ast G. Chromatin organization marks exon-intron structure. Nat. Struct. Mol. Biol. 2009;16:990–995. doi: 10.1038/nsmb.1659. [DOI] [PubMed] [Google Scholar]
- 15.Segal E, Fondufe-Mittendorf Y, Chen L, Thåström A, Field Y, Moore IK, Wang JP, Widom J. A genomic code for nucleosome positioning. Nature. 2006;442:772–778. doi: 10.1038/nature04979. [DOI] [PMC free article] [PubMed] [Google Scholar]
- 16.Ioshikhes IP, Albert I, Zanton SJ, Pugh BF. Nucleosome positions predicted through comparative genomics. Nat. Genet. 2006;38:1210–1215. doi: 10.1038/ng1878. [DOI] [PubMed] [Google Scholar]
- 17.Yuan GC, Liu JS. Genomic sequence is highly predictive of local nucleosome depletion. PLoS Comput. Biol. 2008;4:e13. doi: 10.1371/journal.pcbi.0040013. [DOI] [PMC free article] [PubMed] [Google Scholar]
- 18.Gupta S, Dennis J, Thurman RE, Kingston R, Stamatoyannopoulos JA, Noble WS. Predicting human nucleosome occupancy from primary sequence. PLoS Comput. Biol. 2008;4:e1000134. doi: 10.1371/journal.pcbi.1000134. [DOI] [PMC free article] [PubMed] [Google Scholar]
- 19.Dennis JH, Fan H, Reynolds SM, Yuan G, Meldrim JC, Richter DJ, Peterson DG, Rando OJ, Noble WS, Kingston RE. Independent and complementary methods for large-scale structural analysis of mammalian chromatin. Genome Res. 2007;17:928–939. doi: 10.1101/gr.5636607. [DOI] [PMC free article] [PubMed] [Google Scholar]
- 20.Thanaraj TA, Stamm S, Clark F, Riethoven JJ, Le Texier V, Muilu J. ASD: the alternative splicing database. Nucleic Acids Res. 2004;32:D64–D69. doi: 10.1093/nar/gkh030. [DOI] [PMC free article] [PubMed] [Google Scholar]
- 21.Stamm S, Riethoven JJ, Le Texier V, Gopalakrishnan C, Kumanduri V, Tang Y, Barbosa-Morais NL, Thanaraj TA. ASD: a bioinformatics resource on alternative splicing. Nucleic Acids Res. 2006;34:D46–D55. doi: 10.1093/nar/gkj031. [DOI] [PMC free article] [PubMed] [Google Scholar]
- 22.Zhang LR, Luo LF. Splice site prediction with quadratic discriminant analysis using diversity measure. Nucleic Acids Res. 2003;31:6214–6220. doi: 10.1093/nar/gkg805. [DOI] [PMC free article] [PubMed] [Google Scholar]
- 23.Lv J, Luo LF. Prediction for human transcription start site using diversity measure with quadratic discrimination. Bioinformation. 2008;2:316–321. doi: 10.6026/97320630002316. [DOI] [PMC free article] [PubMed] [Google Scholar]
- 24.Laxton RR. The measure of diversity. J. Theor. Biol. 1978;70:51–67. doi: 10.1016/0022-5193(78)90302-8. [DOI] [PubMed] [Google Scholar]
- 25.Zhang MQ. Identification of protein coding regions in the human genome by quadratic discriminant analysis. Proc. Natl Acad. Sci. USA. 1997;94:565–568. doi: 10.1073/pnas.94.2.565. [DOI] [PMC free article] [PubMed] [Google Scholar]
- 26.Luo LF, Lv J. Sequence pattern recognition in genome analysis. Comp. Modern Sci. Eng.: Proc. Internat. Conf. Comp. Methods Sci. Eng. 2007;963:1278–1281. [Google Scholar]
- 27.Drew HR, Travers AA. DNA bending and its relation to nucleosome positioning. J. Mol. Biol. 1985;186:773–790. doi: 10.1016/0022-2836(85)90396-1. [DOI] [PubMed] [Google Scholar]
- 28.Satchwell SC, Drew HR, Travers AA. Sequence periodicities in chicken nucleosome core DNA. J. Mol. Biol. 1986;191:659–675. doi: 10.1016/0022-2836(86)90452-3. [DOI] [PubMed] [Google Scholar]
- 29.Peckham HE, Thurman RE, Fu Y, Stamatoyannopoulos JA, Noble WS, Struhl K, Weng Z. Nucleosome positioning signals in genomic DNA. Genome Res. 2007;17:1170–1177. doi: 10.1101/gr.6101007. [DOI] [PMC free article] [PubMed] [Google Scholar]
- 30.Mathews DH, Disney MD, Childs JL, Schroeder SJ, Zuker M, Turner DH. Incorporating chemical modification constraints into a dynamic programming algorithm for prediction of RNA secondary structure. Proc. Natl Acad. Sci. USA. 2004;101:7287–7292. doi: 10.1073/pnas.0401799101. [DOI] [PMC free article] [PubMed] [Google Scholar]
- 31.Mathews DH. Using an RNA secondary structure partition function to determine confidence in base pairs predicted by free energy minimization. RNA. 2004;10:1178–1190. doi: 10.1261/rna.7650904. [DOI] [PMC free article] [PubMed] [Google Scholar]
- 32.Hanley JA, McNeil BJ. The meaning and use of the area under a receiver operating characteristic (ROC) curve. Radiology. 1982;143:29–36. doi: 10.1148/radiology.143.1.7063747. [DOI] [PubMed] [Google Scholar]
- 33.Watts JM, Dang KK, Gorelick RJ, Leonard CW, Bess JW, Swanstrom R, Burch CL, Weeks KM. Architecture and secondary structure of an entire HIV-1 RNA genome. Nature. 2009;460:711–716. doi: 10.1038/nature08237. [DOI] [PMC free article] [PubMed] [Google Scholar]
- 34.Merino EJ, Wilkinson KA, Coughlan JL, Weeks KM. RNA structure analysis at single nucleotide resolution by selective 2’-hydroxyl acylation and primer extension (SHAPE) J. Am. Chem. Soc. 2005;127:4223–4231. doi: 10.1021/ja043822v. [DOI] [PubMed] [Google Scholar]
- 35.Gherghe CM, Shajani Z, Wilkinson KA, Varani G, Weeks KM. Strong correlation between SHAPE chemistry and the generalized NMR order parameter (S2) in RNA. J. Am. Chem. Soc. 2008;130:12244–12245. doi: 10.1021/ja804541s. [DOI] [PMC free article] [PubMed] [Google Scholar]
- 36.Benjamin L. GENES VIII. Upper Saddle River, NJ: Pearson Prentice Hall; 2004. [Google Scholar]
- 37.Miele V, Vaillant C, d’Aubenton-Carafa Y, Thermes C, Grange T. DNA physical properties determine nucleosome occupancy from yeast to fly. Nucleic Acids Res. 2008;36:3746–3756. doi: 10.1093/nar/gkn262. [DOI] [PMC free article] [PubMed] [Google Scholar]
- 38.Ito T, Bulger M, Pazin MJ, Kobayashi R, Kadonaga JT. ACF, an ISWI-containing and ATP utilizing chromatin assembly and remodeling factor. Cell. 1997;90:145–155. doi: 10.1016/s0092-8674(00)80321-9. [DOI] [PubMed] [Google Scholar]
- 39.Varga-Weisz PD, Wilm M, Bonte E, Dumas K, Mann M, Becker PB. Chromatin-remodelling factor CHRAC contains the ATPases ISWI and topoisomerase II. Nature. 1997;388:598–602. doi: 10.1038/41587. [DOI] [PubMed] [Google Scholar]
- 40.Saha A, Wittmeyer J, Cairns BR. Mechanisms for nucleosome movement by ATP-dependent chromatin remodeling complexes. Results Probl. Cell Differ. 2006;41:127–148. doi: 10.1007/400_005. [DOI] [PubMed] [Google Scholar]
- 41.Gangaraju VK, Bartholomew B. Mechanisms of ATP-dependent chromatin remodeling. Mutat. Res. 2007;618:3–17. doi: 10.1016/j.mrfmmm.2006.08.015. [DOI] [PMC free article] [PubMed] [Google Scholar]
- 42.Chen W, Luo LF. Classification of antimicrobial peptide using diversity measure with quadratic discriminant analysis. J. Microbiol. Methods. 2009;78:94–96. doi: 10.1016/j.mimet.2009.03.013. [DOI] [PubMed] [Google Scholar]
- 43.Neugebauer KM. On the importance of being co-transcriptional. J. Cell Sci. 2002;115:3865–3871. doi: 10.1242/jcs.00073. [DOI] [PubMed] [Google Scholar]
- 44.Warnecke T, Batada NN, Hurst LD. The impact of the nucleosome code on protein-coding sequence evolution in yeast. PLoS Genet. 2008;4:e1000250. doi: 10.1371/journal.pgen.1000250. [DOI] [PMC free article] [PubMed] [Google Scholar]
- 45.Gao K, Masuda A, Matsuura T, Ohno K. Human branch point consensus sequence is yUnAy. Nucleic Acids Res. 2008;36:2257–2267. doi: 10.1093/nar/gkn073. [DOI] [PMC free article] [PubMed] [Google Scholar]
- 46.Allemand E, Batsché E, Muchardt C. Splicing, transcription, and chromatin: a ménage à trois. Curr. Opin. Genet. Dev. 2008;18:145–151. doi: 10.1016/j.gde.2008.01.006. [DOI] [PubMed] [Google Scholar]
- 47.Smit AFA, Hubley R, Green P. 2009. RepeatMasker open-3.2.7. Available at: http://repeatmasker.org. [Google Scholar]
- 48.Bernstein BE, Liu CL, Humphrey EL, Perlstein EO, Schreiber SL. Global nucleosome occupancy in yeast. Genome Biol. 2004;5:R62. doi: 10.1186/gb-2004-5-9-r62. [DOI] [PMC free article] [PubMed] [Google Scholar]
- 49.Lee CK, Shibata Y, Rao B, Strahl BD, Lieb JD. Evidence for nucleosome depletion at active regulatory regions genome-wide. Nat. Genet. 2004;36:900–905. doi: 10.1038/ng1400. [DOI] [PubMed] [Google Scholar]
- 50.Taft RJ, Pheasant M, Mattick JS. The relationship between non-protein-coding DNA and eukaryotic complexity. BioEssays. 2007;29:288–299. doi: 10.1002/bies.20544. [DOI] [PubMed] [Google Scholar]
- 51.Kolasinska-Zwierz P, Down T, Latorre I, Liu T, Liu XS, Ahringer J. Differential chromatin marking of introns and expressed exons by H3K36me3. Nat. Genet. 2009;41:376–381. doi: 10.1038/ng.322. [DOI] [PMC free article] [PubMed] [Google Scholar]
- 52.Brodsky AS, Meyer CA, Swinburne IA, Hall G, Keenan BJ, Liu XS, Fox EA, Silver PA. Genomic mapping of RNA polymerase II reveals sites of co-transcriptional regulation in human cells. Genome Biol. 2005;6:R64. doi: 10.1186/gb-2005-6-8-r64. [DOI] [PMC free article] [PubMed] [Google Scholar]
- 53.Kornblihtt AR. Coupling transcription and alternative splicing. Adv. Exp. Med. Biol. 2007;623:175–189. doi: 10.1007/978-0-387-77374-2_11. [DOI] [PubMed] [Google Scholar]
- 54.de la Mata M, Alonso CR, Kadener S, Fededa JP, Blaustein M, Pelisch F, Cramer P, Bentley D, Kornblihtt AR. A slow RNA polymerase II affects alternative splicing in vivo. Mol. Cell. 2003;12:525–532. doi: 10.1016/j.molcel.2003.08.001. [DOI] [PubMed] [Google Scholar]
- 55.Zhang C, Li WH, Krainer AR, Zhang MQ. An RNA landscape of evolution for optimal exon and intron discrimination. Proc. Natl Acad. Sci. USA. 2008;105:5797–5802. doi: 10.1073/pnas.0801692105. [DOI] [PMC free article] [PubMed] [Google Scholar]
- 56.Hiller M, Zhang Z, Backofen R, Stammk S. Pre-mRNA secondary structures influence exon recognition. PLoS Genet. 2007;3:e204. doi: 10.1371/journal.pgen.0030204. [DOI] [PMC free article] [PubMed] [Google Scholar]
- 57.Noy A, Pérez A, Lankas F, Luque FJ, Orozco M. Relative flexibility of DNA and RNA: a molecular dynamics study. J. Mol. Biol. 2004;343:627–638. doi: 10.1016/j.jmb.2004.07.048. [DOI] [PubMed] [Google Scholar]
- 58.Pérez A, Noy A, Lankas F, Luque FJ, Orozco M. The relative flexibility of B-DNA and A-RNA duplexes: database analysis. Nucleic Acids Res. 2004;32:6144–6151. doi: 10.1093/nar/gkh954. [DOI] [PMC free article] [PubMed] [Google Scholar]
Associated Data
This section collects any data citations, data availability statements, or supplementary materials included in this article.