

Abstract
A critical assumption in utilizing labeled antibodies is that the conjugation reaction has no deleterious effects on antibody avidity. This study demonstrates that this assumption need not hold true and presents a methodology to quantitatively determine the degree of inactivation and/or changes in antibody-antigen binding that can occur with conjugation. Fluorescein isothiocyanate, FITC, was conjugated to a mouse monoclonal antibody (Fc125) against hemagluttinin (HA) using varying fluorophore:protein (F:P) labeling ratios. Antibody binding, as a function of the F:P labeling ratio, was evaluated using a kinetic ELISA assay and analyzed using global fitting. A two parameter adjustment of the antibody concentration and the maximum rate were sufficient to describe the rate changes. The concentration parameter dominated the rate changes consistent with the hypothesis that the coupling reaction inactivated an increasing fraction of the antibody population with a smaller change (~15 % at the highest F:P ratio) in antibody-antigen binding. An optimal F:P ratio that minimized both inactivation and unlabeled antibody was calculated. This procedure can be utilized to prepare functional, labeled antibody reagents with defined activity and can aid in quantitative applications in which the stoichiometry and functionality of the labeled antibody is critical.
Keywords: antibody, avidity, fluorophore:protein ratio, kinetic ELISA, global fitting, optimal labeling
Introduction
The coupling of fluorescent moieties to antibodies to create labeled antibody reagents, first reported by Coons and collaborators over 60 years ago, has become a routine and important procedure in the biological sciences and medicine [1; 2]. Often, a succinimidyl-ester functional group is attached to a fluorophore core and this functionality confers reaction specificity with primary amines to form fluorophore-antibody conjugates. The presence of multiple primary amines, especially primary amines in the antibody active site, can result in fluorophore conjugation that changes antigen binding characteristics and in the extreme, completely inactivates the antibody [3; 4]. Steric hindrance and the absence of additional reactive sites on the fluorophore are presumed to limit the degree of antibody modification by the conjugation reaction. Furthermore, as commercial protein labeling kits state, antibodies react with fluorophores at different rates and retain biological activity at different degrees of fluorophore labeling (FluoReporter FITC Protein Labeling Kit, Molecular Probes, Invitrogen). Thus, protocols may inadvertently recommend a suboptimal fluorophore to protein ratio for the specific coupling reaction of interest [5; 6; 7]. Moreover, the coupling reaction results in a population of antibodies having a distribution in labeling where the number of fluorescence molecules per antibody is variable and best described by the labeling distribution [8; 9]. Finally, there is a limit to the number of fluorescence molecules that can be attached to an antibody. The presence of multiple fluorophores in close proximity can decrease fluorescence via quenching mechanisms; increased labeling may produce a reagent that is dimmer then one with less labeling [6; 7; 10; 11; 12; 13; 14].
Previous optimization studies identified problems related to under and over antibody labeling including decreases in fluorescence due to too few or many fluorophores, non specific staining, and loss of antibody-antigen specificity [8; 9; 15; 16; 17; 18; 19]. To further understand the role of derivitization in antibody function, an anti-hemaglutinin (HA) monoclonal antibody (Fc125) coupled to fluorescein was evaluated. A microplate kinetic ELISA assay was used to quantitatively evaluate antibody-antigen binding [20; 21; 22; 23; 24; 25]. A Michaelis-Menten model was used to evaluate ELISA rate data as a function of antibody concentration. One strategy to avoid deleterious effects is to reduce the level of labeling. Decreasing the mean number of fluorophore molecules per antibody is hypothesized to decrease the number of antibodies having a deleteriously high number of fluorophores, but may create a significant proportion of unlabeled antibodies. Analysis is developed here to optimally label an antibody sample that takes into consideration these trade-offs. This analysis may be useful in evaluating other antibody conjugations.
Materials and Methods
Antibody and Antigen Preparation
Fc125 anti-HA monoclonal antibodies were prepared from ascites by precipitation with 60% saturated ammonium sulfate followed by affinity purification using a solid-phase protein A adsorbent (UltraLink immobilized protein A, Pierce). FluoReporter FITC Protein Labeling Kit (Molecular Probes) was used to label Fc125. The amount of FITC labeled dye (Component A) was varied (reaction volume 1, 3, and 10 μL) and the corresponding fluorophore:protein (F:P) ratio, based on A280 and A494 absorption readings, was calculated according to the labeling kit instructions including the recommended correction factors for the absorbance of the dye at 280 nm (1.9, 3.7, 7.4, respectively).
Influenza virus (strain A2/Japan/305/57) was obtained from Charles River Laboratories. The virus was cultivated in specific pathogen free (SPF) chicken eggs and purified by centrifugation in a sucrose gradient. Viral envelope protein was extracted by mixing 1 ml viral suspension (2 mg protein / ml) with 1 ml 15% n-octyl-β-D-glucopyranoside (Calbiochem) in PBS (final detergent concentration, 7.5%) and incubating at 23 °C for 30 min. [26]. The suspension was centrifuged at 20,000 × g for 60 min. to remove virus cores, and the supernatant dialyzed into 0.1% n-octyl-β-D-glucopyranoside in PBS. Aliquots of envelope protein (0.5 mg/ml) were stored at -80 °C. Hemagglutinin (HA) represented ~50% of the envelope protein, based on gel electrophoresis.
Kinetic ELISA
Viral envelope protein was diluted to 1 μg/mL in phosphate buffered saline, PBS, and used to coat 96 well immunoassay microplates (Immulon 4 HBX), 100 μl/well, and overnight incubation at 4 °C. The plates were washed (3X) with PBS-Tween20 (0.05%) and blocked with 1% bovine serum albumin, BSA, in PBS. The plates were washed again, and dilutions of either labeled or unlabeled Fc125 antibody were added to the wells and incubated for 60 minutes at room temperature. The plates were washed, and detection antibody (alkaline phosphatase labeled goat anti mouse IgG2b, Southern Biotech), diluted 1:500 in PBS-BSA, was added to the wells, and incubated for 60 minutes. P-nitrophenyl phosphate substrate solution (Southern Biotech) was prepared according to the manufacturer. The plates were washed and substrate solution (100 μl) was added to the wells. OD405 was measured on a plate reader (SpectraMax 250, Molecular Devices) at 1 minute intervals for 15 minutes and the rate was determined from the plot of OD405 vs. time; linearity was verified for every determination. Each dilution of primary antibody was evaluated in triplicate.
The data were fit to a two shared parameter, globally linked Michaelis-Menten kinetics model using commercial software (SigmaPlot v11.0). Antibody avidity and inactivation, measured by changes in the OD405 kinetic ELISA rate as a function of antibody concentration, [Ab], were modeled using
| Equation 1 |
where the maximum rate, Rmax, and antibody concentration at Rmax/2, K1/2, are globally shared parameters linked by vectors α and β. The binding characteristics of the native antibody were defined by setting the appropriate vector components to one indicating that the shared parameters are not modified; the global fitting vectors are of the form [1, α1, α2, …, αn] and [1, β1, β2, …, βn] where the first entries of both vectors correspond to the native antibody and n is the number of different antibody conjugates studied. A change in rate can occur when there is a change in antibody binding to its substrate and/or a change in the concentration of active antibody. We hypothesize that antibody modifications that result in shifts in K1/2 to higher values are due to antibody inactivation, a decrease in the concentration of functional antibody, while a decrease in Rmax represents a decrease in avidity. This hypothesis is consistent with the kinetic components of the kinetic ELISA. The kinetic ELISA consists of three distinct kinetic steps governed by mass action [25]. The first step is the binding of the antigen to the antibody; the second step is the binding of the enzyme linked anti-antibody; the third step is the reaction step that produces the product/readout that follows a Michaelis-Menten equation typical of enzyme kinetics. Changes in antibody avidity would manifest in the first, rate limiting step by a change in the amount of antigen-antibody complex produced.
Results
The kinetic ELISA assay was used to evaluate each of the antibody preparations. Figure 1 shows the dependence of the ELISA rate as a function of Fc125 antibody concentration. Increasing the number of fluorophores per antibody molecule reduced the binding of Fc125 antibody to the antigen, HA. Specifically, higher F:P ratios results in a rightward shift of the rate curve, indicating that higher concentrations of the labeled antibody preparation are required to achieve a given rate in the kinetic ELISA assay. These findings can be explained by three possibilities. First, Rmax may change as a function of fluorophore coupling. Second, fluorophore coupling may change the concentration at Rmax/2, K1/2. Third, both changes in Rmax and K1/2 occur. To identify the origin of the rightward shifts in the rate curves, global fitting of the data was used to calculate global linking vectors α and β for the shared parameters Rmax and K1/2, respectively. Each component of the linking vectors α and β is specific for an individual rate curve. For the linked data set, Rmax and K1/2 were determined to be 361.8 +/- 6.6 mOD405/min and 0.013 +/- 0.000 μg/ml, (fitted value +/- std. error) respectively. The global linking vectors were α = [1, 0.98 +/- 0.02, 0.91 +/- 0.02, 0.84 +/- 0.02] and β = [1, 0.82 +/- 0.04, 0.79 +/- 0.04, 0.57 +/- 0.03] (fitted value +/- std. error). All fitted values were significant at the p < 0.0001 level. Figure 2 shows that with increasing F:P ratio both α and β decrease, indicating that both Rmax and K1/2 were modified, compared to the native antibody, following the coupling reactions. For each fluorophore added, linear regression indicates that the α and β factors decrease by 0.02 and 0.06, respectively; however, the factor modifying K1/2/[Ab], β, has a three-fold greater influence per added fluorophore. Therefore, the dominant effect of fluorophore conjugation is to reduce the concentration of functional antibody.
Figure 1.
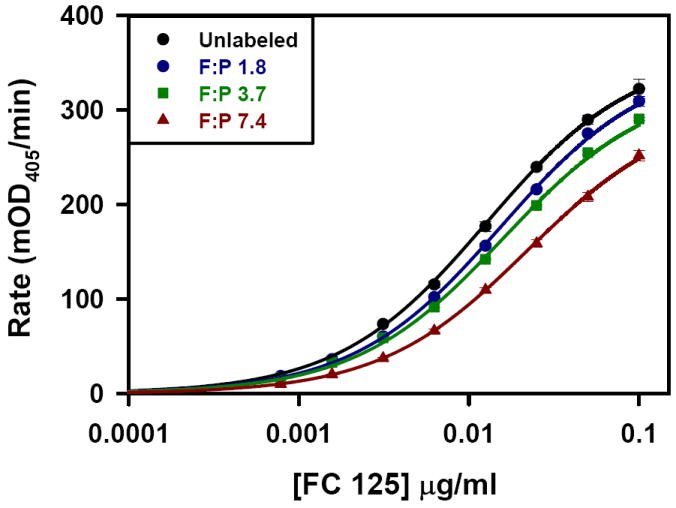
Kinetic ELISA of Fc125 antibody. Fluorophore:Protein dependent rightward shift in the concentration dependent kinetic ELISA rate. The entire data set was fit using Equation 1. The shared parameters, Rmax and K1/2, are the best fit values for the entire data set (361.8 +/- 6.6 mOD405/min and 0.013 +/- 0.000 μg/ml, (fitted value +/- std. error) respectively) while the component values for the vectors α and β are specific to each curve (α = [1, 0.98 +/- 0.02, 0.91 +/- 0.02, 0.84 +/- 0.02] and β = [1, 0.82 +/- 0.04, 0.79 +/- 0.04, 0.57 +/- 0.03] (fitted value +/- std. error).
Figure 2.
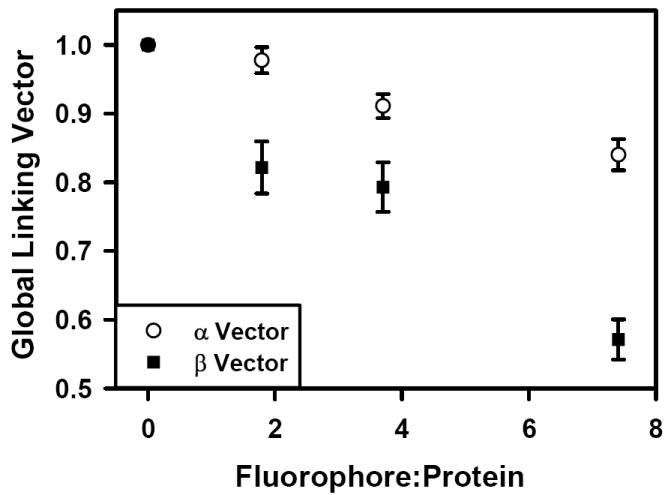
Conjugation dependent changes in the global linking vectors α and β for Rmax and K1/2, respectively. Both parameters are altered by the coupling reaction, although β has a threefold greater influence per added fluorophore.
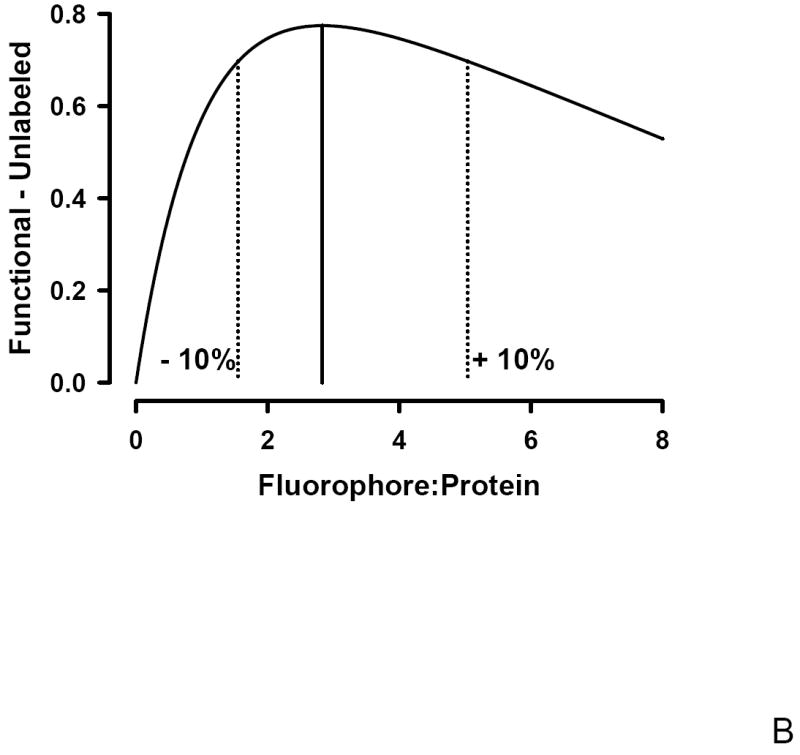
To determine if an optimal F:P ratio exists that maximizes both antibody avidity and degree of labeling following fluorophore conjugation, Poisson statistics were used. Under the hypothesis that the F:P ratio, λ, represents a Poisson average, the fraction of unlabeled antibodies, F(0,λ) is given by F(0,λ) = e-λ. This hypothesis is supported both theoretically and experimentally. Theoretically, the distribution that best describes discrete, low probability events is the Poisson distribution; a protein may have on order 100 potential sites of which < 10 are labeled. Experimentally, support for the Poisson distribution requires demonstrating both discrete labeling and that the amount of each species follows the Poisson distribution; a distribution characterized by only one parameter, the Poisson average. Mass spectrometry work demonstrates that FITC labeling of protein leads to heterogeneous labeling with 0, 1, 2, 3, or n, FITC molecules per protein [27; 28]. A Poisson distribution of labeled proteins was demonstrated using Cy3 labeled anti EGFR antibody [29]. This single molecule imaging study analyzed the distribution of the fluorescence intensity of the antibody labeled with different F:P ratios and found that the percentage of each species observed was in agreement with that expected from a Poisson distribution. In Figure 3A both the fractional decrease in functional antibody, the β linking vector, and the fraction of unlabeled antibody, F(0,λ) are plotted as a function of the F:P ratio. In Figure 3B, the difference between these two curves is shown. The maximum difference, representing optimal labeling, occurs at a F:P ratio of ~2.8; a range of F:P from ~1.6 to 5.0 is within +/- 10% of the optimum and indicated by the dotted lines in Figure 3B. There is a broad range of F:P ratios that minimizes the fraction of unlabeled antibody while still preserving the functionality of the labeled antibody. Preparation of FITC labeled Fc125 anti-HA antibody with a F:P ratio of ~ 3 (Figure 3B) minimizes the unlabeled antibody (~ 6 %, Figure 3A) with an ~ 20% reduction in functional antibody (Figure 2, β) and minimal change in avidity (~ 6 % decrease in Rmax, Figure 2, α).
Figure 3.
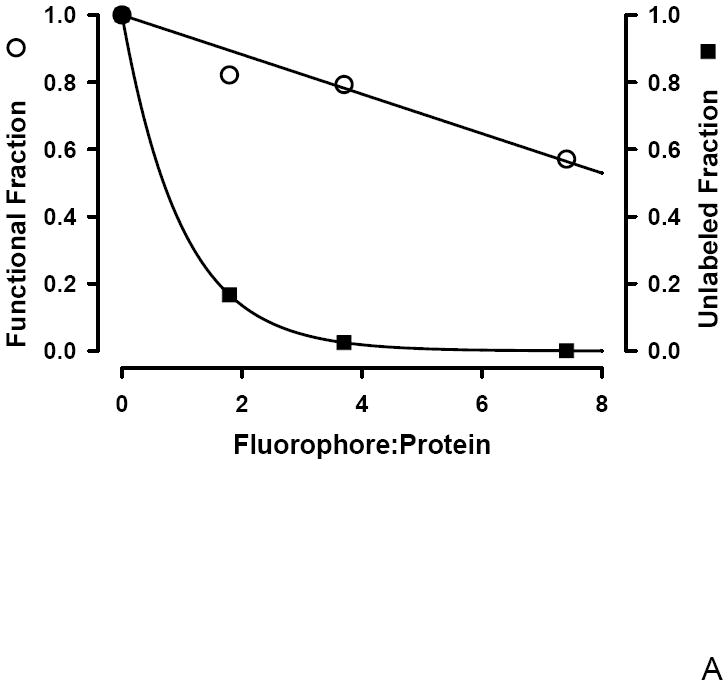
A: Conjugation dependent changes in the functional (○) and unlabeled fractions (■). The unlabeled fraction was calculated using Poisson statistics and the functional fraction is the global linking vector, β.
B: The difference between the functional and unlabeled fractions has a maximum at a Fluorophore:Protein ratio of ~3 representing the optimum conjugation level. The dotted lines represent the +/- 10% range about the optimum and corresponds to a F:P ratio of ~ 2 – 5.
Discussion
The goal of this study was to quantitatively evaluate antibody binding properties as a function of the degree of labeling, the F:P ratio. Fc125 anti-HA antibody was labeled with fluorescein isothiocyanate at different F:P ratios and the conjugated antibodies were evaluated using a kinetic ELISA assay. Global fitting of the kinetic data indicates that the dominant effect of conjugation is to reduce the concentration of functional antibody. Using Poisson statistics, an optimal F:P ratio was determined for this combination of antibody (Fc125) and fluorophore (FITC). The strategy presented is general, and could be applied to other antibody conjugates created with standard labeling procedures.
Problems with under and over conjugated antibodies were previously identified and include reagents that are too dim and/or reagents that produce a large non-specific background [30; 31]. The literature “rule of thumb” is that F:P ratios between 2 – 5 or 2 – 8, depending upon the fluorophore, are “optimal” [5; 6; 8; 9; 30; 32; 33; 34]. In this study, the optimal F:P ratio, ~1.6 – 5, is in agreement with previous estimates but developed using a new minimization metric. Since the use of conjugated antibodies is ubiquitous in biology, biotechnology, and medicine, understanding the influence of F:P ratio on the performance of these reagents is important. For example, in a clinical application, fluorescently labeled antibodies with different F:P ratios have been implicated in image clarity reduction and false negative results in tests for the presence of antigen [35]. The protein annexin V coupled to multiple N-hydroxysuccinimide esters of hydrazinonicotinic acid and FITC have reduced functionality and behave differently from their underivatized form [36]. A quantitative procedure that evaluates both reduced functionality and inactivation as a function of conjugation is useful in characterizing labeled reagents.
Global fitting is an extension of non-linear least squares fitting that is used to analyze multiple data sets simultaneously by sharing parameters across fits. The advantage of this approach is that parameters can be held in common between different data sets and help in creating “over determined” parameters, a prerequisite for adequate minimization. This fitting approach has been described for over 25 years [37; 38], is incorporated in most commercial programs, but it’s use in fitting dose response data has been limited to only a few reports [39; 40; 41]. With an appropriate fitting routine for evaluating the globally linked kinetic ELISA data set, optimized labeling can be quantitatively determined when both the inactivated and unlabeled fractions are known. Antibody inactivation may occur when conjugation takes place within the active site; active site protection has previously been shown to produce an improved antibody preparation [42]. Since labeling protocols rarely include active site protection, conjugation dependent losses are expected unless the antibody has no conjugation reactive site within the active site. The shift in K1/2 is used to quantitatively evaluate the inactivated fraction. Antibody conjugation is hypothesized to follow Poisson statistics based on the report that Annexin V conjugated with FITC follows Poisson statistics [43].
The ability to optimize the properties of a conjugated reagent has benefits in addition to efficient use of the reagent. There are biological determinations where the characterization of the labeled reagent, as described here, is important. Labeled antibodies are used in fluorescence resonance energy transfer (FRET) studies. The relationship between FRET and the concentration of donor and/or acceptor is a metric used to evaluate clustering and domain behaviors [44; 45]. The presence of unlabeled antibody alters the interpretation of antibody concentration dependent FRET while the presence of multiply labeled antibodies directly influences the magnitude of the FRET signal. The characterization may also be important when antibodies are used in routine, but quantitative, determinations where there may be a need to control batch to batch variability in their production.
Conclusion
Optimal antibody conjugation is important for both efficient and quantitative uses of these reagents. In this example, coupling FITC to a mouse monoclonal anti-HA antibody (Fc125) has a minor effect on the avidity but at higher levels of conjugation inactivates a significant fraction. Inactivation and changes in binding properties may occur during any antibody conjugation. This study presents a novel technique for analyzing these effects and establishes a new metric for evaluating conjugation reactions.
Footnotes
Publisher's Disclaimer: This is a PDF file of an unedited manuscript that has been accepted for publication. As a service to our customers we are providing this early version of the manuscript. The manuscript will undergo copyediting, typesetting, and review of the resulting proof before it is published in its final citable form. Please note that during the production process errors may be discovered which could affect the content, and all legal disclaimers that apply to the journal pertain.
References
- 1.Coons AH, Creech HJ, Norman Jones R, Berliner E. The Demonstration of Pneumococcal Antigen in Tissues by the Use of Fluorescent Antibody. 1942:159–170. [Google Scholar]
- 2.Coons AH, Kaplan MH. Localization of antigen in tissue cells; improvements in a method for the detection of antigen by means of fluorescent antibody. J Exp Med. 1950;91:1–13. doi: 10.1084/jem.91.1.1. [DOI] [PMC free article] [PubMed] [Google Scholar]
- 3.Werthen M, Nygren H. Effect of antibody affinity on the isotherm of antibody binding to surface-immobilized antigen. J Immunol Methods. 1988;115:71–8. doi: 10.1016/0022-1759(88)90311-0. [DOI] [PubMed] [Google Scholar]
- 4.McCormack T, O’Keeffe G, Mac Craith B, O’Kennedy R. Assessment of the Effect of Increased Fluorophore Labelling on the Binding Ability of an Antibody. Analytical Letters. 1996;29:953–968. [Google Scholar]
- 5.Haughland RP. Antibody Conjugates for Cell Biology, Current Protocols in Cell Biology. John Wiley & Sons, Inc; 2000. pp. 16.5.1–16.5.22. [DOI] [PubMed] [Google Scholar]
- 6.Haughland RP. Coupling of Monoclonal Antibodies with Fluorophores. In: Davis WC, editor. Methods in Molecular Biology, Vol. 45: Monoclonal Antibody Protocols. pp. 205–221. [DOI] [PubMed] [Google Scholar]
- 7.Der-Balian GP, Kameda N, Rowley GL. Fluorescein labeling of Fab’ while preserving single thiol. Anal Biochem. 1988;173:59–63. doi: 10.1016/0003-2697(88)90159-5. [DOI] [PubMed] [Google Scholar]
- 8.The TH, Feltkamp TE. Conjugation of fluorescein isothiocyanate to antibodies. I. Experiments on the conditions of conjugation. Immunology. 1970;18:865–73. [PMC free article] [PubMed] [Google Scholar]
- 9.The TH, Feltkamp TE. Conjugation of fluorescein isothiocyanate to antibodies. II. A reproducible method. Immunology. 1970;18:875–81. [PMC free article] [PubMed] [Google Scholar]
- 10.Petrou PS, Mastichiadis C, Christofidis I, Kakabakos SE. Glycerin suppression of fluorescence self-quenching and improvement of heterogeneous fluoroimmunoassay sensitivity. Anal Chem. 2007;79:647–53. doi: 10.1021/ac061492m. [DOI] [PubMed] [Google Scholar]
- 11.McDevitt HO, Peters JH, Pollar LW, Harter JG, Coons AH. Purification and Analysis of Luorescein-Labeled Antisera by Column Chromatography. 1962:634–642. [PubMed] [Google Scholar]
- 12.Deka C, Lehnert BE, Lehnert NM, Jones GM, Sklar LA, Steinkamp JA. Analysis of fluorescence lifetime and quenching of FITC-conjugated antibodies on cells by phase-sensitive flow cytometry. Cytometry. 1996;25:271–9. doi: 10.1002/(SICI)1097-0320(19961101)25:3<271::AID-CYTO8>3.0.CO;2-I. [DOI] [PubMed] [Google Scholar]
- 13.Chapple MR, Johnson GD, Davidson RS. Fluorescence quenching; a practical problem in flow cytometry. Journal of Microscopy. 1990;159:245–253. doi: 10.1111/j.1365-2818.1990.tb03030.x. [DOI] [PubMed] [Google Scholar]
- 14.Gruber HJ, Hahn CD, Kada G, Riener CK, Harms GS, Ahrer W, Dax TG, Knaus HG. Anomalous fluorescence enhancement of Cy3 and cy3.5 versus anomalous fluorescence loss of Cy5 and Cy7 upon covalent linking to IgG and noncovalent binding to avidin. Bioconjug Chem. 2000;11:696–704. doi: 10.1021/bc000015m. [DOI] [PubMed] [Google Scholar]
- 15.Pittman B, Herbert GA, Cherry WB, Taylor GC. The quantitation of nonspecific staining as a guide for improvement of fluorescent antibody conjugates. J Immunol. 1967;98:1196–203. [PubMed] [Google Scholar]
- 16.McKay IC, Forman D, White RG. A comparison of fluorescein isothiocyanate and lissamine rhodamine (RB 200) as labels for antibody in the fluorescent antibody technique. Immunology. 1981;43:591–602. [PMC free article] [PubMed] [Google Scholar]
- 17.Goding JW. Conjugation of antibodies with fluorochromes: modifications to the standard methods. J Immunol Methods. 1976;13:215–26. doi: 10.1016/0022-1759(76)90068-5. [DOI] [PubMed] [Google Scholar]
- 18.Goldstein G, Slizys IS, Chase MW. Studies on fluorescent antibody staining. I. Non-specific fluorescence with fluorescein-coupled sheep anti-rabbit globulins. J Exp Med. 1961;114:89–110. doi: 10.1084/jem.114.1.89. [DOI] [PMC free article] [PubMed] [Google Scholar]
- 19.Holmes KL, Lantz LM. Protein Labeling with Fluorescent Probes, Methods in Cell Biology. Academic Press; 2001. pp. 185–204. [DOI] [PubMed] [Google Scholar]
- 20.Reichstein E, Gulck KV, Shami Y. ’Real Time’ Assay of Mouse Immunoglobulin for Optimization of Large Scale Monoclonal Antibody Production. 65 [Google Scholar]
- 21.DiGiacomo RA, Xie L, Cullen C, Indelicato SR. Development and validation of a kinetic assay for analysis of anti-human interleukin-5 monoclonal antibody (SCH 55700) and human interleukin-5 interactions using surface plasmon resonance. Anal Biochem. 2004;327:165–75. doi: 10.1016/j.ab.2004.01.006. [DOI] [PubMed] [Google Scholar]
- 22.Nygren H, Czerkinsky C, Stenberg M. Dissociation of antibodies bound to surface-immobilized antigen. J Immunol Methods. 1985;85:87–95. doi: 10.1016/0022-1759(85)90276-5. [DOI] [PubMed] [Google Scholar]
- 23.Stenberg M, Nygren H. Kinetics of antigen-antibody reactions at solid-liquid interfaces. J Immunol Methods. 1988;113:3–15. doi: 10.1016/0022-1759(88)90376-6. [DOI] [PubMed] [Google Scholar]
- 24.Stenberg M, Stiblert L, Nygren H. External diffusion in solid-phase immunoassays. J Theor Biol. 1986;120:129–40. doi: 10.1016/s0022-5193(86)80169-2. [DOI] [PubMed] [Google Scholar]
- 25.Tsang VC, Wilson BC, Peralta JM. Quantitative, single-tube, kinetic-dependent enzyme-linked immunosorbent assay (k-ELISA) Methods Enzymol. 1983;92:391–403. doi: 10.1016/0076-6879(83)92033-5. [DOI] [PubMed] [Google Scholar]
- 26.Lee BW, Bey RF, Baarsch MJ, Emery DA. Subtype specific ELISA for the detection of antibodies against influenza A H1N1 and H3N2 in swine. J Virol Methods. 1993;45:121–36. doi: 10.1016/0166-0934(93)90097-b. [DOI] [PubMed] [Google Scholar]
- 27.Schnaible V, Przybylski M. Identification of fluorescein-5’-isothiocyanate-modification sites in proteins by electrospray-ionization mass spectrometry. Bioconjug Chem. 1999;10:861–6. doi: 10.1021/bc990039x. [DOI] [PubMed] [Google Scholar]
- 28.Grunwaldt G, Haebel S, Spitz C, Steup M, Menzel R. Multiple binding sites of fluorescein isothiocyanate moieties on myoglobin: photophysical heterogeneity as revealed by ground- and excited-state spectroscopy. J Photochem Photobiol B. 2002;67:177–86. doi: 10.1016/s1011-1344(02)00323-8. [DOI] [PubMed] [Google Scholar]
- 29.Sako Y, Minoghchi S, Yanagida T. Single-molecule imaging of EGFR signalling on the surface of living cells. Nat Cell Biol. 2000;2:168–72. doi: 10.1038/35004044. [DOI] [PubMed] [Google Scholar]
- 30.Chantler S, Batty I. Quality control of fluorescein isothiocyanate-labeled reagents. Ann N Y Acad Sci. 1983;420:68–73. doi: 10.1111/j.1749-6632.1983.tb22190.x. [DOI] [PubMed] [Google Scholar]
- 31.Panchuk-Voloshina N, Haugland RP, Bishop-Stewart J, Bhalgat MK, Millard PJ, Mao F, Leung WY. Alexa dyes, a series of new fluorescent dyes that yield exceptionally bright, photostable conjugates. J Histochem Cytochem. 1999;47:1179–88. doi: 10.1177/002215549904700910. [DOI] [PubMed] [Google Scholar]
- 32.Mao S-Y. Conjugation of Fluorochromes to Antibodies, Methods in Molecular Biology. 1994:43–47. doi: 10.1385/0-89603-285-X:43. [DOI] [PubMed] [Google Scholar]
- 33.Mao S-Y. Conjugation of Fluorochromes to Antibodies. In: Javois LC, editor. Methods in Molecular Biology. Humana Press Inc; Totowa: pp. 35–38. [DOI] [PubMed] [Google Scholar]
- 34.Holmes KL, Lantz LM, Russ W. Conugation of Fluorochromes to Monoclonal Antibodies, Current Protocols in Cytometry. John Wiley & Sons, Inc; 1997. pp. 4.2.1–4.2.12. [DOI] [PubMed] [Google Scholar]
- 35.Tadatsu Y, Muguruma N, Ito S, Tadatsu M, Kusaka Y, Okamoto K, Imoto Y, Taue H, Sano S, Nagao Y. Optimal labeling condition of antibodies available for immunofluorescence endoscopy. J Med Invest. 2006;53:52–60. doi: 10.2152/jmi.53.52. [DOI] [PubMed] [Google Scholar]
- 36.Berlier JE, Rothe A, Buller G, Bradford J, Gray DR, Filanoski BJ, Telford WG, Yue S, Liu J, Cheung CY, Chang W, Hirsch JD, Beechem JM, Haugland RP. Quantitative comparison of long-wavelength Alexa Fluor dyes to Cy dyes: fluorescence of the dyes and their bioconjugates. J Histochem Cytochem. 2003;51:1699–712. doi: 10.1177/002215540305101214. [DOI] [PubMed] [Google Scholar]
- 37.Knutson JR, Beechem JM, Brand L. Simultaneous Analysis of Multiple Fluorescence Decay Curves: A Global Approach. Chemical Physics Letters. 1983;102:501–507. [Google Scholar]
- 38.Nahshol O, Bronner V, Notcovich A, Rubrecht L, Laune D, Bravman T. Parallel kinetic analysis and affinity determination of hundreds of monoclonal antibodies using the ProteOn XPR36. Anal Biochem. 2008 doi: 10.1016/j.ab.2008.08.017. [DOI] [PubMed] [Google Scholar]
- 39.Luo J, Zhou J, Zou W, Shen P. Antibody-antigen interactions measured by surface plasmon resonance: global fitting of numerical integration algorithms. J Biochem. 2001;130:553–9. doi: 10.1093/oxfordjournals.jbchem.a003018. [DOI] [PubMed] [Google Scholar]
- 40.Skrabana R, Skrabanova-Khuebachova M, Kontsek P, Novak M. Alzheimer’s-disease-associated conformation of intrinsically disordered tau protein studied by intrinsically disordered protein liquid-phase competitive enzyme-linked immunosorbent assay. Anal Biochem. 2006;359:230–7. doi: 10.1016/j.ab.2006.09.031. [DOI] [PubMed] [Google Scholar]
- 41.Weinreb GE, Mukhopadhyay K, Majumder R, Lentz BR. Cooperative roles of factor V(a) and phosphatidylserine-containing membranes as cofactors in prothrombin activation. J Biol Chem. 2003;278:5679–84. doi: 10.1074/jbc.M208423200. [DOI] [PubMed] [Google Scholar]
- 42.Imam SA. Labelling of specific antibodies with fluorescein isothiocyanate with protection of the antigen-binding site [proceedings] Biochem Soc Trans. 1979;7:1013–4. doi: 10.1042/bst0071013. [DOI] [PubMed] [Google Scholar]
- 43.Tait JF, Smith C, Levashova Z, Patel B, Blankenberg FG, Vanderheyden JL. Improved detection of cell death in vivo with annexin V radiolabeled by site-specific methods. J Nucl Med. 2006;47:1546–53. [PubMed] [Google Scholar]
- 44.Kenworthy AK, Petranova N, Edidin M. High-resolution FRET microscopy of cholera toxin B-subunit and GPI-anchored proteins in cell plasma membranes. Mol Biol Cell. 2000;11:1645–55. doi: 10.1091/mbc.11.5.1645. [DOI] [PMC free article] [PubMed] [Google Scholar]
- 45.Silvius JR, Nabi IR. Fluorescence-quenching and resonance energy transfer studies of lipid microdomains in model and biological membranes. Mol Membr Biol. 2006;23:5–16. doi: 10.1080/09687860500473002. [DOI] [PubMed] [Google Scholar]