Abstract
Matrix-assisted laser desorption ionization-time of flight mass spectrometry (MALDI-TOF MS) has been widely used for structural characterization of bacterial endotoxins (lipid A). However, the mass spectrometric behavior of the lipid A molecule is highly dependent on the matrix. Furthermore, this dependence is strongly linked to phosphorylation patterns. Using lipid A from Escherichia coli O116 as a model system, we have investigated the effects of different matrices and comatrix compounds on the analysis of lipid A. In this paper, we report a highly sensitive matrix system for lipid A analysis, which consists of 5-chloro-2-mercaptobenzothiazole matrix and EDTA ammonium salt comatrix. This matrix system enhances the sensitivity of the analysis of diphosphorylated lipid A species by more than 100-fold and in addition provides tolerance to high concentrations of sodium dodecyl sulfate (SDS) and tolerance to sodium chloride and calcium chloride at 10 μM, 100 μM, and 10 μM concentrations. The method was further evaluated for analysis of lipid A species with different phosphorylation patterns and from different bacteria, including Helicobacter pylori, Salmonella enterica serovar Riogrande, and Francisella novicida.
Lipopolysaccharide (LPS) is a major component of the outer membranes of Gram-negative bacteria (21). Typically, LPS molecules consist of a hydrophilic carbohydrate portion and a hydrophobic lipid A (or endotoxin). The lipid A molecule consists of a fatty acyl substituted β-d-GlcN-(1-6)-α-GlcN disaccharide unit that usually carries phosphate groups. Diphosphorylated lipid A is generally presumed to be phosphorylated at C-1 and C-4′ positions (9); however, lipid A moieties containing pyrophosphate (PP) groups have also been reported (13). The presence of phosphate groups in lipid A greatly affects the endotoxic properties of LPS (22). Deletion of either of these groups reduces an endotoxic activity of the resulting monophosphorylated LPS by approximately 100-fold (18). For example, monophosphorylated lipid A has been used as an adjuvant in a hepatitis B vaccine in Europe (1, 12).
Mass spectrometry (MS) has been widely used to gain information about the heterogeneity, i.e., the number of different species of lipid A families and a distribution of fatty acids on each glucosamine residue (2, 3, 9, 16, 20, 23, 28, 29, 30, 32, 35, 36). Detailed structural information, including the phosphorylation pattern of lipid A, can be obtained by tandem mass spectrometry. Several matrices have been used for the analysis of lipid A using matrix-assisted laser desorption ionization-time of flight MS (MALDI-TOF MS), including 2,5-dihydroxybenzoic acid (DHB), 2,4,6-trihydroxyacetophenone (THAP), and 6-aza-2-thiothymine (ATT) (8). Although DHB has been widely used for peptide analysis, it produces uneven crystals and leads to poor spot-to-spot reproducibility (3, 6, 11). Furthermore, the low solubility in the solvent compatible with lipid A and nonuniformity in a matrix layer (crystals) can lead to variations in the ionization yield across the sample resulting in formation of “hot” (or “sweet”) spots (14). On the other hand, 5-chloro-2-mercaptobenzothiazole (CMBT) was found to offer excellent spot-to-spot reproducibility because of the homogeneous crystallization of the analyte/matrix mixture over the sample spot (33). CMBT is soluble in methanol-chloroform-water (4:4:1, vol:vol:vol), a solvent compatible with lipid A molecules, especially hexaacylated species. Thus, it has been widely used for lipid A analysis (4, 9, 23, 35, 33). Interestingly, different preparation procedures for analysis of lipid A species dictate a selection of the preferred matrix system (10). For example, lipid A prepared using a TRI Reagent-based procedure with a CMBT matrix was preferable for the detection of phosphoethanolamine modifications (35). On the other hand, the analysis of lipid A prepared using an LPS extraction kit-based procedure with DHB was preferable for the detection of aminoarabinose modification (10). In addition, divalent cations, such as Ca2+ or Mg2+, can bridge the phosphorylated negatively charged groups between neighboring LPS molecules to form aggregates (24). Thus, there is a need for technologies capable of characterizing lipid A from biologically relevant samples in an accurate, rapid, and highly sensitive manner. Here we attempt to establish an optimized MALDI MS matrix system for the sensitive analysis of lipid A, especially its diphosphorylated forms, including both pyrophosphorylated and bisphosphorylated species. We also propose to incorporate a complex reagent (additive or comatrix) for reducing the interference of cations (5, 7, 15).
MATERIALS AND METHODS
Chemicals and materials.
All chemicals were of analytical reagent grade and used as received. Chloroform (CHCl3) and methanol (MeOH) were purchased from EMD Chemicals (Gibbstown, NJ). Distilled water was deionized on a Millipore Milli-Q water reagent system (Billerica, MA). 2,5-Dihydroxybenzoic acid (DHB), 6-aza-2-thiothymine (ATT), and 2,4,6-trihydroxyacetophenone (THAP) were purchased from Fluka (Buchs, Switzerland). 5-Chloro-2-mercaptobenzothiazole (CMBT) and EDTA were purchased from Sigma-Aldrich (St. Louis, MO). EDTA ammonium salt was prepared by the addition of 700 mg EDTA in 1 ml to 30% ammonium hydroxide, followed by lyophilization. Silica gel 60 was purchased from Merck Chemicals (Germany).
Bacteria.
Cells of Escherichia coli O116 and Salmonella enterica serovar Riogrande were from the NRCC collection (19). H. pylori 26695/hp0826:kan isogenic mutant strain expressing a deep-rough inner core LPS was described previously (36). Francisella novicida cells were grown as described previously (31).
LPS extraction and lipid A preparation.
LPS was extracted by the modified enzyme-phenol-water method (31). Lipid A from E. coli, F. novicida, and Salmonella serovar Riogrande were prepared by hydrolyzing LPS in 1% acetic acid at 100°C for 1 h. The resultant lipid A pellet was washed twice with water and extracted with a mixture of chloroform-methanol-water (12:6:1, vol/vol/vol). Lipid A from H. pylori was isolated from whole cells as described previously (36).
Lipid A fractionation by silica gel chromatography.
Twenty milligrams of lipid A from E. coli O116 was loaded onto a silica gel column (1 cm in diameter and 18 cm in length) and eluted first with CHCl3-MeOH-triethylamine (30:5:0.1, vol/vol/vol) and then with solutions with increasing polarity, having CHCl3-MeOH-triethylamine-H2O ratios of 30:5:0.5:0.1, 30:10:0.75:0.1, 30:15:1:0.1, and 40:40:10:0.2 (by volume). The appropriate fractions were lyophilized, dissolved in a mixture of chloroform-methanol-water (4:4:1, vol/vol/vol) at a typical concentration of 0.2 mg/ml for MALDI-TOF MS analysis.
MALDI-TOF MS-MS (tandem TOF MS) analysis.
Lipid A was analyzed using a 4800 MALDI-TOF/TOF analyzer in the negative-ion mode (Applied Biosystems). Lipid A samples were dissolved in a mixture of chloroform-methanol-water (4:4:1, vol/vol/vol). When CMBT was used as the matrix, 1 μl of sample was diluted with an equal volume of CMBT (20 mg/ml in chloroform-methanol-water [4:4:1, vol/vol/vol), and 0.25 μl of this mixture was loaded onto a MALDI target plate. For other matrices, a 0.25-μl aliquot of the lipid A sample was deposited directly on the target plate and covered with the same amount of matrix solution, due to the incompatibility of the matrix solvent and analyte. Other matrices were prepared as described below. The 10-mg/ml ATT solution was prepared using a mixture of water and acetonitrile (1:1, vol/vol). The 10-mg/ml DHB solution was prepared with a mixture of water and acetonitrile (1:4, vol/vol). The 25-mg/ml THAP solution was prepared with a mixture of water and acetonitrile (1:1, vol/vol). Four hundred scans were accumulated for each mass spectrum. Data were acquired in the reflectron mode and processed using Data Explorer (Applied Biosystems).
RESULTS AND DISCUSSION
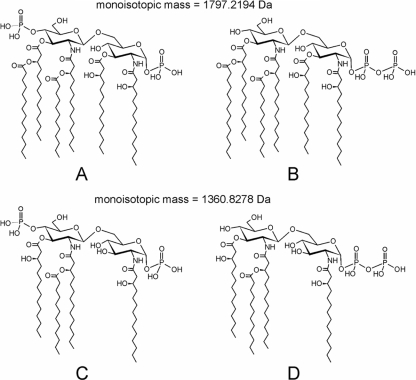
The structures of major diphosphorylated lipid A species from E. coli O116 are illustrated in Fig. 1. The two phosphate groups are generally presumed to be phosphorylated at C-1 and C-4′ positions. However, it has been recently reported that diphosphorylated lipid A from several Gram-negative bacteria produced characteristic high-abundance pyrophosphate ions under a variety of mass spectrometric conditions (9). These findings indicated that diphosphorylated lipid A molecules are heterogeneous mixtures of pyrophosphate structures (Fig. 1B and D) and bisphosphate structures (Fig. 1A and C).
FIG. 1.
Structures of lipid A from E. coli O116. (A to D) Diphosphorylated lipid A molecules are heterogeneous mixtures of pyrophosphate structures (B and D) and bisphosphate structures (A and C).
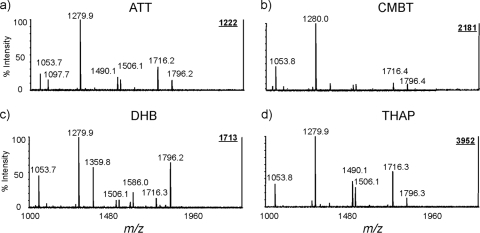
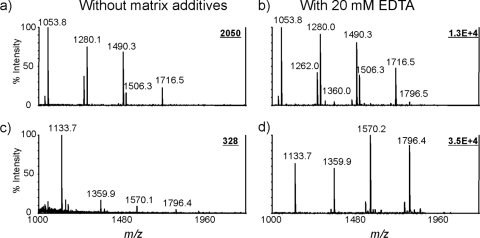
We first compared the performances of commonly used matrices for lipid A analysis, including CMBT, DHB, THAP, and ATT (Fig. 2). We observed that the relative intensities of diphosphorylated and monophosphorylated forms of lipid A were matrix dependent and varied significantly, suggesting that the choice of matrix could potentially affect assignment of the phosphorylation pattern for lipid A. Except for CMBT, lipid A samples and matrix solutions have to be separately spotted on target plates, i.e., overlayer sample preparation. Typically, we applied the matrix solution on top of dried lipid A sample spots. Compared to the spectra obtained with matrices ATT, CMBT, and DHB (Fig. 2a, b, and c), THAP produced a mass spectrum with much higher signal-to-noise ratios (Fig. 2d). In all mass spectra, the most abundant ion was detected at m/z 1,280, corresponding to a monophosphorylated lipid A species with four fatty acid residues. In contrast, the diphosphorylated lipid A species, i.e., m/z 1,360 (tetraacyl) and 1,796 (hexaacyl), were highly matrix dependent. For example, the relative abundance of an ion at m/z 1,796 was much higher than its corresponding monophosphorylated species (e.g., m/z 1,716) when DHB was used as the matrix. For other matrices, the intensities for the ions at m/z 1,360 and 1,796 were significantly weaker than their corresponding monophosphorylated ions at m/z 1,280 and 1,716, respectively. It is highly desirable to have a generally accepted matrix system for lipid A analysis for the direct comparison of mass spectra obtained from different labs and/or different sources, including different matrices, solvents, additives, and sample preparation procedures.
FIG. 2.
MALDI-TOF mass spectra of lipid A from E. coli O116 obtained using different matrices. Four different matrices, ATT (a), CMBT (b), DHB (c), and THAP (d), were used. The samples were spotted onto the MALDI MS target plate first and then each matrix was applied over the spots as a second layer. Laser energy (in arbitrary units) was adjusted based on the matrices used: ATT, 7,000; CMBT, 4,300; DHB, 7,000; THAP, 7,000.
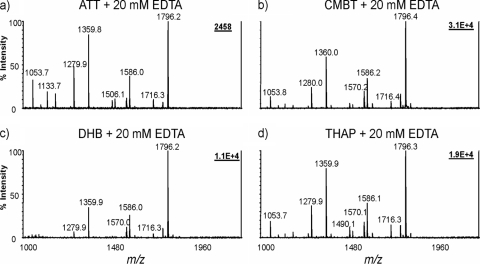
CMBT is the only matrix compound soluble in the solvent compatible with lipid A, thus forming a homogeneous solution of lipid A and matrix prior to its loading on a MALDI MS target plate. It is also noteworthy that CMBT and THAP generally produced more homogeneous crystals on the target plates than ATT and DHB did. Since matrix additives in MALDI mass spectrometry have proven to be an efficient means for phosphopeptide analysis (17, 34), we focused on the optimization of additives for CMBT, including the selection of compounds and their optimal concentrations. We have examined the effects of phosphate, pyrophosphate, EDTA, citrate, borate, sulfate, acetate, oxalic acid, and glycolic acid. Of the additives tested, phosphate, pyrophosphate, sulfate, oxalic acid, citrate, and EDTA had a profound impact on the MALDI MS of lipid A (see Fig. S1 in the supplemental material). Without a matrix additive, the most abundant ion was detected at m/z 1,280, corresponding to a lipid A molecule with four fatty acid residues and one phosphate group attached to the glucosamine backbone. With EDTA ammonium as an additive, the ion intensities of diphosphorylated species at m/z 1,360 (tetraacyl lipid A) and 1,796 (hexaacyl lipid A) were dramatically enhanced. The ions of pentaacyl lipid A species at m/z 1,570 (one C12:0 acyl residue, one C14:0 acyl residue, and three 3-OH C14:0 acyl residues) and m/z 1,586 (one C12:0 acyl residue and four 3-OH C14:0 acyl residues) also exceeded the intensities of their corresponding monophosphorylated lipid A at m/z 1,490 and 1,506, respectively (see Fig. S1 in the supplemental material). Even with the addition of as little as 5 mM EDTA ammonium, the ion intensities of diphosphorylated lipid A species significantly increased (see Fig. S2a in the supplemental material). A concentration of 10 to 20 mM EDTA ammonium was found optimal as the additive for the CMBT matrix solution. Precipitation in the matrix solution was observed when the concentration of EDTA ammonium was above 50 mM. The addition of 20 mM EDTA ammonium to other commonly used matrices resulted in consistent phosphorylation patterns; however, much higher ion intensities were detected with CMBT (Fig. 3).
FIG. 3.
MALDI-TOF mass spectra of lipid A from E. coli O116 obtained with 20 mM EDTA ammonium in different matrices. Four different matrices, ATT (a), CMBT (b), DHB (c), and THAP (d), were used. Other conditions were the same as those in the legend to Fig. 2.
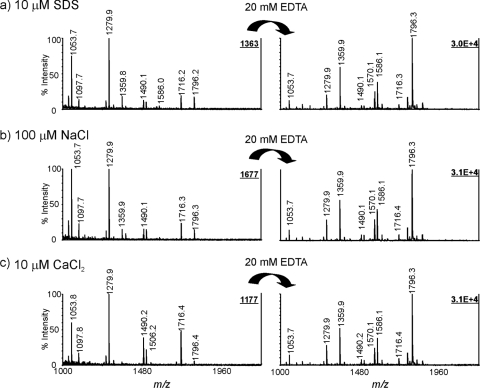
We then investigated the tolerance of SDS and sodium ions with the new matrix system, since the use of milder hydrolysis conditions for lipid A preparation generally involves sodium acetate buffer (pH 4.5) and 1% SDS. Calcium ions were also included, because they are generally present at high concentrations in the growth medium. As shown in Fig. 4, the addition of SDS (Fig. 4a), sodium chloride (Fig. 4b), or calcium chloride (Fig. 4c) to the lipid A samples resulted in lower signal intensities (compared with Fig. 2b). Of SDS, sodium ions, and calcium ions, the presence of calcium ions at the same concentration as sodium and SDS had the strongest inhibition effect, especially on the analysis of lipid A species containing two phosphate groups. As demonstrated in the right-hand panels in Fig. 4, the signal intensities from lipid A samples containing 10 μM SDS, 100 μM Na+, or 10 μM Ca2+ could be completely restored. The results indicate that the addition of EDTA to CMBT not only enhances the detection of lipid A but also improves the tolerance against interfering substances, such as SDS and cations.
FIG. 4.
Effects of SDS and sodium and calcium ions on MALDI MS analysis. The mass spectra obtained without EDTA ammonium added to the CMBT matrix solution are shown in the left panels: lipid A samples were spiked with final concentrations of 10 μM SDS (a), 100 μM NaCl (b), and 10 μM CaCl2 (c). The right panels represent the corresponding spectra with the addition of 20 mM EDTA ammonium to CMBT matrix solution. All mass spectra were acquired in the negative-ion detection mode.
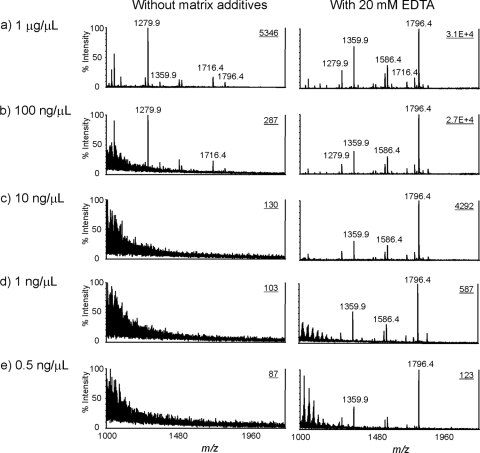
The performance of the proposed matrix system was further validated with serially diluted lipid A samples in the concentration range from 0.5 ng/μl to 1 μg/μl (Fig. 5) . In the concentration range between 0.5 ng/μl and 10 ng/μl, no signal corresponding to lipid A species was detected when CMBT alone was used as the matrix (Fig. 5c, d, and e). In contrast, high-quality spectra were obtained when 20 mM EDTA ammonium was added to CMBT. All major ions could be detected, even with as little as 0.5 ng/μl of lipid A (Fig. 5e, right panel). By comparing the spectra of lipid A samples at increasing concentrations (100 ng/μl to 1 μg/μl) with and without additive, a remarkable enhancement could be achieved. With the addition of EDTA ammonium, the mass spectrum from the sample at a concentration of 100 ng/μl (Fig. 5b) exhibited an improvement in ion intensity for diphosphorylated lipid A species of more than 100-fold, whereas an increase in intensity of about 10-fold was observed for monophosphorylated species. The peaks at m/z 1,716 and 1,796 from the sample at a concentration of 0.5 ng/μl had signal-to-noise (S/N) ratios of 6 and 144, respectively (Fig. 5e).
FIG. 5.
Mass spectra of lipid A in serially diluted solutions obtained with or without the addition of 20 mM EDTA ammonium to the matrix. The concentrations of lipid A were 1 μg/μl (a), 100 ng/μl (b), 10 ng/μl (c), 1 ng/μl (d), and 0.5 ng/μl (e). Other conditions were the same as those in the legend to Fig. 2.
To understand why EDTA ammonium has a highly favorable effect on diphosphorylated lipid A species compared to monophosphorylated forms, we purified the mono- and diphosphorylated forms by fractionation using silica gel column chromatography. The MALDI mass spectra for the isolated phosphoforms were compared with or without additives for the same concentration, i.e., 1 μg/μl of each fraction (Fig. 6). In agreement with results obtained for a total lipid A mixture, the signal enhancement for monophosphorylated species was less than 10-fold, whereas more than 100-fold improvement was achieved for diphosphorylated forms. These results imply that a relatively lower ionization efficiency of diphosphorylated lipid A is not due to ion suppression of monophosphorylated forms. It is caused by a much stronger binding affinity to cations and a consequent formation of aggregates. In other words, the suppression is caused by existing cations, especially divalent ions, which are responsible for poor MALDI MS performance for analysis of diphosphorylated lipid A species.
FIG. 6.
MALDI-TOF MS analysis of monophosphorylated and diphosphorylated lipid A species. The lipid A samples were prepared from E. coli O116. The fractions were collected based on the elution times.
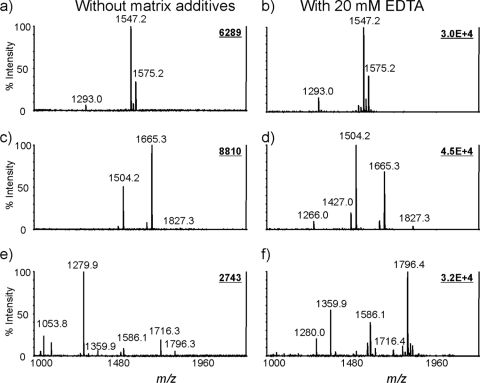
The method was further validated for analysis of lipid A species with different phosphorylated patterns and/or from different bacterial species, including H. pylori, Salmonella serovar Riogrande, and F. novicida (Fig. 7). Figure 7a shows the mass spectrum of lipid A from H. pylori 26695/hp0826:kan which contains a phosphoethanolamine unit linked to the position C-1 of the disaccharide backbone (see Fig. S3 in the supplemental material). It confirms that the addition of EDTA ammonium to the CMBT matrix increases the ion intensities of lipid A but does not significantly change the profile. This is due to the lack of diphosphorylated species in the sample (Fig. 7b). Figure 7c shows the mass spectrum of lipid A from F. novicida, in which the ion at m/z 1,504 corresponds to a monophosphorylated tetraacyl lipid A species and the ion at m/z 1,665 corresponds to the monophosphorylated tetraacyl lipid A with a galactosamine group linked to the phosphate group (see Fig. S3 in the supplemental material). The enhancement effect on the monophosphorylated form is higher than that on the species with an additional galactosamine residue (Fig. 7d). This difference is most likely due to the stronger binding affinity of the phosphate group to cations. Due to structural similarity and identical phosphorylation profile, the effect of matrix additive on the MALDI MS analysis of lipid A from Salmonella serovar Riogrande was similar to that of lipid A from E. coli O116 (Fig. 7e and f).
FIG. 7.
Mass spectra of lipid A from different bacteria obtained with or without the addition of EDTA ammonium to the CMBT matrix. Lipid A samples were prepared from H. pylori (a), F. novicida (c), and Salmonella serovar Riogrande (e) and analyzed using CMBT as the matrix. The samples in panels b, c, and d were obtained with the addition of EDTA ammonium. Other conditions were the same as those in the legend to Fig. 2.
Conclusion.
The phosphorylation of lipid A plays a key role in bacterial pathogenicity; the diphosphorylated forms of lipid A generally are more inflammatory than their corresponding monophosphoryl forms. A newly developed vaccine against swine flu has activated the adjuvant debate and perhaps also highlighted the need for a sensitive analysis of the phosphorylation profiles of lipid A-based adjuvants (25, 26, 27). MALDI MS has been widely used for lipid A analysis; however, inconsistent patterns of phosphorylation have been produced using different matrix systems. We have demonstrated that the combination of CMBT and EDTA as a matrix for MALDI MS analysis of lipid A can profoundly improve the detection limit. Furthermore, tolerance to salts and detergent was also significantly increased. The analysis results for the chromatographically fractionated mono- and diphosphorylated fractions proved that the monophosphorylated species did not originate from the fragmentation of diphosphorylated forms. We believe that this highly sensitive method makes it possible to obtain consistent phosphorylation profiles of phospholipids, thus allowing monitoring and direct comparison of data from different batches, mass spectrometers, and laboratories.
Supplementary Material
Acknowledgments
We thank Kenneth Chan, Jacek Stupak, and Xin Liu for technical support and valuable discussions.
P. Zhou acknowledges financial support from the National Science Foundation of China (grant 20875073).
Footnotes
Published ahead of print on 9 April 2010.
Supplemental material for this article may be found at http://aem.asm.org/.
REFERENCES
- 1.Ambrosch, F., G. Wiedermann, M. Kundi, G. Leroux-Roels, I. Desombere, N. Garcon, C. Thiriart, M. Slaoui, and S. Thoelen. 2000. A hepatitis B vaccine formulated with a novel adjuvant system. Vaccine 18:2095-2101. [DOI] [PubMed] [Google Scholar]
- 2.El-Aneed, A., and J. Banoub. 2005. Elucidation of the molecular structure of lipid A isolated from both a rough mutant and a wild strain of Aeromonas salmonicida lipopolysaccharides using electrospray ionization quadrupole time-of-flight tandem mass spectrometry. Rapid Commun. Mass Spectrom. 19:1683-1695. [DOI] [PubMed] [Google Scholar]
- 3.El Hamidi, A., A. Tirsoaga, A. Novikov, A. Hussein, and M. Caroff. 2005. Microextraction of bacterial lipid A: easy and rapid method for mass spectrometric characterization. J. Lipid Res. 46:1773-1778. [DOI] [PubMed] [Google Scholar]
- 4.Ernst, R. K., E. C. Yi, L. Guo, K. B. Lim, J. L. Burns, M. Hackett, and S. I. Miller. 1999. Specific lipopolysaccharide found in cystic fibrosis airway Pseudomonas aeruginosa. Science 286:1561-1565. [DOI] [PubMed] [Google Scholar]
- 5.Gibbons, H. S., S. Lin, R. J. Cotter, and C. R. Raetz. 2000. Oxygen requirement for the biosynthesis of the S-2-hydroxymyristate moiety in Salmonella typhimurium lipid A. Function of LpxO, a new Fe2+/alpha-ketoglutarate-dependent dioxygenase homologue. J. Biol. Chem. 275:32940-32949. [DOI] [PubMed] [Google Scholar]
- 6.Guo, L., K. B. Lim, J. S. Gunn, B. Bainbridge, R. P. Darveau, M. Hackett, and S. I. Miller. 1997. Regulation of lipid A modifications by Salmonella typhimurium virulence genes phoP-phoQ. Science 276:250-253. [DOI] [PubMed] [Google Scholar]
- 7.Harvey, D. J. 2008. Analysis of carbohydrates and glycoconjugates by matrix-assisted laser desorption/ionization mass spectrometry: an update covering the period 2001-2002. Mass Spectrom. Rev. 27:125-201. [DOI] [PubMed] [Google Scholar]
- 8.Harvey, D. J. 2009. Analysis of carbohydrates and glycoconjugates by matrix-assisted laser desorption/ionization mass spectrometry: an update for 2003-2004. Mass Spectrom. Rev. 28:273-361. [DOI] [PMC free article] [PubMed] [Google Scholar]
- 9.Jones, J. W., S. A. Shaffer, R. K. Ernst, D. R. Goodlett, and F. Turecek. 2008. Determination of pyrophosphorylated forms of lipid A in Gram-negative bacteria using a multivaried mass spectrometric approach. Proc. Natl. Acad. Sci. U. S. A. 105:12742-12747. [DOI] [PMC free article] [PubMed] [Google Scholar]
- 10.Kawasaki, K. 2009. Alternative procedures for analysis of lipid A modification with phosphoethanolamine or aminoarabinose. J. Microbiol. Methods 76:313-315. [DOI] [PubMed] [Google Scholar]
- 11.Kim, S. H., W. Jia, V. R. Parreira, R. E. Bishop, and C. L. Gyles. 2006. Phosphoethanolamine substitution in the lipid A of Escherichia coli O157:H7 and its association with PmrC. Microbiology 152:657-666. [DOI] [PubMed] [Google Scholar]
- 12.Kundi, M. 2007. New hepatitis B vaccine formulated with an improved adjuvant system. Expert Rev. Vaccines 6:133-140. [DOI] [PubMed] [Google Scholar]
- 13.Li, J., and J. C. Richards. 2007. Application of capillary electrophoresis mass spectrometry to the characterization of bacterial lipopolysaccharides. Mass Spectrom. Rev. 26:35-50. [DOI] [PubMed] [Google Scholar]
- 14.Luxembourg, S. L., L. A. McDonnell, M. C. Duursma, X. Guo, and R. M. Heeren. 2003. Effect of local matrix crystal variations in matrix-assisted ionization techniques for mass spectrometry. Anal. Chem. 75:2333-2341. [DOI] [PubMed] [Google Scholar]
- 15.Mahoney, D. J., R. T. Aplin, A. Calabro, V. C. Hascall, and A. J. Day. 2001. Novel methods for the preparation and characterization of hyaluronan oligosaccharides of defined length. Glycobiology 11:1025-1033. [DOI] [PubMed] [Google Scholar]
- 16.Mikhail, I., H. H. Yildirim, E. C. Lindahl, and E. K. Schweda. 2005. Structural characterization of lipid A from nontypeable and type f Haemophilus influenzae: variability of fatty acid substitution. Anal. Biochem. 340:303-316. [DOI] [PubMed] [Google Scholar]
- 17.Nabetani, T., K. Miyazaki, Y. Tabuse, and A. Tsugita. 2006. Analysis of acidic peptides with a matrix-assisted laser desorption/ionization mass spectrometry using positive and negative ion modes with additive monoammonium phosphate. Proteomics 6:4456-4465. [DOI] [PubMed] [Google Scholar]
- 18.Park, B. S., D. H. Song, H. M. Kim, B. S. Choi, H. Lee, and J. O. Lee. 2009. The structural basis of lipopolysaccharide recognition by the TLR4-MD-2 complex. Nature 458:1191-1195. [DOI] [PubMed] [Google Scholar]
- 19.Perry, M. B., and L. L. MacLean. 1992. Structure of the polysaccharide O-antigen of Salmonella riogrande O:40 (group R) related to blood group A activity. Carbohydr. Res. 232:143-150. [DOI] [PubMed] [Google Scholar]
- 20.Phillips, N. J., B. Schilling, M. K. McLendon, M. A. Apicella, and B. W. Gibson. 2004. Novel modification of lipid A of Francisella tularensis. Infect. Immun. 72:5340-5348. [DOI] [PMC free article] [PubMed] [Google Scholar]
- 21.Raetz, C. R., C. M. Reynolds, M. S. Trent, and R. E. Bishop. 2007. Lipid A modification systems in gram-negative bacteria. Annu. Rev. Biochem. 76:295-329. [DOI] [PMC free article] [PubMed] [Google Scholar]
- 22.Rietschel, E. T., T. Kirikae, F. U. Schade, U. Mamat, G. Schmidt, H. Loppnow, A. J. Ulmer, U. Zahringer, U. Seydel, F. Di Padova, et al. 1994. Bacterial endotoxin: molecular relationships of structure to activity and function. FASEB J. 8:217-225. [DOI] [PubMed] [Google Scholar]
- 23.Schilling, B., M. K. McLendon, N. J. Phillips, M. A. Apicella, and B. W. Gibson. 2007. Characterization of lipid A acylation patterns in Francisella tularensis, Francisella novicida, and Francisella philomiragia using multiple-stage mass spectrometry and matrix-assisted laser desorption/ionization on an intermediate vacuum source linear ion trap. Anal. Chem. 79:1034-1042. [DOI] [PMC free article] [PubMed] [Google Scholar]
- 24.Schindler, M., and M. J. Osborn. 1979. Interaction of divalent cations and polymyxin B with lipopolysaccharide. Biochemistry 18:4425-4430. [DOI] [PubMed] [Google Scholar]
- 25.Schubert, C. 2009. Swine flu agitates the adjuvant debate. Nat. Med. 15:986-987. [DOI] [PubMed] [Google Scholar]
- 26.Schubert, C. 2009. Illuminating alum. Nat. Med. 15:985. [DOI] [PubMed] [Google Scholar]
- 27.Schubert, C. 2009. Boosting our best shot. Nat. Med. 15:984-988. [DOI] [PubMed] [Google Scholar]
- 28.Shaffer, S. A., M. D. Harvey, D. R. Goodlett, and R. K. Ernst. 2007. Structural heterogeneity and environmentally regulated remodeling of Francisella tularensis subspecies novicida lipid A characterized by tandem mass spectrometry. J. Am. Soc. Mass Spectrom. 18:1080-1092. [DOI] [PMC free article] [PubMed] [Google Scholar]
- 29.Silipo, A., C. De Castro, R. Lanzetta, A. Molinaro, M. Parrilli, G. Vago, L. Sturiale, A. Messina, and D. Garozzo. 2008. Structural characterizations of lipids A by MS/MS of doubly charged ions on a hybrid linear ion trap/orbitrap mass spectrometer. J. Mass Spectrom. 43:478-484. [DOI] [PubMed] [Google Scholar]
- 30.Silipo, A., R. Lanzetta, A. Amoresano, M. Parrilli, and A. Molinaro. 2002. Ammonium hydroxide hydrolysis: a valuable support in the MALDI-TOF mass spectrometry analysis of lipid A fatty acid distribution. J. Lipid Res. 43:2188-2195. [DOI] [PubMed] [Google Scholar]
- 31.Vinogradov, E., W. J. Conlan, J. S. Gunn, and M. B. Perry. 2004. Characterization of the lipopolysaccharide O-antigen of Francisella novicida (U112). Carbohydr. Res. 339:649-654. [DOI] [PubMed] [Google Scholar]
- 32.Wang, Y., and R. B. Cole. 1996. Acid and base hydrolysis of lipid A from Enterobacter agglomerans as monitored by electrospray ionization mass spectrometry: pertinence to detoxification mechanisms. J. Mass Spectrom. 31:138-149. [DOI] [PubMed] [Google Scholar]
- 33.Xu, N., Z. H. Huang, B. L. De Jonge, and D. A. Gage. 1997. Structural characterization of peptidoglycan muropeptides by matrix-assisted laser desorption ionization mass spectrometry and postsource decay analysis. Anal. Biochem. 248:7-14. [DOI] [PubMed] [Google Scholar]
- 34.Yang, X., H. Wu, T. Kobayashi, R. J. Solaro, and R. B. van Breemen. 2004. Enhanced ionization of phosphorylated peptides during MALDI TOF mass spectrometry. Anal. Chem. 76:1532-1536. [DOI] [PubMed] [Google Scholar]
- 35.Yi, E. C., and M. Hackett. 2000. Rapid isolation method for lipopolysaccharide and lipid A from gram-negative bacteria. Analyst 125:651-656. [DOI] [PubMed] [Google Scholar]
- 36.Zhou, P., V. Chandan, X. Liu, K. Chan, E. Altman, and J. Li. 2009. Microwave-assisted sample preparation for rapid and sensitive analysis of Helicobacter pylori lipid A applicable to a single colony. J. Lipid Res. 50:1936-1944. [DOI] [PMC free article] [PubMed] [Google Scholar]
Associated Data
This section collects any data citations, data availability statements, or supplementary materials included in this article.


