

Abstract
Clonality is, at present, the only means by which the self-renewal potential of a given stem cell can be determined. To assess the clonality of human embryonic stem cells (hESC), a protocol involving seeding wells at low cell densities is commonly used to surmount poor cloning efficiencies. However, factors influencing the accuracy of such an assay have not been fully elucidated. Using clonogenic assays together with time-lapse microscopy, numerical analyses, and regulated gene expression strategies, we found that individual and collective cell movements are inherent properties of hESCs and that they markedly impact the accuracy of clonogenic assays. Analyses of cell motility using mean-square displacement and paired migration correlation indicated that cell movements become more straight-line or ballistic and less random-walk as separation distance decreases. Such motility-induced reaggregation (rather than a true clone) occurs ∼70% of the time if the distance between two hESCs is <6.4 μm, and is not observed if the distance is >150 μm. Furthermore, newly formed small hESC colonies have a predisposition toward the formation of larger colonies through asymmetric colony expansion and movement, which would not accurately reflect self-renewal and proliferative activity of a true hESC clone. Notably, inhibition of Rho-associated kinase markedly upregulated hESC migration and reaggregation, producing considerable numbers of false-positive colonies. Conversely, E-cadherin upregulation significantly augmented hESC clonogenicity via improved survival of single hESCs without influencing cell motility. This work reveals that individual cell movement, asymmetric colony expansion, Rho-associated kinase, and E-cadherin all work together to influence hESC clonogenicity, and provides additional guidance for improvement of clonogenic assays in the analysis of hESC self-renewal.
Introduction
Clonality is an essential parameter in stem cell research because it is the measure of the self-renewal potential of a given stem cell (1–3). In the study of self-renewal of human embryonic stem cells (hESC), several protocols for clonogenic assays have been developed. Some examples include physical isolation of single cells under the microscope (1), serial dilution (4), fluorescence-activated cell sorting of single cells (5,6), and low density plating (3,7–10). However, unknown mechanisms typically lead to massive cell death upon hESC dissociation and extremely low cloning efficiencies (<0.5% ∼ 0.83%) (8,9). Thus, the first three protocols, although likely yielding results that are more accurate, are less practical when used as routine assays. The last protocol, involving the culturing of dissociated single hESCs at a low cell-seeding density in the same well (3,7–10), has often been employed. In this procedure, newly formed clones are observed from day 3 to day 7, and clonogenicity can be further determined by serial plating of resultant clones (3,7,10). Additional means have been developed to improve cloning efficiency, such as inhibition of Rho-associated kinase (ROCK) (8).
Given that cell movements are a major driving force during embryonic development (11–13), it is possible that hESCs may also exhibit considerable motility. It is less clear to what extent cell motility impacts hESC clonogenic assays. The conditions under which the resultant colony size can accurately reflect the proliferative activity of a single founding cell and hESC clone also need to be defined more rigorously. Furthermore, it is less clear whether Rho-associated kinases, which are known to regulate cytoskeleton function, influence hESC motility and readout from such clonogenic assays.
In this report, we provide the first demonstration that individual cell movement, asymmetric colony expansion, and Rho-associated kinase all have an effect on the outcome of clonogenicity. From this work, a number of parameters emerged that should be considered and controlled to interpret autonomous growth and clonogenicity of hESC.
First, to assure the emergence of a clonal structure from a single founding hESC, the plating density should be such that a minimum cell separation of 150 μm can be maintained. Second, to exclude small colonies coalescing through asymmetric expansion or movement, and to assure that the colony size truly reflects the proliferative activity of a hESC clone, regular monitoring is required. Finally, inhibition of Rho-associated kinase markedly increases hESC motility, generating considerable numbers of false-positive colonies via cell reaggregation. As such, small molecules capable of augmenting hESC motility may confound interpretation of clonogenic assays. Conversely, upregulation of E-cadherin expression improves clonogenicity without modifying motility.
Altogether, these findings provide additional guidance for the quality assurance of the clonogenic assay, which remains an essential tool in the study of hESC self-renewal.
Materials and Methods
Culture of hESCs and assessment of undifferentiated markers
H1 and H9 hESC lines were obtained from WiCell Research Institute (Madison, WI) and the CA1 cell line from Mount Sinai Hospital in Toronto (a gift from Dr. Nagy, Samuel Lunenfeld Research Institute, Toronto, Ontario, Canada). All cell lines were approved for use by the local ethics board and the Stem Cell Oversight Committee of the Canadian Institutes of Health Research. Undifferentiated hESC were maintained under feeder-free conditions as previously described (14–17) (see the Supporting Material).
Derivation of E-cadherin Tet-ON expression subclones
See the Supporting Material.
Clonogenic and self-renewal assays of hESCs and ROCK inhibitor treatment
Single hESCs were prepared as previously described (15,18). Briefly, hESC colonies were isolated under a dissecting microscope and dissociated by treatment with collagenase IV for 5 ∼ 10 min, followed by 4-mM EDTA-PBS or PBS-based cell dissociation buffer (Invitrogen, Carlsbad, CA) and passed through a 40-μm cell strainer (BD, Franklin Lakes, NJ). SSEA-3 positive cells were obtained by fluorescence-activated cell sorting as previously described (7), and single cells seeded on Matrigel (BD Biosciences, San Jose, CA) and cultured in mouse embryonic fibroblast-conditioned medium supplemented with 12 ng/mL bFGF. Clonogenic capacity assay was performed as described previously (3,17) but with a plating density of 1000 or 1500 live cells/cm2 for both first and secondary plating (from dissociated first colonies at day 7). Colony number was assessed every day after reseeding. For ROCK inhibitor treatment, Y-27632 (Calbiochem, San Diego, CA) was added to culture medium at a concentration of 10 μM upon seeding cells (8).
Time-lapse microscopy, quantitative cell tracking, and motility analysis
Cells were housed in a LiveCell+ system (Pathology Devices, Westminster, MD) at 37°C, 5% CO2, and 75% humidity. Time-lapse images were acquired every 2 or 5 min up to 72 h using a fully automated model No. DMI6000B microscope (Leica Microsystems, Wetzlar, Germany) equipped with a motorized X-Y-Z stage and a model No. DFC 350 FX digital camera (Leica Microsystems). Four-to-five areas per well were monitored and quantified with AF6000 (Leica Microsystems) or Volocity 4.1 (Improvision, Perkin-Elmer, Waltham, MA) software. Velocity and migratory directionality (D/T) were determined by tracking the centroid position of cells on unprocessed movies using a Track-Objects function (see the Supporting Material). Cell separation was measured from the cell membrane of one cell to the membrane of its nearest-neighbor cells.
Quantitative analysis of individual cell movement
Groups of cells with an initial separation distance of ∼30 μm, 70 μm, and >150 μm were analyzed using the procedure outlined below. The mean-square displacement (MSD), 〈p2(t)〉, was calculated as a function of time interval Δt as described previously (19,20),
where
denotes the Cartesian coordinates of the cell i, t0 denotes the start of time-lapse recording, and
corresponds to the initial position of cell i. The MSD is averaged over all cells at time t = t0 + Δt, and 〈p2(Δt)〉 denotes the arithmetic mean. The time-lapse was carried out either until cells merged or a time period of 10 h elapsed, whichever occurred first. Time intervals of 5, 10, or 20 min were used depending on the aforementioned events.
In general, the MSD behaves according to the asymptotic power-law function of the form
Due to the time-varying behavior of the MSD plot, curve-fitting was carried out in a piecewise fashion, under approximately equal time intervals. Nonlinear curve fitting was performed using the Trust-Region algorithm in MATLAB (The MathWorks, Natick, MA) with 95% confidence intervals.
The spatial correlation of velocity was modified for paired analysis of cells. Most time-lapse videos captured a single pair of cells at any given time, with the endpoint occurring when cellular adhesion occurred. We have termed this the paired migration correlation or Cm:
The terms and represent the velocity vectors of cells a and b, respectively, at time t where
The value is the unit vector that originates from cell a, pointing toward cell b at any time t. The maximum value Cm = 1 represents highly efficient movement by which the cells move toward each other linearly along a line that joins cells a and b. The minimum value Cm = −1 represents cells moving away from each other along the unit vector, while Cm = 0 represents movement orthogonal (i.e., perpendicular) to the unit vector.
Immunocytochemical and alkaline phosphatase staining
Immunofluorescence staining was conducted as described previously (14,15,17). In brief, hESCs were fixed, permeabilized, and incubated with the primary antibodies (goat anti-Oct4, 3 μg/mL, cat. No. sc-8628; Santa Cruz Biotechnology (Santa Cruz, CA) or mouse anti-E-cadherin, 5 μg/mL, clone No. 67A4; Chemicon, Millipore, Billerica, MA), and visualized by incubation with Alexa Fluor 488- or 555-conjugated donkey anti-goat IgG or anti-mouse IgG (1:400 dilution; Molecular Probes, Eugene, OR). Normal goat IgG isotype and normal mouse IgG isotype (Sigma, St. Louis, MO) and antibody diluent alone served as controls. TUNEL staining was carried out using the ApopTag Plus FITC in situ kit (Chemicon) according to the manufacturer's instructions. Alkaline phosphatase staining was performed using Vector Red substrate (Vector Laboratories, Burlingame, CA) (14,21) (see the Supporting Material).
Fluorescence microscopy and image analysis
Immunofluorescence images were obtained by using a FluoView FV1000 confocal microscope (Olympus, Melville, NY) or a model No. DMI6000B microscope (Leica Microsystems). Olympus FluoView or Leica AF6000 software was used for image processing and quantitative analysis. The intensity of E-cadherin fluorescence at cell-cell contacts was measured using line scan function. A total of 40 lines per experiment, 200 pixels in length, were drawn through each junction, and the average pixel intensity for each position along the line was determined. To determine apoptosis, the total number of TUNEL-positive cells and nuclei were counted using Leica software. The percentage of apoptotic cells was calculated as
Data were expressed as fold increase over the control value.
Quantitative PCR and inhibition of stromal-derived factor 1
See the Supporting Material.
Statistical analysis
Statistical significance was determined using a Student's t-test, ANOVA, or χ-square wherever appropriate. Results were considered significant when P < 0.05.
Results
Individual and collective cell movements are intrinsic properties of hESCs
Because individual and collective cell movements represent a major driving force underlying embryonic development (11,12), we reasoned that hESCs, derivatives of the inner cell mass of the early embryo, might also possess these biological behaviors. We therefore examined the motility of adherent individual hESCs in the absence (0.5–1 cell per well) and presence of neighboring cells (Fig. 1).
Figure 1.
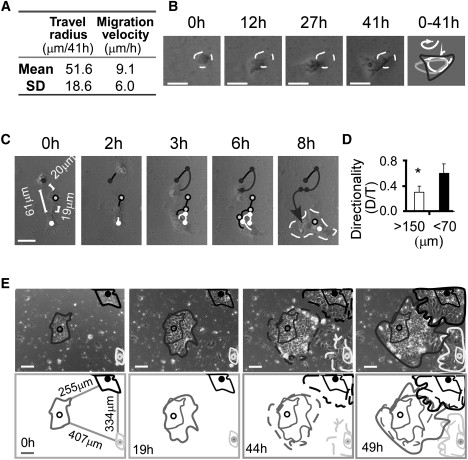
Individual and collective movements are intrinsic properties of hESCs. (A) Quantification of individual hESC movement in the absence of neighboring cells. Motility was calculated as velocity (μm/h) and travel radius (maximum linear distance from the starting point to the point farthest away from the starting point within 41 h). Cell movements were recorded by time-lapse microscopy and quantified by Volocity 4.1 software (Improvision, Perkin-Elmer). Data were pooled from four independent experiments, n = 87 cells. (B) Typical random movement of one hESC in the absence of neighboring cells (one cell per well). In the rightmost panel, lines represent cell localization at each time point and the arrow indicates the direction of cell movement. Bars, 20 μm. See Movie S1. (C) Typical directional movement of individual hESCs with <70 μm of separation distance. Bars, 50 μm. See Movie S2. (D) Quantification of the persistence of migratory directionality of individual hESCs with a separation distance >150 or <70 μm. D/T represents the ratio of the direct distance [D] from the start point to the end point divided by the total length of cell trajectory [T] (22). Data were pooled from four independent experiments; error bars indicate standard deviation (SD) based on n > 150 cells per group. ∗p < 0.05. (E) Asymmetric collective movement/colony expansion of hESCs. Colonies were recorded by time-lapse microscopy 24 h postpassage of hESC clusters. Bars, 100 μm. See Movie S3.
Undifferentiated hESCs were prepared from SSEA-3 positive cells by a flow cytometer sorting or by dissociating undifferentiated colonies selected under a dissecting microscope. SSEA3 has been taken as a marker for undifferentiated hESCs and used in hESC clonogenic assays (3,7,10). The distance between attached cells was measured at the beginning of time-lapse microscopy, and verified by quantitative analyses of time-lapse movies. We found that the travel radius of single hESCs was ∼51.6 ± 18.6 μm (maximum of 88 μm) at an average speed of 9.1 μm/h for a single hESC in the absence of neighboring cells (Fig. 1 A). Similar results were obtained from groups of cells with minimum separation distance >150 μm. The pattern of movement of these cells was akin to that of a particle undergoing random-walk when separation was >150 μm (Fig. 1 B, Movie S1 in the Supporting Material). However, when the separation distance was <70 μm, the movement of individual cells became more organized and directional (Fig. 1 C, Movie S2). This increase in directional migration was initially confirmed and quantified by determining the ratio of the shortest linear distance (D) to the total distance traversed (T) (22). Cells with <70 μm of separation distance had a twofold greater D/T directionality ratio than those with >150 μm of separation (Fig. 1 D, p < 0.05). These results suggest that reduced separation distance between individual hESCs predisposes hESCs to migration toward one another.
We next examined whether hESC colonies exhibited collective movement and directionality, a phenomenon observed in animal tissue and organ development wherein the movement of interconnected cells is highly orchestrated (11). Indeed, dependent on the separation from neighboring colonies, hESC colonies showed directional movement and colony expansion, exhibiting an inclination to merge and form a larger colony (Fig. 1 E and Movie S3). These observations suggest that hESCs are capable of collectively sensing neighboring colonies and responding via concerted migration.
Cell motility and asymmetric colony expansion facilitate hESC reaggregation and impact the accuracy of clonogenic assays
As the transition from random-walk to directional movement depends on the distance between cells (Fig. 1), we attempted to determine which cell-separation distance would assure a true clonogenic assay. We examined the correlation between cell-separation distances and cell-reaggregation frequency (false-positive colonies) (Fig. 2) and found that when the distance between two cells was <6.4 μm (at a plating density of 37,500/cm2), cell reaggregation frequency was ∼77% within 2 h and collective movement occurred shortly after reseeding (Fig. 2 A, Movie S4). Conversely, negligible reaggregation was observed over 20 h if the separation distance between two adjacent cells was >150 μm (>5 cell diameters, at a plating density of ∼1500 cells/cm2) (Fig. 2 C). Short cell-separation distances and occasional reaggregation were exceedingly rare (<0.6%, Fig. 2 C) at such a low plating density, owning primarily to minor inhomogeneities in initial cell distribution. Although 150 μm of separation corresponds to a theoretical plating density of 3564 cells/cm2 (assuming the most efficient packing factor with two-dimensional hexagonal close-packed arrangement; see Fig. 2, D and E), a plating density of ≤1000 cells/cm2 should be considered instead of 1500 cells/cm2 to further minimize this small risk (<0.6%) of uneven cell distribution and subsequent reaggregation of closely appositioned cells.
Figure 2.

Cell-separation distance and cell motility impact clonogenic assays. Cell-separation distances (associated with plating density) inversely correlate with cell-reaggregation frequency (false-positive colonies). With <6.4 μm of cell-separation distance (at a plating density of 37,500/cm2), cell reaggregation occurs immediately after replating and the reaggregation frequency is ∼77% within 2 h (t2) (A and B, and see Movie S4). Conversely, with >150 μm of separation distance (>5 cell diameters), reaggregation does not generally occur; short separation distance and reaggregation are observed only occasionally at a plating density of 1500 cells/cm2 within 20 h (t20) (C). The average cell diameter 2 h postplating is 30.1 ± 2.4 μm (D, n = 196 cells). Theoretically, the plating density based on the most efficient packing factor (two-dimensional hexagonal close-packed) is 3564 cells/cm2 at 150 μm of separation distance (E). For all panels, data are mean ± SD based on n > 150 cells pooled from three independent experiments. Bars, 10 μm.
When reaggregation occurred, cells with an initial separation distance of 30 μm had merged after 100 min and the 70-μm group had merged after 340 min, while the >150-μm group had not merged at up to 4320 min. To more quantitatively examine the relationship between cell separation and movement, we calculated the MSD, the exponent fitting parameter a, and the paired migration correlation (Cm) coefficient (19,20,23) for cells with an initial separation distance of 30, 70, and >150 μm based on our experimental observations (Fig. 1). The MSD plot trend gives an indication as to the predominant type of motion the cells display, with a linear trend corresponding to random-walk and a parabolic trend corresponding to straight line or ballistic motion. When plotted against time, MSD values increased with respect to both time and decreasing cell-separation distances (Fig. 3 A), indicating increased cell directionality and, possibly, velocity. For the 30- and 70-μm groups, the MSD values increased more dramatically toward the end, when cell contact was eminent; the curvature of the MSD plot at later time points appeared more parabolic while that of earlier time points appeared more linear. This contrasts with the >150-μm group, for which cell contact did not occur and the MSD plot remained essentially linear throughout. These findings suggest that some form of cellular communication takes place below a certain threshold separation distance.
Figure 3.
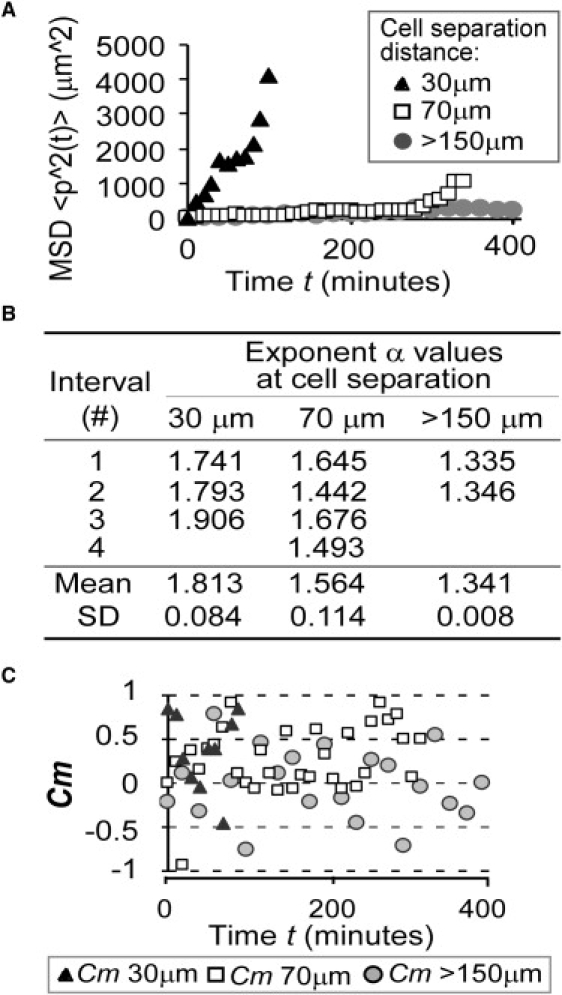
Quantitative analysis of cell movement (A) The mean-square displacement (MSD) values increase with decreasing cell separation distances. Toward the end of cell migration when merging was about to occur (30-μm and 70-μm groups), MSD trends upwards, indicating increased cell velocity. (B) Fitted values of the power-law function exponent a. To provide a better fit, each MSD data set was divided into intervals as shown in the table. The a values increase with decreasing cell separation (one-factor ANOVA, p = 0.004). (C) Paired migration correlation coefficient Cm values increase with decreasing cell separation distance. Two cells undergoing random-walk would have an expected Cm value of 0. This was indeed the case for >150-μm group, for which mean Cm = −0.005 ± 0.088. Mean Cm values for 70-μm and 30-μm groups were 0.273 ± 0.065 and 0.341 ± 0.104, respectively (p < 0.05 compared to >150-μm group individually), indicative of increasing migration toward each other. For all panels, n = 3 independent experiments (50 cells per group).
Calculation of the exponent fitting parameter a from the MSD data provides a more rigorous description of cellular motion. It is well known that a = 1 represents random-walk with the MSD governed by Einstein's equation
and a = 2 represents pure ballistic motion. The exponent a can also be 1 < a < 2, corresponding to the anomalous diffusion induced by temporal and/or spatial correlations (19,23). Due to the temporally varying type of cell motion with transition from random-walk to ballistic as cell separation decreases, a piecewise fitting procedure was carried out to capture these subtleties. A table of the exponent fitting parameter a showed that mean a value increased with decreasing initial cell separation (Fig. 3 B). Moreover, for the 30-μm group, the a values also increased with time, congruent with continually decreasing cell separation due to mutual movement toward each other. The a values demonstrate that cell separation distance directly influences cellular motion and reaggregation, further emphasizing the notion that adequate separation distance is crucial in designing clonogenic assays.
The paired migration correlation Cm is an adaptation of the spatial correlation suited for analyzing pairs of cells. The dot product of individual cell velocity with the unit vector that joins the two cells gives an indication of the efficiency with which the cells move toward each other. A Cm of 1 or −1 indicates movement either directly toward or away from each other, respectively. Cm of 0 indicates movement orthogonal to the unit vector. The Cm values for both 30-μm and 70-μm groups mostly ranged from 0 to 1 while that of >150-μm group was evenly distributed from −1 to 1 (Fig. 3 C). The mean Cm value for the 30-μm group ( = 0.341 ± 0.104) was greater than that of the 70-μm group ( = 0.273 ± 0.065). Both were significantly greater than that of the >150-μm group ( = −0.005 ± 0.088, single-factored ANOVA, p = 0.011). The Cm results suggest that cells moved more efficiently toward each other as separation distances decreased, likely representing improved signaling and/or sensing of each other's presence.
Soluble cytokines and/or chemokines provide one possible means for cells to sense each other (24–27), of which stromal-cell derived factor 1 (SDF-1 or CXCL12) may be a candidate factor. This factor has been found to play crucial roles in a wide range of developmental processes during embryogenesis and in the mediation of cell movements (24). Our initial DNA array results showed that both SDF-1 and its receptor CXCR4 were significantly expressed in undifferentiated hESCs. The next step involved determining whether inhibition of SDF-1 by using a neutralizing antibody would influence the frequency of hESC reaggregation. In comparison to isotype control, addition of SDF-1 antibody to the culture medium resulted in a twofold decrease in cell reaggregation (for cell-separation distances 30–70 μm) (Fig. S1). These results suggest that the SDF-1/CXCR4 axis is a possible contributor to the migration and reaggregation of single hESCs.
Collectively, the above data suggest that appropriate separation distance and its impact on cell motility is an essential criterion for quality assurance of the hESC clonogenic assay. At >150 μm of separation distance between two attached cells (or >5 hESC diameters, beyond the travel radius of 51.6 ± 18.6 μm), regardless of the plating density, single hESCs are devoid of directional movement, therefore yielding more-accurate results from the clonogenic assay. Because uneven cell distribution might still occur even at low seeding densities, the separation distance should be verified 4–6 h postplating to assure sparseness of these attached cells.
Rho-associated kinase activity influences hESC motility and clonogenicity
Because hESC motility markedly impacts the accuracy of the hESC clonogenic assay, and Rho-family GTPases and their effector ROCK are pivotal regulators of cell motility (13,28), we sought to determine to what extent ROCK influenced hESC movement. It has been shown that either inhibition or enhancement of cell movements via ROCK activity is highly dependent on both the cell type and culture conditions (28). For instance, excessive ROCK activity inhibits cell migration, possibly as a result of the formation of strong focal adhesions. Conversely, inhibition of ROCK activity can suppress the invasion of rat hepatoma cells and the migration of metastatic breast cancer cells (28). The role of ROCK in hESC motility has not been fully addressed, although the ROCK inhibitor Y-27632 has been recently reported to augment hESC survival and to enhance clonogenicity (8).
Using the same concentration as previously utilized (8), we found that the ROCK inhibitor Y-27632 dramatically augmented the motility of dissociated hESCs, with subsequent enhancement of cellular reaggregation (Fig. 4 A, Movie S5 and Movie S6). At a plating density of 1500 cells/cm2, exposure of hESCs to Y-27632 resulted in eightfold increase in cell motility. This was reflected in the cell travel radius (i.e., the maximum linear distance from the starting point to the point farthest away from the starting point, Fig. 4 B) and the trajectory of cell migration (Fig. 4 C). As a result, a 30-fold increase in the frequency of cell reaggregation was observed when cells were treated with ROCK inhibitor Y-27632 (Fig. 4 D). These results indicate that suppression of ROCK activity markedly augments hESC motility, such that ∼60% of the resultant colonies in this assay were, in fact, derived from reaggregated cells rather than from a single founding hESC (Fig. 4 D). As such, molecules and growth factors involved in ROCK and Rho-family signaling pathways need to be carefully evaluated to preclude the generation of such false-positive clones when a low cell-density protocol is used to assess the clonogenic capacity of hESCs.
Figure 4.
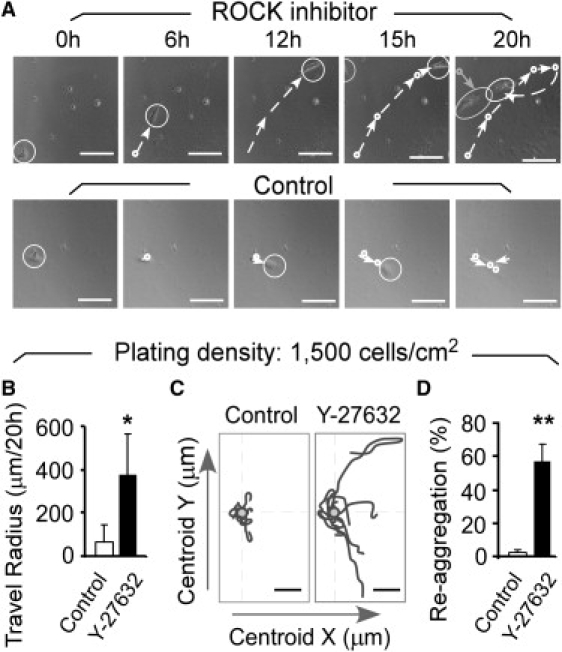
Rock Inhibitor Y-27632 augments cell motility and facilitates reaggregation of hESCs. (A) Representative still images and cell-tracking analyses of individual hESCs in the presence or absence (Control) of ROCK inhibitor Y-27632 (10 μM). The circle defines the cell position and the arrow indicates the cell migration from each successive time point. The few small particles in the images are cell debris, which has been confirmed by time-lapse analyses (see Movie S5 and Movie S6). (B) Y-27632 treatment increases the travel radius (maximum linear distance from the starting point to the point farthest away from the starting point) of dissociated hESCs. (C) Representative plots of centroid positions of cell migration tracks analyzed in panel B. (D) Y-27632 treatment markedly increases cell reaggregation of dissociated hESCs. Cell movements in Fig. 4 were tracked at 5-min intervals over a span of 20 h. Single hESCs at a plating density of 1500 cell/cm2 were seeded onto Matrigel-coated plates (BD Biosciences) and cultured in mouse embryonic fibroblast-conditioned medium in the absence or presence of Y-27632 (10 μM). Data were pooled from three independent experiments; error bars indicate SD based on n > 120 cells in each group. ∗p < 0.05, ∗∗ p < 0.01. Bars, 100 μm (A and C).
A new approach to increase hESC clonogenicity via modulation of E-cadherin without modifying cell motility
Very low cloning efficiency is one of the major hurdles in hESC clonogenic assays in part because dissociated hESCs are highly susceptible to cell death through undetermined mechanisms (8,9). Although ROCK inhibitors show great potency in increasing the number of colonies when seeding wells at low cell-densities (8), an appreciable number of such colonies may be generated from cell reaggregation via increased cell motility. Therefore, development of new approaches capable of increasing clonogenicity without significantly interfering with cell movement is required. In this regard, we have found that inhibition of E-cadherin expression results in the upregulation of the pro-apoptotic gene Caspase-3 and concomitant downregulation of the apoptotic inhibitory gene Bcl-XL (L. Li, L. Moalim-Nour, and S. Wang, unpublished observations). We therefore reasoned that E-cadherin might facilitate the survival of single hESCs and thus improve cloning efficiency. To test this possibility, we utilized a doxycycline-inducible system to conditionally upregulate E-cadherin expression (Fig. 5, A–E) rather than a constitutive E-cadherin overexpression, as the latter tends to cause the formation of embryoid bodies and initiate hESC differentiation (L. Li, L. Moalim-Nour, and S. Wang, unpublished observations).
Figure 5.

Augmenting hESC clonogenic capacity without modifying cell motility via upregulating E-cadherin. (A) Schematic representation of the Tet-ON E-cadherin system. (B–E) Tet-ON E-cadherin hESCs (clones 1–8 from H9 line) exhibit E-cadherin upregulation 24 h postexposure to 1 μg/mL doxycycline (+DOX) (B, quantitative PCR). Forty-eight to 72 h later, these doxycycline-induced hESCs form thick and compact colonies (C), and exhibit more intense membrane E-cadherin staining (D, line-scan analysis, >100 cells per group, average pixel intensity assessed with Leica AF6000 software). These hESCs also express undifferentiated marker Oct4 in the nuclear regions (E). (F) Doxycycline-induced upregulation of E-cadherin markedly enhances the expression of the apoptotic inhibitory gene Bcl-XL and suppresses the pro-apoptotic gene Caspase-3 (quantitative PCR, 24 h after exposure to doxycycline). (G) TUNEL assay. Tet-On E-cadherin hESCs were cultured in the presence and absence of doxycycline (1 μg/mL) for 48–72 h and dissociated into single hESCs. Fourteen hours post-reseeding, apoptosis of hESCs was detected using TUNEL assay. The percentage of apoptotic cells was calculated as described in Materials and Methods. Data were expressed as fold increase over the control value (+DOX). (H) Upregulation of E-cadherin markedly increases clonogenicity in primary and secondary clonogenic assays. Tet-ON E-cadherin hESCs were cultured in the absence or presence of doxycycline (1 μg/mL) for 48–72 h before primary plating. Plating density: 1000 live cells/cm2. (I) Doxycycline-induced E-cadherin upregulation does not augment individual hESC movement. Plots of centroid positions of the representative tracks and the travel radius were quantified from >130 cells in each group and tracked for 20 h. For all panels, data are mean ± SD from three (A–H) or four (I) independent experiments. ∗∗p < 0.01. Bars, 100 μm (C), 20 μm (D and E), and 10 μm (I).
As anticipated, E-cadherin upregulation augmented the expression of apoptotic inhibitory gene Bcl-XL, inhibited the expression of pro-apoptotic gene Caspase-3 (Fig. 5 F), and resulted in a decrease in the number of apoptotic cells after reseeding dissociated hESCs in the clonogenic assay (Fig. 5 G). Furthermore, hESC clonogenicity was increased up to 20-fold, based on both primary and secondary plating assays (Fig. 5 H) (3,7,10). These findings suggest an association between increase in clonogenicity and reduction in cell death, as anticipated. Notably, increased E-cadherin levels had no impact on the motility of individual hESCs in comparison to controls (Fig. 5 I). Together, these results suggest that poor hESC clonogenicity is partially due to the low level expression of E-cadherin, and that upregulation of E-cadherin enhances clonogenic capacity without influencing hESC motility, thus providing an alternate means to improve cloning efficiency.
E-cadherin has been found to demarcate differentiated and undifferentiated hESCs as it is expressed on undifferentiated hESCs and is extinguished after differentiation (29–31). We found that the 98–99% of dissociated hESCs that failed to maintain E-cadherin expression underwent either cell death or differentiation 72 h postseeding (Fig. S2). In contrast, hESCs in multicellular clusters that preserved E-cadherin expression survived and formed typical undifferentiated polyclonal colonies (Fig. S2). This suggests that the individual and collective cell movements seen in dissociated hESCs increases their survival by facilitating the timely reestablishment of E-cadherin mediated cell-cell interactions (Fig. S3). In addition, motility-induced cell reaggregation also improved the recovery of dissociated hESCs after freeze-thawing (Fig. S4). Such improvements could be further enhanced when the ROCK inhibitor Y-27632, previously shown to be capable of reducing apoptosis (8) and augmenting cell motility and reaggregation (Fig. 4), was used on dissociated hESCs post-freeze-thawing (Fig. S4).
Discussion
This work reveals that cell motility is an intrinsic property of hESCs and influences both hESC clonogenic assay and maintenance. For years, clonogenic assay utilizing low-density seeding of dispersed hESCs has been commonly used in self-renewal assays (3,7–10,32). The factors affecting the accuracy of this assay, however, have not been fully elucidated. This study provides that first demonstration that the negative impact of cell movements on the clonogenic assay in the analysis of hESC self-renewal is notable. To ensure that colonies derived from such assays are indeed clonal, several essential parameters need to be considered:
Parameter 1. The hESCs should be evenly distributed during plating.
Parameter 2. Plating density must ensure adequate separation of attached single hESCs (>150 μm of separation distance, ≤1000 cells/cm2).
Parameter 3. Augmentation of hESC motility (which may result from the use of growth factors or small molecules known to influence Rho-associated kinases and Rho family members, and could result in false-positive colonies via enhanced cell reaggregation) must be avoided.
Parameter 4. Frequent monitoring must be performed to exclude colonies formed by asymmetric colony expansion/movement and to ensure that colony size accurately reflects the proliferative activity of a true clone.
Sparseness is crucial for ensuring the validity of the clonogenic assay by way of low-density seeding in the same well regardless of plating density. Cells with large separation distances take longer to merge as a result of a greater degree of random-walk (Figs. 1 and 3). Indeed, beyond a certain separation distance (>150 μm), in the absence of inhibitors of Rho-associated kinases, cells rarely merged. The MSD plot echoes this trend. As cells become closer, there appears to be an accelerated end-phase whereby the MSD increases more rapidly. This terminal ballistic phenomenon is opposite to the molecular movements in natural diffusion whereby the particles behave ballistically for a finite period before colliding into another particle and transitioning to random-walk (20,33).
In the case of hESC, it appears that after the separation distance decreases below a certain range, some form of cellular communication takes place that is either new or is an amplification of a preexisting signal, which results in altered cell movement. The exponent fitting parameter a also shows that as separation distance decreases, cellular movement became more ballistic and less random-walk (Fig. 3), again consistent with a nonrandom process driving cell merging. The observed trend in a values suggest that cells are in fact modifying their movement in response to external cues, and decrease in separation distance appears to increase the efficiency of this movement. Mathematical modeling of chemical gradients from cellular sources also seems to support this notion (34). The calculation of paired migration correlation Cm further corroborates the observation that cells are more efficient at sensing each other's presence as separation distances decreases (Fig. 3). Conversely, if cells do not communicate with each other, then one would expect the average migration correlation () value to be zero irrespective of separation distance, and cellular contact would be dominated by probabilistic encounters and random chance. While the Cm plot (Fig. 3) shows this to be the case when cell separation distance are >150 μm, the Cm values for 70-μm and 30-μm separations range from 0 to 1—again demonstrating that decreased separation distances increases the efficiency by which cells initiate movements toward one another.
Notwithstanding these new observations, a comprehensive understanding of the molecules that directly affect hESCs migration is lacking at present. One possible mode of intercellular communication between hESCs might be via soluble cytokines and/or chemokines in a manner similar to adult cells (24–27). This mode of communication is governed both by physicochemical transport processes and cellular secretion rates, which in turn are determined by genetic and biochemical processes of a given cell type (34). For instance, analysis of the motility of bovine pulmonary artery endothelial cells reveals that the cells appear to sense the presence of one another at distances of ∼40 μm by communication via soluble cytokines or chemokines (35); hematopoietic progenitor cells are aware of each other at a distance of ∼100 μm (34); and our present observations suggest that hESCs sense each other at a distance of ∼50–75 μm. Furthermore, it appears that SDF-1 contributes to the communication of dissociated single hESCs because the addition of a neutralizing antibody against SDF-1 reduces hESC reaggregation (Fig. S1). This observation suggests that a SDF-1 gradient may be present to instruct single hESCs to migrate toward each other. However, additional chemokines as well as the intracellular signaling pathways responsible for directional movement of hESCs toward domains of higher chemokine concentrations remain poorly understood and require further investigation.
In terms of the asymmetric expansion/movement of hESC colonies, many factors could influence this complex process. Potential mechanisms include pathfinder cells, gradients of oxygen or secreted cues (e.g., chemoattractants and repellents), the extracellular matrix (e.g., haptotaxis, contact guidance), and interactions with other cells (e.g., cell reaggregation or contact guidance).
Our current observations also provide the first evidence that inhibition of Rho-associated kinase likely reduces the clonogenic accuracy, when using a low cell-density protocol (Fig. 4). The role of ROCK inhibitor in hESC survival has been further probed via a clonal density culture (one cell/well), although detailed methodology was not provided (8). By excluding doublets and triplets and depositing one cell/well using a flow cytometer, we found that the addition of ROCK inhibitor indeed increased the cloning efficiency in a clonal density culture. However, this was still much lower than the cloning efficiency achieved in a low cell-density culture (1500 cells/cm2). It appears that both antiapoptosis and reaggregation contribute to colony formation during clonogenic assays using a low cell-density protocol with the inhibition of ROCK activity, with reaggregation predominantly responsible for the increase in cloning efficiency. Conversely, upregulation of E-cadherin appears to increase cloning efficiency primarily through the inhibition of apoptosis (Fig. 5), resulting in a higher number of true colonies. Collectively, our study suggests that cell movement needs to be taken into account in clonogenic assays when using a protocol involving seeding wells at low cell densities.
Despite the negative impact on hESC clonogenic assay, individual and collective cell movements are actually beneficial with regard to other aspects of hESCs. Namely, they facilitate colony formation, reduce cell death, and enable better maintenance and cryopreservation of hESCs (Fig. S2, Fig. S3, and Fig. S4). The experimental results using ROCK inhibitors published elsewhere (8,36) and our current findings (Fig. S2, Fig. S3, and Fig. S4) support this notion. Such density-dependent survival of dissociated hESCs can be partially attributed to the timely reestablishment of cell-cell adhesions. Inhibition of ROCK facilitates the migration and reaggregation of dissociated single hESCs (Fig. 4), while E-cadherin mediated cell-cell adhesions prevent the reaggregated cells from moving away from its colony. In addition, inhibition of Rho-associated kinase also reduces E-cadherin diminution after hESC dissociation (L. Li, L. Moalim-Nour, and S. Wang, unpublished observations), which may in turn assist in the E-cadherin mediated cell-cell adhesions. Most recently, Rho GTPase-dependent E-cadherin-mediated traction has been found to play an important role in cell migration during Zebrafish embryogenesis (13). Further studies in the coregulation of Rho GTPases and E-cadherin in cell motility will lead to a better understanding of a wide range of cellular processes during both normal development and disease states (13).
In summary, this work reveals that individual cell movement and asymmetric colony expansion/movement negatively impact the accuracy of the hESC clonogenic assays when using a low-seeding-density approach. Adequate sparseness is essential for the quality assurance of this assay, to reduce cell-cell communication leading to directional motility and subsequent aggregation. Inhibition of Rho-associated kinases markedly augments hESC motility and cell reaggregation, thereby undermining the sparseness criterion and producing false-positive colonies. Conversely, upregulation of E-cadherin provides a new approach for improving hESC clonogenicity without modifying cell motility. These findings provide important additional guidance for the quality control of the clonogenic assay in the studies of hESC self-renewal.
Supporting Material
Additional materials and methods, four figures, and six movies are available at http://www.biophysj.org/biophysj/supplemental/S0006-3495(10)00305-X.
Supporting Material
Acknowledgments
We are grateful to Dr. A. Nagy for providing the CA1 hESC line.
This work was funded by operating grants from the Canadian Institutes of Health Research (CIHR, No. MOP-158235), the J.P. Bickell Foundation, and Genome Canada through the Ontario Genomics Institute (No. 2008-OGI-TD-01) to L.W. We additionally acknowledge that L.W. was supported by a CIHR New Investigator Award (No. MSH-166732) and an Early Research Award from the Ontario Government. L.M.-N. was supported by a CIHR Frederick Banting and Charles Best Canada Graduate Scholarship award, and K.M. was supported by a Canadian Blood Services Fellowship. The authors declare no competing financial interests.
References
- 1.Amit M., Carpenter M.K., Thomson J.A. Clonally derived human embryonic stem cell lines maintain pluripotency and proliferative potential for prolonged periods of culture. Dev. Biol. 2000;227:271–278. doi: 10.1006/dbio.2000.9912. [DOI] [PubMed] [Google Scholar]
- 2.Singec I., Knoth R., Snyder E.Y. Defining the actual sensitivity and specificity of the neurosphere assay in stem cell biology. Nat. Methods. 2006;3:801–806. doi: 10.1038/nmeth926. [DOI] [PubMed] [Google Scholar]
- 3.Bendall S.C., Stewart M.H., Bhatia M. IGF and FGF cooperatively establish the regulatory stem cell niche of pluripotent human cells in vitro. Nature. 2007;448:1015–1021. doi: 10.1038/nature06027. [DOI] [PubMed] [Google Scholar]
- 4.Chan E.M., Yates F., Daley G.Q. Enhanced plating efficiency of trypsin-adapted human embryonic stem cells is reversible and independent of trisomy 12/17. Cloning Stem Cells. 2008;10:107–118. doi: 10.1089/clo.2007.0064. [DOI] [PubMed] [Google Scholar]
- 5.Sidhu K.S., Tuch B.E. Derivation of three clones from human embryonic stem cell lines by FACS sorting and their characterization. Stem Cells Dev. 2006;15:61–69. doi: 10.1089/scd.2006.15.61. [DOI] [PubMed] [Google Scholar]
- 6.Hewitt Z., Forsyth N.R., McWhir J. Fluorescence-activated single cell sorting of human embryonic stem cells. Cloning Stem Cells. 2006;8:225–234. doi: 10.1089/clo.2006.8.225. [DOI] [PubMed] [Google Scholar]
- 7.Stewart M.H., Bossé M., Bhatia M. Clonal isolation of hESCs reveals heterogeneity within the pluripotent stem cell compartment. Nat. Methods. 2006;3:807–815. doi: 10.1038/nmeth939. [DOI] [PubMed] [Google Scholar]
- 8.Watanabe K., Ueno M., Sasai Y. A ROCK inhibitor permits survival of dissociated human embryonic stem cells. Nat. Biotechnol. 2007;25:681–686. doi: 10.1038/nbt1310. [DOI] [PubMed] [Google Scholar]
- 9.Pyle A.D., Lock L.F., Donovan P.J. Neurotrophins mediate human embryonic stem cell survival. Nat. Biotechnol. 2006;24:344–350. doi: 10.1038/nbt1189. [DOI] [PubMed] [Google Scholar]
- 10.O'Connor M.D., Kardel M.D., Eaves C.J. Alkaline phosphatase-positive colony formation is a sensitive, specific, and quantitative indicator of undifferentiated human embryonic stem cells. Stem Cells. 2008;26:1109–1116. doi: 10.1634/stemcells.2007-0801. [DOI] [PubMed] [Google Scholar]
- 11.Montell D.J. Morphogenetic cell movements: diversity from modular mechanical properties. Science. 2008;322:1502–1505. doi: 10.1126/science.1164073. [DOI] [PubMed] [Google Scholar]
- 12.Yang J., Weinberg R.A. Epithelial-mesenchymal transition: at the crossroads of development and tumor metastasis. Dev. Cell. 2008;14:818–829. doi: 10.1016/j.devcel.2008.05.009. [DOI] [PubMed] [Google Scholar]
- 13.Kardash E., Reichman-Fried M., Raz E. A role for Rho GTPases and cell-cell adhesion in single-cell motility in vivo. Nat. Cell Biol. 2010;12:47–53. doi: 10.1038/ncb2003. [DOI] [PubMed] [Google Scholar]
- 14.Wang L., Li L., Bhatia M. Human embryonic stem cells maintained in the absence of mouse embryonic fibroblasts or conditioned media are capable of hematopoietic development. Blood. 2005;105:4598–4603. doi: 10.1182/blood-2004-10-4065. [DOI] [PubMed] [Google Scholar]
- 15.Wang L., Li L., Bhatia M. Endothelial and hematopoietic cell fate of human embryonic stem cells originates from primitive endothelium with hemangioblastic properties. Immunity. 2004;21:31–41. doi: 10.1016/j.immuni.2004.06.006. [DOI] [PubMed] [Google Scholar]
- 16.Wang L., Menendez P., Bhatia M. Generation of hematopoietic repopulating cells from human embryonic stem cells independent of ectopic HOXB4 expression. J. Exp. Med. 2005;201:1603–1614. doi: 10.1084/jem.20041888. [DOI] [PMC free article] [PubMed] [Google Scholar]
- 17.Li L., Wang S., Wang L. A unique interplay between Rap1 and E-cadherin in the endocytic pathway regulates self-renewal of human embryonic stem cells. Stem Cells. 2010;28:247–257. doi: 10.1002/stem.289. [DOI] [PubMed] [Google Scholar]
- 18.Wang L., Menendez P., Bhatia M. Hematopoietic development from human embryonic stem cell lines. Exp. Hematol. 2005;33:987–996. doi: 10.1016/j.exphem.2005.06.002. [DOI] [PubMed] [Google Scholar]
- 19.Rieu J.P., Upadhyaya A., Sawada Y. Diffusion and deformations of single hydra cells in cellular aggregates. Biophys. J. 2000;79:1903–1914. doi: 10.1016/S0006-3495(00)76440-X. [DOI] [PMC free article] [PubMed] [Google Scholar]
- 20.Haga H., Irahara C., Kawabata K. Collective movement of epithelial cells on a collagen gel substrate. Biophys. J. 2005;88:2250–2256. doi: 10.1529/biophysj.104.047654. [DOI] [PMC free article] [PubMed] [Google Scholar]
- 21.Chadwick K., Wang L., Bhatia M. Cytokines and BMP-4 promote hematopoietic differentiation of human embryonic stem cells. Blood. 2003;102:906–915. doi: 10.1182/blood-2003-03-0832. [DOI] [PubMed] [Google Scholar]
- 22.Pankov R., Endo Y., Yamada K.M. A Rac switch regulates random versus directionally persistent cell migration. J. Cell Biol. 2005;170:793–802. doi: 10.1083/jcb.200503152. [DOI] [PMC free article] [PubMed] [Google Scholar]
- 23.Morgado R., Oliveira F.A., Hansen A. Relation between anomalous and normal diffusion in systems with memory. Phys. Rev. Lett. 2002;89:100601. doi: 10.1103/PhysRevLett.89.100601. [DOI] [PubMed] [Google Scholar]
- 24.Raz E., Mahabaleshwar H. Chemokine signaling in embryonic cell migration: a fisheye view. Development. 2009;136:1223–1229. doi: 10.1242/dev.022418. [DOI] [PubMed] [Google Scholar]
- 25.Villablanca E.J., Mora J.R. A two-step model for Langerhans cell migration to skin-draining LN. Eur. J. Immunol. 2008;38:2975–2980. doi: 10.1002/eji.200838919. [DOI] [PMC free article] [PubMed] [Google Scholar]
- 26.Bromley S.K., Mempel T.R., Luster A.D. Orchestrating the orchestrators: chemokines in control of T cell traffic. Nat. Immunol. 2008;9:970–980. doi: 10.1038/ni.f.213. [DOI] [PubMed] [Google Scholar]
- 27.Tiveron M.C., Cremer H. CXCL12/CXCR4 signaling in neuronal cell migration. Curr. Opin. Neurobiol. 2008;18:237–244. doi: 10.1016/j.conb.2008.06.004. [DOI] [PubMed] [Google Scholar]
- 28.Riento K., Ridley A.J. Rocks: multifunctional kinases in cell behavior. Nat. Rev. Mol. Cell Biol. 2003;4:446–456. doi: 10.1038/nrm1128. [DOI] [PubMed] [Google Scholar]
- 29.Eastham A.M., Spencer H., Ward C.M. Epithelial-mesenchymal transition events during human embryonic stem cell differentiation. Cancer Res. 2007;67:11254–11262. doi: 10.1158/0008-5472.CAN-07-2253. [DOI] [PubMed] [Google Scholar]
- 30.D'Amour K.A., Agulnick A.D., Baetge E.E. Efficient differentiation of human embryonic stem cells to definitive endoderm. Nat. Biotechnol. 2005;23:1534–1541. doi: 10.1038/nbt1163. [DOI] [PubMed] [Google Scholar]
- 31.Carpenter M.K., Frey-Vasconcells J., Rao M.S. Developing safe therapies from human pluripotent stem cells. Nat. Biotechnol. 2009;27:606–613. doi: 10.1038/nbt0709-606. [DOI] [PubMed] [Google Scholar]
- 32.Forsyth N.R., Musio A., McWhir J. Physiologic oxygen enhances human embryonic stem cell clonal recovery and reduces chromosomal abnormalities. Cloning Stem Cells. 2006;8:16–23. doi: 10.1089/clo.2006.8.16. [DOI] [PubMed] [Google Scholar]
- 33.Schnitzer M.J. Theory of continuum random walks and application to chemotaxis. Phys. Rev. E Stat. Phys. Plasmas Fluids Relat. Interdiscip. Topics. 1993;48:2553–2568. doi: 10.1103/physreve.48.2553. [DOI] [PubMed] [Google Scholar]
- 34.Francis K., Palsson B.O. Effective intercellular communication distances are determined by the relative time constants for cyto/chemokine secretion and diffusion. Proc. Natl. Acad. Sci. USA. 1997;94:12258–12262. doi: 10.1073/pnas.94.23.12258. [DOI] [PMC free article] [PubMed] [Google Scholar]
- 35.Lee Y., McIntire L.V., Zygourakis K. Analysis of endothelial cell locomotion: differential effects of motility and contact inhibition. Biotechnol. Bioeng. 1994;43:622–634. doi: 10.1002/bit.260430712. [DOI] [PubMed] [Google Scholar]
- 36.Li X., Krawetz R., Rancourt D.E. ROCK inhibitor improves survival of cryopreserved serum/feeder-free single human embryonic stem cells. Hum. Reprod. 2009;24:580–589. doi: 10.1093/humrep/den404. [DOI] [PubMed] [Google Scholar]
Associated Data
This section collects any data citations, data availability statements, or supplementary materials included in this article.