

Abstract
Mathematical analysis and modeling of biochemical reaction networks requires knowledge of the permitted directionality of reactions and membrane transport processes. This information can be gathered from the standard Gibbs energy changes (ΔG0) of reactions and the concentration ranges of their reactants. Currently, experimental ΔG0 values are not available for the vast majority of cellular biochemical processes. We propose what we believe to be a novel computational method to infer the unknown ΔG0 value of a reaction from the known ΔG0 value of the chemically most similar reaction. The chemical similarity of two arbitrary reactions is measured by the relative number (T) of co-occurring changes in the chemical attributes of their reactants. Testing our method across a validated reference set of 173 biochemical reactions with experimentally determined ΔG0 values, we found that a minimum reaction similarity of T = 0.6 is required to infer ΔG0 values with an error of <10 kJ/mol. Applying this criterion, our method allows us to assign ΔG0 values to 458 additional reactions of the BioPath database. We believe our approach permits us to minimize the number of ΔG0 measurements required for a full coverage of a given reaction network with reliable ΔG0 values.
Introduction
The value of the Gibbs energy change (ΔG) of a reaction is additively composed of a standard value (ΔG0) and the logarithmic concentrations of its reactants. Given ΔG0 and the range within which the concentrations of reactants may vary determines the possible signs of ΔG (negative or positive) and hence the permitted directionality of a reaction (forward or backward). This knowledge is essential for the construction of reliable flux distributions in stoichiometric networks (1–4) as well as for kinetic network modeling (5,6) as ΔG0 is related directly to the equilibrium constant of a reaction entering the enzymatic rate equation.
The advent of automated and rapid DNA sequencing methods in combination with high-throughput expression profiling has paved the way for the reconstruction of cellular metabolic networks on genome-scale. The computational analysis of such networks, regardless whether carried out by means of topological methods (7), flux balance analysis (8,9) or kinetic models requires reliable ΔG0 values to correctly constrain the possible directionality of reactions and membrane transport processes. Currently, only for a small fraction of reported biochemical reactions experimental ΔG0 values are available (10). Thus, reliable computational methods for the estimation of ΔG0 values are required.
The group contribution method (GCM) developed by Mavrovouniotis (11,12) and extended by Jankowsky et al. (13) is currently a broadly applied method for the computational prediction of ΔG0 values. The core of this method consists in the representation of the Gibbs energy G0 of any molecule by the sum of the energies of formation of its constituting atomic groups (in the following referred to as formation energies). ΔG0 is then calculated as difference of the G0 values of products and substrates. In the computational analysis of large-scale metabolic networks the estimation of ΔG0 values by means of the GCM is currently the method of choice (13–16). However, for several methodological reasons (discussed below) the accuracy of GCM is limited. For example, for ∼25% of the 79 compounds contained in the University of Minnesota Biocatalysis/Biodegradation Database of xenobiotic degradation pathways (17) the experimentally determined values of formation energies differ from their respective GCM estimates by more than 7.9 kJ/mol that corresponds to an uncertainty factor of ∼20 in the concentration value. Thus, in the worst case the uncertainty of the ΔG0 value of a bimolecular reaction estimated on the basis of formation energies may be in the range of 30 kJ/mol, which is the value of the standard Gibbs energy of ATP hydrolysis, a definitely irreversible reaction.
This situation prompted us to develop what we believe to be a novel method enabling a more accurate estimation of ΔG0 values. Our approach relies on the assumption that chemically similar reactions should possess similar ΔG0 values. The essence of our concept is to define an appropriate quantitative measure to quantify the similarity of two arbitrary chemical reactions and to replace the unknown ΔG0 value of a reaction by the known ΔG0 value of the chemically most similar reaction.
Method and Databases Used
Selection of a representative training set of biochemical reactions
Our method, inferring Gibbs energy changes from reaction similarities (IGERS), is based on a detailed characterization of a chemical reaction by a binary reaction vector. The construction of the reaction vector requires the knowledge of atom-to-atom transition matrices mapping the atoms (excluding hydrogen) of the reaction substrates to the atoms of the reaction products (18). We selected from the Biochemical Pathways database (BioPath, Erlangen, Germany), version 2 (19,20) a set of 1546 distinct biochemical reactions for which 2D structures of the reactants and atom-to-atom transition matrices are known.
Selection of a reference set of reactions with experimentally determined ΔG0 values
For the validation of our method, we have chosen a set of 173 metabolic reactions for which Kümmel et al. (3) have calculated standard transformed Gibbs energies for physiological conditions (pH of 7.6 and ionic strength of 0.15 M) based on standard reactant Gibbs energies compiled from Alberty (21), the National Institute of Standards and Technology database (10), and Tewari et al. (22,23).
Construction of atom transition matrices
For 69 reactions of the reference set atom-to-atom transition matrices were not contained in the BioPath database. For the fraction of atoms belonging to the chemical reaction center the transitions were partially taken from the Kyoto Encyclopedia of Genes and Genomes database (24) or reconstructed manually. For the residual fractions of atoms the transitions were taken from reactions including chemically analogous reactants for which transition matrices are available in the BioPath database.
Definition of chemical attributes
For each metabolite occurring in a biochemical reaction reported in the BioPath database chemical attributes were assigned to the constituting atomic groups. The list of chemical attributes was manually compiled by inspecting the chemical structure of metabolites found in biochemistry text books and in the Kyoto Encyclopedia of Genes and Genomes database of biochemical metabolites (24). Care was taken to include into the definition of attributes information on the chemistry of neighboring atoms to distinguish between identical atomic groups occurring in chemically different molecules. This resulted in a group of 170 different attributes that take into account the local topology of an atom in a depth of at least three bonds (Table 1). These attributes were combined with another group of 59 additional attributes indicating the substituent at α position. For example, the attribute combination α-methyl-ketone indicates a carbon that carries the attribute ketone and has an adjacent carbon carrying the descriptor methyl. In total, 4720 such combinations of attributes were implemented. Additionally, the following physico-chemical attributes were added to each nonhydrogen atom: hybridization state, oxidative number, partial charge, absolute charge, number of free electron pairs, conjugated systems, number and type of valence bonds, and general atom type defined according to Wang et al. (25). As an example, Fig. 1 depicts the chemical attributes assigned to the nonhydrogen atoms of the pyruvate molecule.
Table 1.
Generic chemical attributes used to specify atom types
| Atom type | Attributes (n) | Example |
|---|---|---|
| Carbon | 56 | C of methyl group |
| Oxygen | 20 | O of hydroxyl group |
| Nitrogen | 13 | N of amide group |
| Phosphate | 5 | P of phosphoanhydride group |
| Sulfur | 8 | S of thiol group |
| Hydrogen | 3 | H of water |
| Amino acids, sugars, sterol | 23 | Glycine |
| Ring systems | 21 | Benzene ring |
| Other | 20 | sp2-hybrid |
Attributes were combined with another set of attributes characterizing the substituent at α position resulting in total set of 4720 combinatorial attributes.
Figure 1.

Selection of typical chemical attributes attributed to the atomic groups of the molecule pyruvate. In total, this molecule is characterized by 38 attributes.
Definition of the reaction vector
In our concept, a chemical reaction is characterized by the changes of the chemical attributes of the involved reactants. An example is given in Fig. 2. During the transamination of cysteine the oxygen atom of a water molecule is included as a keto group into the reaction product β-mercaptopyruvate. A new water molecule is formed subsequently, with the oxygen originating from the keto group of oxaloacetate. Note that the attribute changes associated with the use and formation of the water molecule are different and require knowledge of the atom-to-atom transitions during the reaction. There are 24 different attribute changes outlined in the colored boxes for the atoms defining the reaction center of this reaction.
Figure 2.

Representative set of attribute changes associated with the transamination of cysteine to 2-oxo-glutarate. The attribute changes (+, gained; −, lost) listed in the five colored boxes refer to the five atoms marked by colored circles. The dashed circles mark atoms that experience changes of at least one attribute. The small numbers indicate identical atoms in the substrate and product molecules. In total, this reaction is accompanied by 61 attribute changes.
For the 1615 different biochemical reactions examined in total, we registered 1274 different types of attribute changes, each of them annotated by a single bit of the 1274-dimensional binary reaction vector. The value 1 and 0 of bit i (i = 1,…,1274) indicates whether the attribute change type i occurred in that reaction or not. For the example shown in Fig. 2, 24 bits of the reaction vector are different from zero.
Quantification of reaction similarities
The similarity of two reactions is measured by the concordance of their binary reaction vectors. As only a small number of components of the 1274-dimensional reaction vector are different from zero (24 for the example in Fig. 2), we used the Tanimoto coefficient (26)
| (1) |
to calculate the concordance of two reaction vectors. This measure has the advantage that the zero-bits are not taken into account. Na and Nb denote the number of 1-bits in the bit vectors a and b and Nab is the number of 1-bits common to both vectors. Thus, T is 1 for two identical vectors, and 0 for two completely dissimilar ones. An example for the calculation of T is given in Fig. 3.
Figure 3.

Example showing the calculation of the Tanimoto coefficient. The boxes below the reaction formula depict only three attribute changes for each reaction. Given that these were the only attribute changes we would get Na = 3, Nb = 3, Nab = 2, T = 0.5. Actually, there are Na = 38 attribute changes in reaction a and Nb = 36 attribute changes in reaction b of which Nab = 28 are identical so that T = 0.61.
The reaction vector of a chemical reaction depends on the assumed directionality. Reversing the direction means to reverse all attributes changes, e.g., the attribute change C_methyl + 1 occurring in the forward reaction converts into C_methyl − 1 of the backward reaction and these two attribute changes are coded at different positions of the reaction vector. Thus, comparing the forward reactions a,b and backward direction a′, b′ there exist two generally different Tanimoto coefficients T(a,b) = T(a′,b′) and T(a,b′) = T(a′,b), the larger of which is taken as similarity measure.
Development of a computer program for the calculation of reaction similarities
We developed a computer program that annotates predefined chemical attributes (see above) to the atomic groups of metabolites with known 2D structure given in the .mol format (to generate structures from SMILES strings (27) see http://cactus.nci.nih.gov/translate). The annotation procedure is implemented as a recursive subgraph matching algorithm, using a library of chemical group patterns. The software can be further used to generate for each reaction a binary reaction vector and to calculate the pairwise concordance of reaction vectors in terms of Tanimoto coefficients. The software runs on both Windows and Linux systems and is available on request.
Results
Inferring ΔG0 estimates from the chemically most similar reaction
To check the predictive capacity of our method (IGERS) we applied it to the reference set of 173 chemical reactions for which experimental ΔG0 values are available as gold standard for comparison. For each reaction, we used as a theoretical estimate of its ΔG0 value, the experimental ΔG0 value of that reaction among the 172 possible ones exhibiting the highest chemical similarity, i.e., the largest value of the Tanimoto coefficient T. In the following this estimate is denoted by ΔG0 (IGERS). The accuracy of these estimates was evaluated by the root mean-square of differences (RMSD) to the respective experimental values. This analysis was carried out by taking into account only those ΔG0 (IGERS) estimates that could be inferred from a reaction exhibiting a chemical similarity larger than a prescribed threshold value Tc. The higher this similarity threshold Tc was chosen, the less reaction pairs could be found meeting the condition T ≥ Tc but the higher was the concordance between ΔG0 (IGERS) estimates and the experimental values.
Fig. 4 illustrates that RMSD values (Fig. 4, red circles) at different values of the similarity threshold Tc varied between 0 and 1. With increasing similarity threshold Tc, the RSMD values decline monotonically about one order of magnitude from initially 41.3 kJ/mol to 1.6 kJ/mol. This tendency shows the validity of the basic assumption underlying our approach according to which increasing chemical similarity of two reactions should be reflected by increasing closeness of the respective ΔG0 values. Thus, the accuracy of the ΔG0 (IGERS) estimates can be increased by raising the similarity threshold Tc. The price for this gain in accuracy is the decline of the number of reactions for which a sufficiently similar partner reaction can be found meeting the condition T ≥ Tc (Fig. 4, blue triangles).
Figure 4.

RMSD between predicted and experimentally determined ΔG0 values at varying values of the similarity threshold Tc. Circles indicate RMSD values obtained by our method (IGERS). Squares indicate RMSD values obtained by the group contribution method (GCM). Triangles (secondary scale on the right vertical axis) indicate the number of reactions (out of a total of 174) for which our method allows to infer a ΔG0 value, i.e., for which a reaction with a similarity of T ≥ Tc is available in the data set. The box-plots (light gray) illustrate the results of the bootstrap resampling procedure (explained in the main text). The horizontal black line within the box indicates the bootstrap mean RMSD value, the upper and lower edge of the boxes indicate 75% and 25% of the bootstrap distribution of RMSD values and the vertical bars indicate the total span (maximum and minimum) of RMSD values.
For the sake of comparison we also calculated RMSD values for ΔG0 (GCM) estimates obtained by the most advanced version of the group contribution method (13). In agreement with findings in (13) the ΔG0 (GCM) estimates amount uniformly to ∼10 kJ/mol independently from the subset of reactions constrained by the condition T ≥ Tc.
Notably, significant improvement of the quality of the ΔG0 (IGERS) estimates occurs in the range 0.5 < Tc < 0.6. Above Tc = 0.6 the ΔG0 estimates predicted by our method are associated with significantly smaller RMSD values as those predicted by the GCM. Intriguingly, the RMSD associated with the ΔG0 estimates of the GCM shows a slight drop at Tc > 0.9, indicating the existence of a subset of reactions for which highly accurate ΔG0 values can be predicted by both theoretical methods.
To check how the quality of ΔG0 (IGERS) estimates may vary depending on the available set of chemical reactions with known ΔG0 values, we carried out a bootstrap analysis. At given value of Tc ΔG0 (IGERS) estimates were computed 100 times on a randomly chosen subset of reactions comprising 75% of all reactions. The result of this bootstrap resampling procedure is illustrated by the box-plot in Fig. 4. For Tc < 0.6 the mean RMSD values are higher than those for the complete set of chemicals. Moreover, the standard deviations (expressed as 25% and 75%) as well as the minimal and maximal deviations from the mean RMSD are unacceptably large. However, for Tc > 0.6 these statistical measures markedly improve and practically coincide with those of the full set of chemicals. This indicates that under the condition Tc > 0.6 the accuracy of the ΔG0 (IGERS) estimate does not depend on the specific type of chemical reaction (that varied randomly in the bootstrap analysis) from which it is inferred.
Inspecting individual ΔG0 (IGERS) estimates inferred under the constraint T ≥ Tc = 0.6 showed still larger deviations than 10 kJ/mol from the experimental values in some cases. A prominent example of such a discrepancy is the pair of reactions Acetyl-CoA + H2O ⇔ Acetate + CoA and Acetyl-CoA + AMP + PPi ⇔ Acetate + CoA + ATP exhibiting a similarity of T = 0.63. In the first reaction, AcetylCoA is hydrolyzed by water, a reaction that is associated with a large negative value of ΔG0. In the second reaction, the energy-rich thioester bond of AcetylCoA is exploited to generate an energy-rich anhydride bond between the phosphates of PPi and AMP, a reaction that is close to equilibrium. Therefore, the Gibbs energy difference between these reactions amounts to 51.2 kJ/mol. This example illustrates the limitations of the used similarity measure: attribute changes of the reactant Acetyl-CoA are identical for both reactions and have a larger impact on the similarity score than the differences in the attribute changes of the other reactants.
Setting the similarity threshold Tc
As shown in Fig. 4, the accuracy of ΔG0 (IGERS) estimates evaluated in terms of the RMSD improves with increasing similarity threshold Tc. The choice of this threshold is dictated by the demanded accuracy of ΔG0 (IGERS) estimates. If, for example, the accuracy of ΔG0 (IGERS) estimates have to be high enough to decide on the permitted directionality of bimolecular reactions of the type A + B ⇔ C + D where the equilibrium constant K = CD/AB may vary by 4 orders of magnitude between 0.01 and 100, the deviation of ΔG0 (IGERS) estimates from the true value should be not larger than RT ln(100) ≈ 12 kJ/mol. Presetting the demanded accuracy of ΔG0 (IGERS) estimates, the required similarity threshold Tc can be determined by bootstrap resampling. As an example, we determined the similarity threshold such that the RMSD values for the ΔG0 (IGERS) estimates start to become smaller than those for the ΔG0 (CGM) estimates. To this end, bootstrapping was carried out 1000 times on randomly chosen subsets of reactions comprising 75% of the 173 reactions of the full reference set. The threshold Tc was increased in steps of 0.01 until the RMSD of the IGERS prediction was lower than the RMSD for the GCM. We determined an average bootstrap value of Tc = 0.58. For 111 reactions out of 173 a partner reaction with a chemical similarity of T ≥ Tc = 0.58 can be found. The bootstrap RMSD for the ΔG0 (IGERS) estimates of these 111 reactions is 9.94 kJ/mol (see first row of Table 2).
Table 2.
Quality of ΔG0 (IGERS) estimates based on five different sets of chemical attributes
| Descriptor sets | Attributes (n) | Tc∗ | RMSD† | Reactions‡ (n) |
|---|---|---|---|---|
| Without redundancy filtering | ||||
| All descriptors | 1274 | 0.58 | 9.94 | 111 |
| No α groups | 650 | 0.65 | 10.09 | 116 |
| No charges | 1222 | 0.58 | 9.94 | 111 |
| No α group and charges | 491 | 0.63 | 9.76 | 112 |
| No α group, charges, and hybridization | 347 | 0.66 | 10.03 | 113 |
| With additional redundancy filtering§ | ||||
| All attributes | 536 | 0.59 | 9.74 | 104 |
| No α groups | 351 | 0.66 | 10.10 | 115 |
| No charges | 514 | 0.59 | 9.92 | 106 |
| No α groups and charges | 284 | 0.66 | 9.84 | 104 |
| No α groups, charges, and hybridization | 220 | 0.67 | 9.91 | 108 |
Refers to the threshold value of the Tanimoto coefficient defining the minimum similarity of chemical reactions that has to be demanded to drop the average deviations.
ΔG0 (IGERS) estimates from the experimental values below those associated with ΔG0 (GCM) estimates obtained by the group contribution method.
Number of reactions (out of 173) for which ΔG0 (IGERS) estimates could be derived from a partner reaction having a similarity of T ≥ Tc.
Results obtained by further reducing the five different sets of chemical attributes by redundancy filtering, i.e., by replacing groups of consistently co-occurring attribute changes by a single attribute change.
Testing reduced sets of chemical attributes
We tested the robustness of our method against the choice of chemical attributes used for the definition of the reaction vector. The full set of 1274 chemical attributes was reduced by leaving out descriptors containing certain groups of chemical attributes indicated in the first row of Table 2. The smallest set of attributes tested comprised only 347 attributes and was derived from the initial set by leaving out all attributes indicating the charge, the substituent in α position and the hybridization state of atomic groups. We applied the same bootstrap procedure as outlined above to calculate the threshold value Tc that assures the ΔG0 (IGERS) estimates to yield smaller deviations from the experimental values compared to the ΔG0 (GCM) estimates obtained by the GCM. As shown in the upper part of Table 2, the values of Tc and the share of reactions meeting the condition T ≥ Tc marginally varied for the reduced sets of chemical attributes. This finding points to considerable redundancy in the complete set of attributes. We reduced the dimension of the reaction vector further by removing redundant attribute changes. In a procedure that we call redundancy filtering, we identified within the training set of 1546 reactions attribute changes that occurred together whenever appearing in a reaction. Such groups of redundant attribute changes where replaced by a single attribute change. The lower part of Table 2 shows the impact of redundancy filtering on the four variants of reduced attribute sets considered before. Remarkably, even the strongest reduction of the size of the attribute set from initially 1274 to 220 increased the similarity threshold only slightly.
These findings show that considerably smaller sets of chemical attributes are still sufficient to quantify the similarity of biochemical reactions. Very likely, a systematic search for most informative chemical attributes would allow to even further reduce the size of the attribute set. However, for the purpose of inferring ΔG0 values from reaction similarity there is no obvious reason to reduce the set of attributes from neither the technical and chemical point of view. The assignment of even very large numbers of attributes to atomic groups can be carried out in an automatic fashion and the lowest Tc value was obtained with the full set of attributes.
Coverage of metabolic networks with ΔG0 (IGERS) estimates
Demanding a minimum similarity of Tc > = 0.6 and using the reference set of 173 reactions with known ΔG0 values our method allows to infer ΔG0 values with an uncertainty of <10 kJ/mol for an additional set of 458 reactions of the BioPath database. However, to infer for all reactions of the BioPath database a ΔG0 (IGERS) estimate it requires ΔG0 measurements for at least 590 additional reactions (Fig. 5). This minimal set of additional reactions is given in Table 2 of the Supporting Material.
Figure 5.
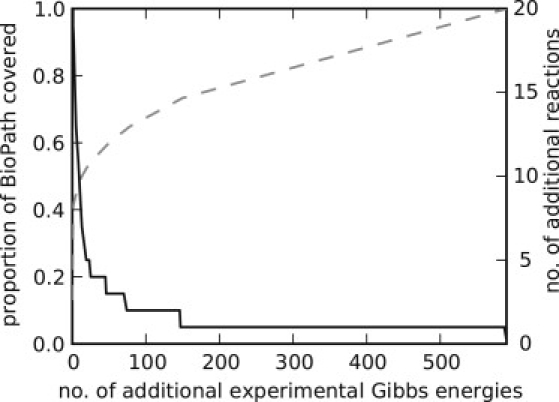
Minimal additional number of reactions for which ΔG0 values have to be determined to achieve together with ΔG0 (IGERS) estimates at Tc = 0.6 a percentage coverage (indicated on the vertical axis (dotted line)) of the complete BioPath database (1546 reactions) with known ΔG0 values. The solid line indicates the maximal number of reactions for which ΔG0 (IGERS) estimates at Tc = 0.6 can be inferred per experimental ΔG0 value of a single (optimally chosen) reaction. Table S2 contains the complete list of the optimal reactions.
Discussion
In this work, we describe what we believe to be a novel computational method for inferring unknown ΔG0 values from the experimentally determined ΔG0 values of chemically similar reactions. Based on a representative set of 173 biochemical reactions with experimentally determined ΔG0 values, we believe we have shown the existence of a clear-cut correlation between chemical similarity and thermodynamic similarity of biochemical reactions.
Choice of chemical attributes
Similarity measures for the comparison of chemical compounds should be chosen depending on application-specific expert knowledge (28). Accordingly, different sets of chemical attributes are being used in the virtual screening of organic libraries of chemical compounds. They have in common that the chemical attributes of a molecule are put into a vector representing a sort of chemical fingerprint. Examples are the MACCS-keys and DAYLIGHT (29,30) fingerprints that are both used frequently to assess the similarity of molecules. In the quantitative analysis of structure-activity relations, additional emphasis is placed on global physico-chemical properties such as solubility, ionization constant or the logP value (31). As the aim of our method is to make predictions of ΔG0 values for biochemical reactions occurring in the living cell we found only a small fraction of chemical attributes used in computationally chemistry to be suitable for a subtle characterization of the differences between the reactants occurring on both sides of the reaction. Therefore, we created an own set of chemical attributes that specifically takes into account changes in the chemical properties of those atomic groups typically forming the reaction center of biochemical reactions. The compilation of the attribute set was carried out manually as an alternative to tailoring the recently published Chemical Descriptors Library (32) according to our purposes.
From the large number of 1274 chemical attributes used in our analysis it can be expected that many of them are redundant. For example, converting a primary alcohol into an aldehyde the chemical attribute C_primary_alcohol and the more general attribute C_hydroxyl will disappear simultaneously. The usage of a hierarchy of chemical attributes allows to characterize the chemical properties of a metabolite at different levels of detail. Moreover, it implies an implicit weighting scheme as changes of atomic groups annotated by several different attributes have a high weight in assessing the similarity of reactions. The analysis of ΔG0 values predicted on the basis of several reduced attribute sets revealed that no improvement of the predictive capacity of our method could be achieved. We thus recommend that further studies should be based on the full set of chemical attributes. Using a large number of partially redundant attributes enables a reasonably good classification of even exotic reactants comprising rarely found atomic groups. This situation is fundamentally different from the overfitting problem typically occurring in regression analysis if the number of adjustable parameters exceeds the number of independent observations.
Characterization of chemical reactions by reaction vectors
Our method is fundamentally different to conventional similarity analyses in computational chemistry in that it aims at the assessment of the similarity of chemical reactions instead of the similarity of chemical compounds. In our approach, chemical reactions are characterized on the basis of attribute changes, i.e., appearance and disappearance of chemical attributes annotated to the reaction's reactants. An alternative method to define reaction similarities on the basis of a bond classification scheme has been recently proposed by (33) and compared to the EC number classification scheme. Our definition of the reaction vector does not include information about the spatial position within the molecular structure of the reactants where the attribute changes occur, e.g., esterifying glycerol with a fatty acid appears merely as attribute change C-ester + 1 irrespective of whether the fatty acid is linked to the hydroxyl group at C1 or C3 of the glycerol moiety. Due to the high diversity of the chemical environment of atomic groups constituting the reactants of the biochemical reactions of the training set, however, not a single case was detected where the reaction vectors of two reactions were identical although the attribute changes occurred at different spatial locations.
It is conceivable that additional weighting of attribute changes in the reaction vector could provide similarity measures that improve the prediction quality of ΔG0 estimates. We deliberately avoided choosing this option because of the risk of running into classical overfitting when attempting to determine weighting factors for the 1274 attribute changes forming the reaction vector. Maybe the method of random forests (34) or Bayesian methods like MrBayes (35) could help to overcome the overfitting problem.
Accuracy of ΔG0 predictions—determining the similarity threshold
In our approach, we replace the unknown ΔG0 value of a reaction by the known ΔG0 value of the chemically most similar partner reaction. Other replacement schemes are conceivable that include known ΔG0 values of more than one chemically neighbored reaction. In any case, the quality of the ΔG0 estimates inferred from similarity of chemical reactions depends strongly on the degree of similarity (see Fig. 4). The bootstrap analysis across the set of 173 chemicals with known ΔG0 values showed that a minimum chemical similarity of T ≥ 0.6 has to be demanded to predict ΔG0 values with higher accuracy than currently achievable by means of the GCM. For T ≥ 0.6, the average distance between observed and predicted ΔG0 values falls below 10 kJ/mol.
Evaluation and application of what we believe to be a novel theoretical method generally requires accurate experimental data that can be used as a gold standard. Whereas for a well-defined reaction assay the experimental determination of ΔG0 can be very accurate (e.g., deviations of ≤1.2 kJ/mol in Byrnes et al. (36), Goldberg et al. (37), and Tewari et al. (38)), the absolute value of ΔG0 may considerably vary depending on the specific chemical composition of the assay (ionic strength, presence of magnesium, phosphate and other small ions, pH). Thus, prediction of reliable ΔG0 values by means of our method implies the availability of experimental ΔG0 values generated under comparable assay conditions. This was the reason for developing and testing the method on a set of 173 reactions whose ΔG0 values were calibrated carefully to defined medium conditions. It has to be emphasized, however, that the availability of a homogenous set of experimental ΔG0 values measured at comparable assay conditions does not limit the applicability of our method as powerful computational methods for the transformation of thermodynamic properties to defined assay conditions are available (21).
Comparison of our method with the GCM
To our knowledge, our novel method and the GCM both rely on the assumption that the Gibbs energy of a molecule can be approximated by the sum of formation energies of its constituting atomic groups. Accordingly, the Gibbs energy change of a reaction is determined by the differences of formation energies of the participating reactants. The GCM aims at the prediction of absolute ΔG0 values and thus requires numerical estimates of the formation energies. Numerical estimates of the formation energies are determined by regression analysis by fitting linear combinations of formation energies to a set of known ΔG0 values. As a general rule, in regression analysis the number of parameters has to be significantly smaller than the number of observations. This constraint limits the number of diverse atomic groups that can be included in the GCM and may give rise to considerable estimation errors for the formation energies of rarely occurring atomic groups.
To improve the accuracy of the GCM-based ΔG0 estimates it has been proposed to subdivide additive contributions to the Gibbs energy into first-order groups and second order effects (39). To allow for a better discrimination among isomers, Marrero-Morejón and Pardillo-Fontdevila (40) invented a concept that builds the Gibbs energy on contributions of interactions between bonding groups instead of contributions of isolated groups. Despite such refinements of the GCM, the most recent and advanced version of GCM is afflicted with a cross-validations standard error 2.22 kcal/mol (=9.29 kJ/mol) that is equivalent to an uncertainty factor of 36.7 with respect to the equilibrium constant at body temperature (13). Maskow et al. (41) found the insufficient consideration of the activity coefficients and uncertainty of the tabulated equilibrium constants to be the most important reasons for the erroneous results of the GCM. It has been suggested, therefore, to calculate Gibbs energies values of formation from a unique reference state and then to account for the detailed composition of the solution including all ionic species (42).
To avoid problems related to the estimation of values for the formation energies, our IGERS method refrains from the estimation of absolute ΔG0 values. We only have to make the plausible assumption that chemically similar atomic groups possess similar formation energies. This implies similarity of the ΔG0 values of two reactions sharing similar atomic groups generated and annihilated in the course of the reaction. Compared to the GCM our concept has several advantages. First, it works without knowledge of values for the formation energies. Second, it allows to use a large number of chemical attributes thereby yielding a much more detailed description of atomic groups and their imbedding into the structure of the molecule. Third, including into the IGERS analysis reactions with reactants possessing atomic groups not defined before can be simply managed by adding further chemical attributes whereas the GCM is not capable of handling such reactions. For example, for 19% molecular species, 25% reactions, and 49% pathways contained in the University of Minnesota Biocatalysis/Biodegradation Database (17), the GCM method cannot be applied because of the appearance of atomic groups that were not present in the training set (43). Fourth, the accuracy of ΔG0 estimates can be enhanced by increasing the minimum similarity that the reaction has to possess from which the ΔG0 estimate is inferred.
The drawback of our method is that it does not allow to infer ΔG0 values directly from the chemical structure of the reactants but instead requires known ΔG0 values for a set of sufficiently similar reference reactions. Thus, the smaller the set of reference reactions with already known ΔG0 values and the higher the imposed similarity threshold Tc, the smaller the set of reactions for which our method may provide ΔG0 estimates. As shown in Fig. 4, a minimum similarity of Tc = 0.6 has to be demanded to assure a lower prediction error of ΔG0 (IGERS) estimates than of ΔG0 (GCM) estimates. However, under the constraint T ≥ 0.6 we can make predictions for only 106 reactions (=61%) of the full reference set. Thus, the availability of experimentally determined ΔG0 values is the most important factor limiting the number of reactions for which our method can predict reliable ΔG0 values.
As shown in Fig. 5, the number of additional reactions for which ΔG0 (IGERS) can be derived on adding the experimental ΔG0 value for one (properly chosen) reaction is steeply descending with increasing number of experimental ΔG0 values. Considering the considerable effort still required to determine experimental ΔG0 values so that for all reactions of a whole-cell metabolic network either experimental values or ΔG0 (IGERS) estimates are available, we conclude that a combined approach based on both GCM and IGERS seems to be optimal. Such an approach would include i), the use of already available experimental ΔG0 values taken from public databases (10) and transformed to standardized physiologically relevant milieu conditions (18); ii), the experimental determination of a manageable number of additional ΔG0 values permitting a reasonably high gain of ΔG0(IGERS) estimates; and iii), the calculation of ΔG0(GCM) estimates for the remaining fraction of reactions.
Further applications
First, the software that we developed to automatically assign chemical attributes to metabolites with known 2D structure could be easily incorporated into the browser of KEGG (24) and other databases of cellular reaction networks. Analyzing the distribution of chemical attributes across various parts of a reaction network could provide valuable insight into its evolutionary design (44). Second, under the premise that chemically similar reactions can be catalyzed by one and the same enzyme our concept of reaction similarity could help to identify auxiliary enzymes that are capable of catalyzing reactions that so far have been ascribed to other enzymes. Such enzymatic side activities could potentially explain why the knockout of seemingly essential enzymes nevertheless results in a vital phenotype (8).
Conclusions
The IGERS method proposed in this work provides a general concept to quantify the similarity of chemical reactions. It enables to infer ΔG0 values from chemically similar reactions with a lower error than the conventionally used group contribution method if the Tanimoto coefficient used as measure of reaction similarity has a value of T ≥ Tc = 0.6. The method can be used to define the minimal set of experimentally determined ΔG0 values required to achieve a use-defined coverage of a biochemical reaction network with reliable ΔG0 values.
Supporting Material
Two tables are available at http://www.biophysj.org/biophysj/supplemental/S0006-3495(10)00333-4.
Supporting Material
Acknowledgments
Before the publication of Jankowski et al. (13), we used an implementation of the group contribution method by courtesy of K. Hartmann. We thank O. Sacher, Molecular Networks Inc., for providing the Biopath2 database and A. Kümmel for supporting us in the provision of assay-corrected ΔG0 values for the 173 chemicals of the reference data set. We thank our colleagues A. Goede, S. Dunin-Horkawic, J. Saam, and J. M. Bujnicki for their support during the project.
This work was supported by a Deutscher Akademischer Austausch Dienst (D/09/42768 to K.R.) and the German System Biology Program “HepatoSys” (grant No. 0313078 to A.H. and S.B.).
References
- 1.Henry C.S., Broadbelt L.J., Hatzimanikatis V. Thermodynamics-based metabolic flux analysis. Biophys. J. 2007;92:1792–1805. doi: 10.1529/biophysj.106.093138. [DOI] [PMC free article] [PubMed] [Google Scholar]
- 2.Hoppe A., Hoffmann S., Holzhütter H.G. Including metabolite concentrations into flux balance analysis: thermodynamic realizability as a constraint on flux distributions in metabolic networks. BMC Syst. Biol. 2007;1:23. doi: 10.1186/1752-0509-1-23. [DOI] [PMC free article] [PubMed] [Google Scholar]
- 3.Kümmel A., Panke S., Heinemann M. Systematic assignment of thermodynamic constraints in metabolic network models. BMC Bioinformatics. 2006;7:512. doi: 10.1186/1471-2105-7-512. [DOI] [PMC free article] [PubMed] [Google Scholar]
- 4.Kümmel A., Panke S., Heinemann M. Putative regulatory sites unraveled by network-embedded thermodynamic analysis of metabolome data. Mol. Syst. Biol. 2006;2 doi: 10.1038/msb4100074. 2006.0034. [DOI] [PMC free article] [PubMed] [Google Scholar]
- 5.Jamshidi N., Palsson B.O. Formulating genome-scale kinetic models in the post-genome era. Mol. Syst. Biol. 2008;4:171. doi: 10.1038/msb.2008.8. [DOI] [PMC free article] [PubMed] [Google Scholar]
- 6.Schuster R., Holzhütter H.G. Use of mathematical models for predicting the metabolic effect of large-scale enzyme activity alterations. Application to enzyme deficiencies of red blood cells. Eur. J. Biochem. 1995;229:403–418. [PubMed] [Google Scholar]
- 7.Stelling J., Klamt S., Gilles E.D. Metabolic network structure determines key aspects of functionality and regulation. Nature. 2002;420:190–193. doi: 10.1038/nature01166. [DOI] [PubMed] [Google Scholar]
- 8.Feist A.M., Henry C.S., Palsson B.Ø. A genome-scale metabolic reconstruction for Escherichia coli K-12 MG1655 that accounts for 1260 ORFs and thermodynamic information. Mol. Syst. Biol. 2007;3:121. doi: 10.1038/msb4100155. [DOI] [PMC free article] [PubMed] [Google Scholar]
- 9.Herrgård M.J., Swainston N., Kell D.B. A consensus yeast metabolic network reconstruction obtained from a community approach to systems biology. Nat. Biotechnol. 2008;26:1155–1160. doi: 10.1038/nbt1492. [DOI] [PMC free article] [PubMed] [Google Scholar]
- 10.Standard Reference Database 74: thermodynamics of enzyme-catalyzed reactions. http://xpdb.nist.gov/enzyme_thermodynamics/. Last accessed: November 2008.
- 11.Mavrovouniotis M.L. Group contributions for estimating standard Gibbs energies of formation of biochemical compounds in aqueous solution. Biotechnol. Bioeng. 1990;36:1070–1082. doi: 10.1002/bit.260361013. [DOI] [PubMed] [Google Scholar]
- 12.Mavrovouniotis M.L. Estimation of standard Gibbs energy changes of biotransformations. J. Biol. Chem. 1991;266:14440–14445. [PubMed] [Google Scholar]
- 13.Jankowski M.D., Henry C.S., Hatzimanikatis V. Group contribution method for thermodynamic analysis of complex metabolic networks. Biophys. J. 2008;95:1487–1499. doi: 10.1529/biophysj.107.124784. [DOI] [PMC free article] [PubMed] [Google Scholar]
- 14.Allen D.K., Libourel I.G., Shachar-Hill Y. Metabolic flux analysis in plants: coping with complexity. Plant Cell Environ. 2009;32:1241–1257. doi: 10.1111/j.1365-3040.2009.01992.x. [DOI] [PubMed] [Google Scholar]
- 15.Henry C.S., Zinner J.F., Stevens R.L. iBsu1103: a new genome-scale metabolic model of Bacillus subtilis based on SEED annotations. Genome Biol. 2009;10:R69. doi: 10.1186/gb-2009-10-6-r69. [DOI] [PMC free article] [PubMed] [Google Scholar]
- 16.Morris D.M., Jensen G.J. Toward a biomechanical understanding of whole bacterial cells. Annu. Rev. Biochem. 2008;77:583–613. doi: 10.1146/annurev.biochem.77.061206.173846. [DOI] [PubMed] [Google Scholar]
- 17.Ellis L.B., Roe D., Wackett L.P. The University of Minnesota Biocatalysis/Biodegradation Database: the first decade. Nucleic Acids Res. 2006;34:D517–D521. doi: 10.1093/nar/gkj076. [DOI] [PMC free article] [PubMed] [Google Scholar]
- 18.Blum T., Kohlbacher O. Using atom mapping rules for an improved detection of relevant routes in weighted metabolic networks. J. Comput. Biol. 2008;15:565–576. doi: 10.1089/cmb.2008.0044. [DOI] [PubMed] [Google Scholar]
- 19.BioPath Database. http://www.molecular-networks.com/databases/biopath/. Last accessed: November 2008.
- 20.Reitz M., Sacher O., Gasteiger J. Enabling the exploration of biochemical pathways. Org. Biomol. Chem. 2004;2:3226–3237. doi: 10.1039/B410949J. [DOI] [PubMed] [Google Scholar]
- 21.Alberty R. Wiley and Sons; Hoboken, NJ: 2003. Thermodynamics of Biochemical Reactions. [Google Scholar]
- 22.Tewari Y.B., Hawkins A.R., Goldberg R.N. A thermodynamic study of the reactions: {2-dehydro-3-deoxy-D-arabino-heptanoate 7-phosphate(aq)=3-dehydroquinate(aq) plus phosphate(aq)} and {3-dehydroquinate(aq)=3-dehydroshikimate(aq) plus H2O(1)} J. Chem. Thermodyn. 2002;34:1671–1691. [Google Scholar]
- 23.Tewari Y.B., Kishore N., Goldberg R.N. Thermochemistry of the reaction {phosphoenolpyruvate(aq) plus D-erythrose 4-phosphate(aq) plus H2O(l)=2-dehydro-3-deoxy-D-arabino-heptonate 7-phosphate(aq) plus phosphate(aq)} J. Chem. Thermodyn. 2001;33:1791–1805. [Google Scholar]
- 24.Kanehisa M., Araki M., Yamanishi Y. KEGG for linking genomes to life and the environment. Nucleic Acids Res. 2008;36:D480–D484. doi: 10.1093/nar/gkm882. [DOI] [PMC free article] [PubMed] [Google Scholar]
- 25.Wang J., Wolf R.M., Case D.A. Development and testing of a general amber force field. J. Comput. Chem. 2004;25:1157–1174. doi: 10.1002/jcc.20035. [DOI] [PubMed] [Google Scholar]
- 26.Willett P. Similarity-based virtual screening using 2D fingerprints. Drug Discov. Today. 2006;11:1046–1053. doi: 10.1016/j.drudis.2006.10.005. [DOI] [PubMed] [Google Scholar]
- 27.Anderson, E., G. Veith, and D. Weininger. 1987. SMILES: a line notation and computerized interpreter for chemical structures. Technical Report EPA/600/M-687/021. United States Environmental Protection Agency, Environmental Research Laboratory-Duluth, Duluth, MN.
- 28.Nina N., Joanna J. Approaches to measure chemical similarity—a review. QSAR Comb. Sci. 2003;22:1006–1026. [Google Scholar]
- 29.Durant J.L., Leland B.A., Nourse J.G. Reoptimization of MDL keys for use in drug discovery. J. Chem. Inf. Comput. Sci. 2002;42:1273–1280. doi: 10.1021/ci010132r. [DOI] [PubMed] [Google Scholar]
- 30.Martin E.J., Blaney J.M., Moos W.H. Measuring diversity: experimental design of combinatorial libraries for drug discovery. J. Med. Chem. 1995;38:1431–1436. doi: 10.1021/jm00009a003. [DOI] [PubMed] [Google Scholar]
- 31.Bologa C., Allu T.K., Oprea T.I. Descriptor collision and confusion: toward the design of descriptors to mask chemical structures. J. Comput. Aided Mol. Des. 2005;19:625–635. doi: 10.1007/s10822-005-9020-4. [DOI] [PubMed] [Google Scholar]
- 32.Sykora V.J., Leahy D.E. Chemical Descriptors Library (CDL): a generic, open source software library for chemical informatics. J. Chem. Inf. Model. 2008;48:1931–1942. doi: 10.1021/ci800135h. [DOI] [PubMed] [Google Scholar]
- 33.Sacher O., Reitz M., Gasteiger J. Investigations of enzyme-catalyzed reactions based on physicochemical descriptors applied to hydrolases. J. Chem. Inf. Model. 2009;49:1525–1534. doi: 10.1021/ci800277f. [DOI] [PubMed] [Google Scholar]
- 34.Breiman L. Random forests. Mach. Learn. 2001;45:5–32. [Google Scholar]
- 35.Huelsenbeck J.P., Ronquist F., Bollback J.P. Bayesian inference of phylogeny and its impact on evolutionary biology. Science. 2001;294:2310–2314. doi: 10.1126/science.1065889. [DOI] [PubMed] [Google Scholar]
- 36.Byrnes W.M., Goldberg R.N., Tewari Y.B. Thermodynamics of reactions catalyzed by anthranilate synthase. Biophys. Chem. 2000;84:45–64. doi: 10.1016/s0301-4622(99)00145-3. [DOI] [PubMed] [Google Scholar]
- 37.Goldberg R.N., Tewari Y.B., Bhat T.N. Thermodynamics of enzyme-catalyzed reactions—a database for quantitative biochemistry. Bioinformatics. 2004;20:2874–2877. doi: 10.1093/bioinformatics/bth314. [DOI] [PubMed] [Google Scholar]
- 38.Tewari Y.B., Jensen P.Y., Goldberg R.N. Thermodynamics of reactions catalyzed by PABA synthase. Biophys. Chem. 2002;96:33–51. doi: 10.1016/s0301-4622(02)00034-0. [DOI] [PubMed] [Google Scholar]
- 39.Eladio P.-F., Ramàn G.l.-R. A group-interaction contribution approach. a new strategy for the estimation of physico-chemical properties of branched isomers. Chem. Eng. Commun. 1998;163:245–254. [Google Scholar]
- 40.Marrero-Morejon J., Pardillo-Fontdevila E. Estimation of pure compound properties using group-interaction contributions. AIChE J. 1999;45:615–621. [Google Scholar]
- 41.Maskow T., von Stockar U. How reliable are thermodynamic feasibility statements of biochemical pathways? Biotechnol. Bioeng. 2005;92:223–230. doi: 10.1002/bit.20572. [DOI] [PubMed] [Google Scholar]
- 42.Ould-Moulaye C.B., Dussap C.G., Gros J.B. Estimation of Gibbs energy changes of central metabolism reactions. Biotechnol. Tech. 1999;13:187–193. [Google Scholar]
- 43.Finley S.D., Broadbelt L.J., Hatzimanikatis V. Thermodynamic analysis of biodegradation pathways. Biotechnol. Bioeng. 2009;103:532–541. doi: 10.1002/bit.22285. [DOI] [PMC free article] [PubMed] [Google Scholar]
- 44.Raymond J., Segrè D. The effect of oxygen on biochemical networks and the evolution of complex life. Science. 2006;311:1764–1767. doi: 10.1126/science.1118439. [DOI] [PubMed] [Google Scholar]
Associated Data
This section collects any data citations, data availability statements, or supplementary materials included in this article.