

Abstract
The intrinsic heterogeneity of electrical action potential (AP) properties between Purkinje fibers (PFs) and the ventricular wall, as well as within the wall, plays an important role in ensuring successful excitation of the ventricles. It can also be proarrhythmic due to nonuniform repolarization across the Purkinje-ventricular junction. However, the ionic mechanisms that underlie the marked AP differences between PFs and ventricular cells are not fully characterized. We studied such mechanisms by developing a new family of biophysically detailed AP models for rabbit PF cells and three transmural ventricular cell types. The models were based on and validated against experimental data recorded from rabbit at ionic channel, single cell, and tissue levels. They were then used to determine the functional roles of each individual ionic channel current in modulating the AP heterogeneity at the rabbit Purkinje-ventricular junction, and to identify specific currents responsible for the differential response of PFs and ventricular cells to pharmacological interventions.
Introduction
The ventricular wall of the heart is a highly heterogeneous tissue composed of at least two electrophysiologically and pharmacologically distinct cell types: endocardial (Endo) and epicardial (Epi) myocytes. These cells form the inner and outer layers of the wall, respectively. A third type of cells in between them, termed the midmyocardial (M) cell, has been identified primarily in canine and human ventricles (1–4). There is some experimental evidence that the rabbit ventricular wall also contains M cells (5,6). These three ventricular cell types differ in morphology as well as in their electrical properties, with each generating a unique action potential (AP). The AP differences are believed to contribute to an increased susceptibility to cardiac arrhythmias, primarily due to nonuniform repolarization of the ventricles (2,7,8).
Purkinje fiber (PF) cells constitute a key component of the cardiac conduction system and are vital for rapid AP propagation into the ventricles, which ensures synchronized ventricular depolarization and contraction. The intrinsic heterogeneity of electrical properties at the Purkinje-ventricular junction (PVJ) plays an important role in ensuring successful unidirectional AP conduction into the ventricles (9–12). However, marked differences in the AP properties between the PF and ventricular cells (9,10) also add to electrical heterogeneity of the ventricles and can be proarrhythmic (11–14). Previous studies (13,15) showed that electrotonic modulation of AP differences across the PVJ may contribute to arrhythmogenesis. The results of these studies suggest that electrotonic interactions can alter AP heterogeneity across different PVJs to various degrees, leaving some junctions vulnerable to conduction of retrograde ectopic beats while others remain refractory. Such a combination of bidirectional AP conduction pathways and conduction block zones could provide a substrate for reentrant electrical activity in the heart, based purely on the AP heterogeneity at the PVJ (13). However, the ionic mechanisms that underlie such heterogeneity and its modulation by commonly used antiarrhythmic drugs are poorly understood.
In this study, our goal was to elucidate these mechanisms using detailed computer models. To that end, we developed a new family of biophysically detailed models for rabbit PF, Endo, M, and Epi cells based on and validated against existing experimental data. We then analyzed the functional roles of different ionic channel currents in determining the AP heterogeneity at the PVJ and within the ventricular wall, and identified the key currents responsible for the heterogeneities and their pharmacological modulation.
Materials and Methods
We used the standard equation for the electrical current balance at the cell membrane (16–18): , where V (mV) is the membrane potential, t (ms) is the time, Iion (pA) is the total membrane current, and Cm (pF) is the membrane capacitance. We developed detailed descriptions of Iion, and therefore single-cell AP models, for rabbit PF, Endo, M, and Epi cells. An existing model of the rabbit ventricular myocyte developed by Shannon et al. (17) was modified to incorporate experimentally recorded differences in the ionic channel properties across the PVJ and within the ventricular wall. The model of Shannon et al. was preferred over the earlier LabHEART model (18) because it provides a detailed formulation of intracellular Ca2+ dynamics. All major ionic currents were modified to account for electrophysiological differences (19–32) among the PF, Endo, M, and Epi cells.
Fast Na+ current, INa
In the PF cell model and all ventricular models, the formulation of INa was the same as in the Shannon et al. model (17). However, the current conductance, gNa, in the PF cell model was determined by matching the simulated AP upstroke velocity to experimental measurements. The the resultant gNa in the PF cell model was 2.5-fold greater than that in the original model (17).
Late Na+ current, INaL
INaL is significantly larger in PF cells than in ventricular cells, contributing to the longer AP plateau in PFs (16,19,20). We incorporated equations for INaL in both the PF and ventricular cell models, as done previously for the canine PF cell model (16). In the rabbit PF cell model, equations and parameters for the steady-state activation curve and the time constant of INaL were the same as for INa. However, the formulation of the steady-state inactivation curve, hL∞, and the time constant, τhL, were based on experimental data obtained in rabbits (21). The maximum conductance, gNaL, was determined by matching the simulated AP duration to the experimental data. In the ventricular cell models, the formulation of INaL was similar to that used in the PF cell model. However, the steady-state inactivation curve was shifted by −5 mV with respect to the PF cell model, as suggested by experimental data obtained in dogs (22); gNaL was obtained by fitting the simulated current density to experimental values from Endo, M, and Epi cells (20,23). The resultant current densities in the ventricular cell models were ∼10-fold smaller than that in the PF cell model. Experimentally validated characteristics of INa,L simulated using the PF and ventricular cell models are presented in Fig. 1.
Figure 1.
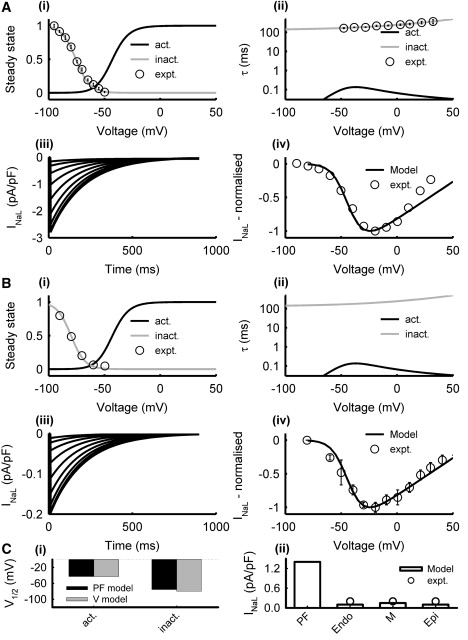
Model of INaL in PF (A) and ventricular (B) cells. Simulation results (lines) and respective experimental data (symbols) from PF (21) and ventricular (22) cells: (i) steady-state activation (black) and inactivation (gray) curves, (ii) activation and inactivation time constants, (iii) current traces generated during 1000 ms voltage-clamp pulses from the holding potential of −90 mV to 50 mV in steps of 10 mV, (iv) normalized I/V relationships. (C) Characteristics of the PF and ventricular cell models: (i) half activation and inactivation voltages, and (ii) simulated peak current densities as compared with experimental data (20). Here and below, V = ventricular cell.
L-type Ca2+ current, ICa,L
Due to the lack of experimental data from rabbits, the formulation of ICa,L in the rabbit PF cell model was the same as in the experimentally validated canine PF cell model (16). For the ventricular cell models, the steady-state activation and inactivation curves and the respective time constants in the formulation by Shannon et al. (17) were refitted to experimental data from rabbit left ventricular cells (25). The maximum conductance, gCa,L, was increased by 10% in M cells compared to Epi and Endo cells to account for differences in current density observed among the three cell types in experiments (26). Fig. 2 shows simulated ICa,L in the PF and ventricular cell models as compared with the experimental data.
Figure 2.
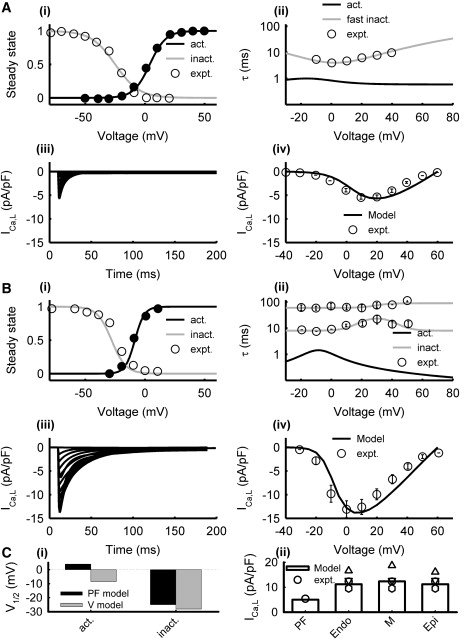
Model of ICa,L in PF (A) and ventricular (B) cells. Simulation results (lines) and experimental data (symbols) from PF (24) and ventricular (25) cells: (i) steady-state activation and inactivation curves, (ii) activation and inactivation time constants, (iii) current traces generated during 200 ms voltage-clamp pulses from the holding potential of −40 mV to 60 mV in steps of 10 mV, and (iv) I/V relationships. (C) Characteristics of the PF and ventricular cell models: (i) half activation and inactivation voltages, and (ii) simulated peak current densities as compared with experimental data (24–26,32).
T-type Ca2+ currents, ICa,T
Due to the lack of extant data from rabbits, the formulation of ICa,T in the rabbit PF cell model was based on a previous experimentally validated canine model (16). However, ICa,T was not included in the ventricular models because it is not evident in rabbit ventricular cells (17).
Transient outward K+ current, Ito
In the PF cell model, equations for Ito were formulated based on experimental data (9,24): 1), the steady-state inactivation curve, q∞, was fitted to measurements from rabbit PF cells (9); 2), inactivation time constants, τq1 and τq2, were introduced to fit experimental data from canine PF cells (24); and 3), the steady-state activation curve, r∞, and time constant, τx, were chosen to produce I/V curves similar to those recorded from rabbit (9). In the ventricular cell models, the current conductance, gto, in the formulation by Shannon et al. (17) was modified to account for experimentally reported transmural differences in the current density (27). Fig. 3 shows simulated Ito in the PF and ventricular cell models as compared with experimental data.
Figure 3.
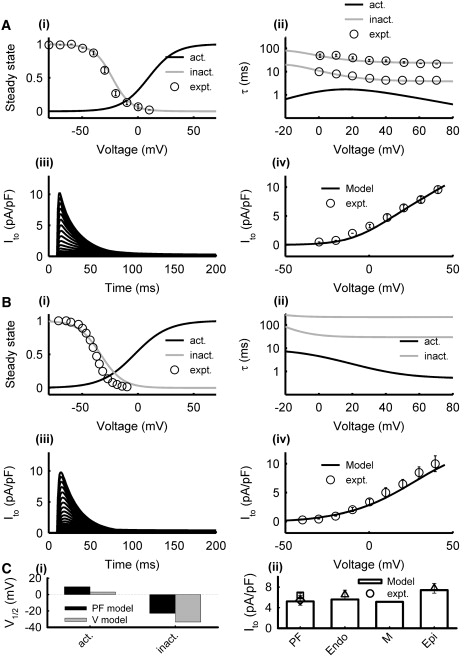
Model of Ito in PF (A) and ventricular (B) cells. Simulation results (lines) and experimental data (symbols) from PF (9,24) and ventricular (27) cells: (i) steady-state activation and inactivation curves, (ii) activation and inactivation time constants, (iii) current traces generated during 500 ms voltage-clamp pulses from the holding potential of −70 mV to 50 mV in steps of 5 mV, and (iv) I/V relationships. (C) Characteristics of the PF and ventricular cell models: (i) half activation and inactivation voltages, and (ii) simulated peak current densities as compared with experimental data (9,27,31).
Rapid delayed rectifier K+ current, IKr
In both the PF and ventricular cell models, the formulation of IKr by Shannon et al. (17) was modified to reproduce experimentally recorded voltage clamp current traces in rabbit PF (9) and ventricular (25,28–30) cells. Primarily, the steady-state activation curve, Xr∞, in the PF and ventricular cell models was shifted by +30 mV and +35 mV, respectively, to account for experimental measurements (9,28). The steady-state inactivation curve, R∞, was also refitted to experimental data (29). The maximum conductance, gKr, was the same in all ventricular cell models, as experiments indicate no transmural differences in IKr (25); gKr in the PF cell model was smaller (9). Fig. 4 shows simulated IKr in the resultant PF and ventricular cell models as compared with experimental data.
Figure 4.
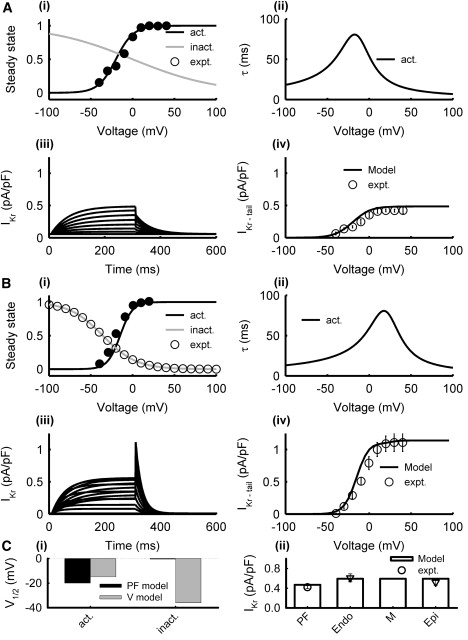
Model of IKr in PF (A) and ventricular (B) cells. Simulation results (lines) and experimental data (symbols) from PF (9) and ventricular (28,29) cells: (i) steady-state activation and inactivation curves, (ii) activation and inactivation time constants, (iii) current traces generated during 300 ms voltage-clamp pulses from the holding potential of −40 mV to 100 mV in steps of 5 mV, and (iv) I/V relationships. (C) Characteristics of the PF and ventricular cell models: (i) half activation and inactivation voltages, and (ii) simulated peak current densities as compared with experimental data (9,28). Note that the current density in PF and ventricular models was measured for tail and step currents, respectively, as in experiments.
Slow delayed rectifier K+ current, IKs
The formulation of IKs by Shannon et al. (17) (primarily the steady-state activation curve, X∞, and the activation time constant, τX) was modified based on extant data from rabbit PF (9) and ventricular (25) cells. The maximum conductance, gKs, was chosen to account for experimental differences in the current density among Endo, M, and Epi cells (30). The ratio of gKs from Endo/M/Epi was 0.67:0.47:1; gKs in the PF cell model was smaller. Fig. 5 shows simulated IKs in the PF and ventricular cell models as compared with experimental data.
Figure 5.
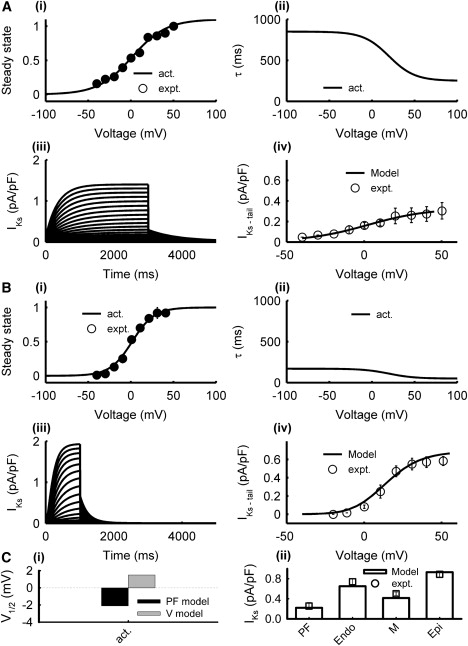
Model of IKs in PF (A) and ventricular (B) cells. Simulation results (lines) and experimental data (symbols) from PF (9) and ventricular (25) cells: (i) steady-state activation and inactivation curves, (ii) activation and inactivation time constants, (iii) current traces generated during 1000 ms voltage-clamp pulses from the holding potential of −50 mV to 50 mV in steps of 5 mV, and (iv) I/V relationships. (C) Characteristics of the PF and ventricular cell models: (i) half activation voltage, and (ii) simulated peak current densities as compared with experimental data (9,30).
Inward rectifying K+ current, IK1
The formulation of IK1 by Shannon et al. (17) was modified to account for differences between PF and ventricular cells (31,32). In the PF cell model, the activation gate rate constant, αK1, was increased 3.4-fold, the maximum conductance, gK1, was decreased 1.8-fold; and a small background component was added to the total current. In the ventricular cell models, the steady-state I/V curve for IK1 was shifted by +5 mV, and gK1 was determined by producing experimentally measured current density (32). Because there are no experimental data on the transmural differences in IK1, the conductance gK1 for the Endo, M, and Epi cell models was adjusted to account for the different resting potentials of these cell types, resulting in an Endo/M/Epi ratio of 0.833:0.777:1. Fig. 6 shows simulated properties of IK1 in the PF and ventricular cell models as compared with experimental data.
Figure 6.
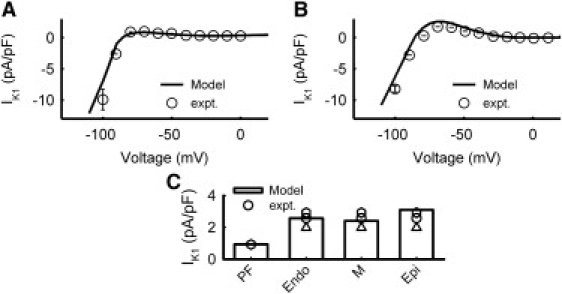
Model of IK1 in PF (A) and ventricular (B) cells. Simulation results (lines) and experimental data (symbols) from PF (31) and ventricular (32) cells. (C) Current densities in the PF and ventricular cell models at −80 mV as compared with experimentally data (25,31).
Na+-Ca2+ exchanger and Na+-K+ pump, INaCa and INaK
In the PF cell model, we used formulations of INaCa and INaK from the previous canine model (16). For the ventricular models, we kept the formulations of the original model (17).
Intracellular Ca2+ handling
All models incorporated intracellular Ca2+ dynamics based on the original formulation by Shannon et al. (17); however, the models were simplified by assuming that all currents entered the membrane through the sarcolemmal compartment, except for ICa,L, which flowed through the junctional cleft membrane. In the PF cell models, Ca2+ handling was modified by scaling the SR pump, leak, and release fluxes by factors of 2.0, 0.5, 2.0, respectively. As a result, the models generated Ca2+ transients similar to those seen in rabbit PF (33) and ventricular (5) cells.
The complete list of equations for the resultant PF and ventricular cell models can be found in the Supporting Material; the respective codes in C are also available on request.
Results
The models were validated by their ability to simulate APs for the respective cell types with all major characteristics—the AP duration (APD), maximum diastolic potential (MDP), AP amplitude (APA), and maximum upstroke velocity (dV/dtmax)—matching experimental data. Note that such characteristics are very different between PF and ventricular cells (9,10,19): APs in PF cells have significantly larger APD and dV/dtmax, as well as a much lower plateau. Figs. 7 and 8 compare the simulated and experimentally measured AP characteristics. Fig. 7 compares the APs simulated by all four cell models with the respective experimental data (5,9,28), and shows the ionic currents and Ca2+ transients elicited during the AP. A comparison of the AP (Fig. 8 A) and restitution (Fig. 8 B) properties of the models with experimental data from various sources in the literature (see Table S1) demonstrates a very good agreement between the models and experiments. Note that both the PF and ventricular cell models can reproduce APD alternans at rapid stimulation rates (Fig. 8 B), as observed in rabbit ventricular myocytes (34).
Figure 7.
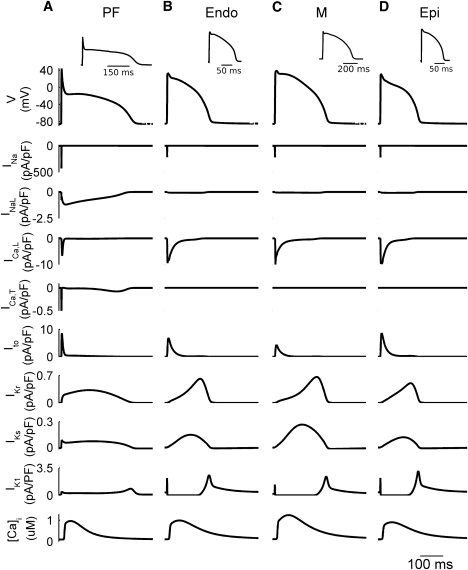
Differences in the dynamics of APs and ionic currents between the rabbit PF and ventricular cell models. Simulated AP morphologies, ionic current traces, and Ca2+ transients in the PF (A), Endo (B), M (C), and Epi (D) cells. Insets illustrate the respective experimental AP recordings from rabbit (5,9,28). BCL = 500 ms.
Figure 8.
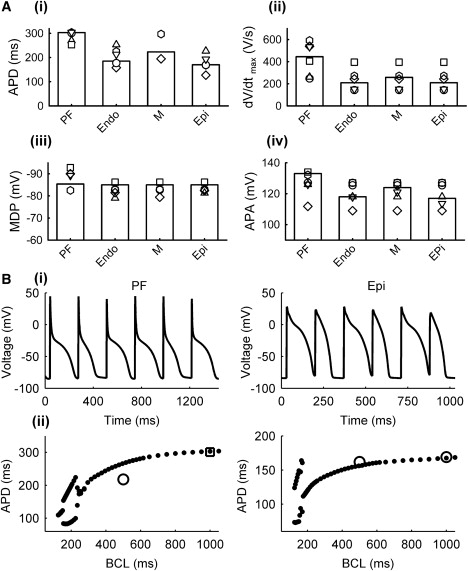
AP characteristics in the rabbit PF and ventricular cell models. (A) Simulation results (bars) and experimental data from rabbit (symbols): (i) APD, (ii) dV/dtmax, (iii) MDP, and (iv) APA. See Table S1 for the sources of experiment data. (B) APD alternans (top) and restitution curves (bottom) simulated using the PF (left) and Epi (right) cell models; simulated restitution curves (solid circles) are compared with experimental data (open symbols) from rabbit (6,20).
Ionic current blocking
The models can be used to study the functional role of major ionic currents (INaL, ICa,L, Ito, IKs, IKr, and IK1) by means of their selective blocking (amplitude reduction). Fig. S1, Fig. S2, Fig. S3, Fig. S4, Fig. S5, and Fig. S6 show the effects of 50% and 100% blocking of each current on the APD at various basic cycle lengths (BCLs). The effects of blocking the inward currents, INaL and ICa,L, were the most prominent. Blocking ICa,L significantly reduced the APD in the ventricular cell models (by ∼30% during 50% block at BCL = 1000 ms), but not in the PF model (Fig. S1). Blocking INaL significantly reduced the APD (by ∼30% during 50% block at BCL = 1000 ms) and altered the AP morphology in the PF model, but not in ventricular models (Fig. S2). These results agree with experimental data (19,20,35). Because under normal conditions the APD in PF cells is much longer than in ventricular cells (∼300 and 190 ms at BCL = 1000 ms, respectively), blocking INaL significantly reduced the AP heterogeneity at the PVJ by bringing the APD in the PF and ventricular cells closer to each other (∼200 and 185 ms during 50% block at BCL = 1000 ms); however, blocking ICa,L increased heterogeneity in the APD (∼290 and 125 ms, respectively).
The effects of blocking outward K+ currents on the APD were generally smaller. Blocking Ito altered AP morphologies (primarily the AP plateau; see below) in the PF and ventricular cells, but did not significantly affect the APD (<10% change during 50% block at BCL = 1000 ms in all models; Fig. S3). Blocking IKr or IKs uniformly increased the APD in all models (by ∼20% and 5%, respectively), preserving about the same level of heterogeneity at the PVJ as in control (Fig. S4, Fig. S5, and Fig. S7). The results are also in agreement with experimental data (28,36,37). Among all K+ currents, only blocking IK1 had a relatively strong effect on the APD and increased the AP heterogeneity at the PVJ (Fig. S6). The simulations suggest that the AP differences at the PVJ can be easily exacerbated by inward current blockers, but not by conventional outward current blockers, such as class III antiarrhythmic drugs.
Data on the specific AP changes that occur during pharmacological interventions are especially important in the case of modulators with multiple actions on the inward and outward currents, such as α1-adrenergic agonists (38). Therefore, we simulated the effects of α1-adrenergic stimulation on PF and ventricular cells (Fig. S8). The current densities of several ionic currents/pumps were modified to simulate the α1-adrenergic effects: ICa,T was increased by ∼60% (39), Ito was decreased by 30% (40), IKs was increased by 30% (41), INaK was increased by 50% (42) in both PF and ventricular cells, and IK1 was decreased by 50% in PF (42) and by 30% in ventricular (43) cells. As a result, the APs in PF and ventricular cells responded differentially (Fig. S8). There was no significant APD change in either Endo or Epi cells, the APD in the M-cell slightly decreased, and the APD in the PF cell substantially increased, all in agreement with experimental data from dogs (38). Note that experimental α1-adrenergic stimulation of rabbit ventricular myocytes in a previous study (43) showed little effect on the APD, as in our simulations of Epi and Endo cell models; however, that study did not consider differences among the various cell types. Note also that individual changes to ICa,T, Ito, IKs, IK1, or INaK did not result in opposite AP responses between the PF and ventricular models; changing each of the currents either increased or decreased the APD in all cell types. However, our simulations showed that individual changes of either IK1 alone or INaK alone had the most marked effects on the APD (increase due to IK1 downregulation, or decrease due to INaK upregulation), and the differential response of PF, Endo, M, and Epi cells to α1-adrenergic stimulation was attributable to different balances between these two currents in the various cell types.
The ionic mechanisms underlying the differential responses of PF and ventricular cells to blockage of various currents can be explained by differences in the ionic channel properties among the cells. Thus, the significant effects of blocking INaL, ICa,L, or IK1 on the AP heterogeneity at the PVJ can be explained by the large differences in the current densities between the PF and ventricular cells (Figs. 1 C, 2 C, and 6 C, respectively). Differences in the current densities of Ito, IKr, and IKs are relatively small (Figs. 3 C, 4 C, and 5 C), which explains the weak modulation of the APD differences at the PVJ with their reduction. However, even for the latter currents, kinetic differences among the various cell types can also be important (Fig. 7). Thus, even though the current densities of IKr in the PF and ventricular cells are similar (Fig. 4), a substantial difference in the inactivation kinetics of IKr between these cells results in a smaller current during the AP in PF cells (Fig. 9 A). Similarly, differences in the kinetics of Ito between the PF and ventricular cells (Fig. 3) can result in differential changes in the AP morphologies (Fig. 9 B) upon blockage of Ito. The block generates substantial elevation of the AP plateau to more positive potentials in the PF cell but not the ventricular cell model, in agreement with experimental data (9,44). The importance of differences in the kinetics of ionic currents between the PF and ventricular cells is considered in more detail below.
Figure 9.
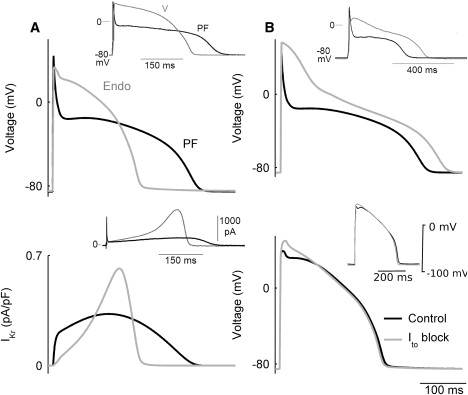
Differences in ionic current dynamics between the PF and ventricular cells. (A) Dynamics of IKr (bottom) during APs (top) simulated with the PF (black) and ventricular (gray) cell models; insets show respective experimental data (9). (B) Simulated AP dynamics of the PF (top) and ventricular (bottom) cell models in control and with 100% block of the transient and sustained outward currents, Ito and ICl(Ca); insets show experimental recordings in which 4-AP was used to block Ito in the presence of EGTA, a selective ICl(Ca) blocker (9,44).
Ionic current kinetics
The models were also used to study the functional role of different ionic channel kinetics in determining the heterogeneous AP properties across the PVJ. Several ionic currents were substituted from the PF model into the Endo model, to identify the currents that exert the largest effect on the AP morphology and make it more similar to that of the PF cell. Fig. 10 A shows the effects of substituting either a formulation of ICa,L alone, or combinations of ICa,L + INaL, ICa,L + INaL + IK1, or ICa,L + INaL + IK1 + Ito, from the PF cell model into the Endo model. Substitution of ICa,L resulted in a significant decrease in the APD and the plateau potential, additional substitution of INaL substantially increased the APD, additional substitution of IK1 further increased the APD and decreased the plateau, and additional substitution of Ito adjusted the APD and the AP plateau such that they matched those of the PF cell (Fig. 10 A). Notably, scaling only the respective current densities in the Endo cell model to match the current densities of the PF model resulted in AP changes that were only qualitatively similar to those described above; however, the quantitative impact of such scaling was not as prominent as when both current densities and kinetics were substituted (Fig. 10 B). Hence, differences in the ionic current densities between PF and ventricular cells alone cannot account for the AP heterogeneity at the PVJ; differences in the kinetics are also important.
Figure 10.
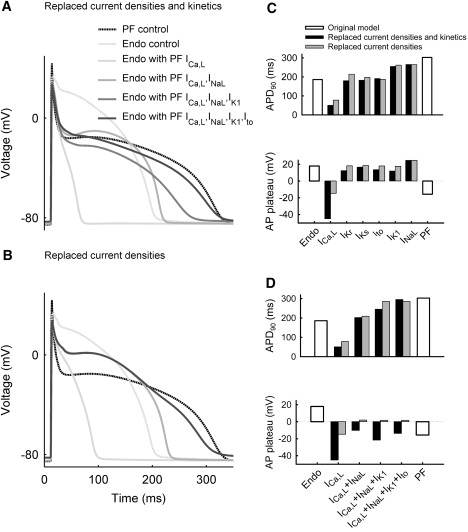
Differences in ionic current dynamics responsible for the AP heterogeneity between PF and ventricular (Endo) cells. (A) Effects of substituting current densities and kinetics of ICa,L, INaL, IK1, and Ito from the PF into the Endo model. (B) Effects of substituting current densities only. (C) Comparison of changes in the APD (top) and plateau potential (bottom) due to individual changes (INaL, ICa,L, IKr, IKs, Ito, or IK1) in either current densities and kinetics (black bars) or current densities only (gray bars) in the Endo cell model as compared with the PF cell model (open bars). (D) Comparison of changes in the APD and plateau potential due to combined changes (various combinations of ICa,L, INaL, IK1, and Ito) in either current densities and kinetics or current densities only in the Endo cell model as compared with the PF model.
The simulations described above suggest that INaL, ICa,L, IK1, and Ito are the major currents responsible for the AP differences between PF and ventricular cells; the effects of other currents are much smaller. Fig. 10 C shows changes in two AP characteristics—the APD and the plateau potential—that resulted from replacing either the current densities or the full formulations of individual ionic currents in the Endo model with those of the PF model. When substituted individually, INaL and IK1 were responsible for the largest APD shifts from the value characteristic of the Endo model toward that of the PF model; ICa,L made the largest impact on shifting the plateau potential toward that of the PF model. Fig. 10 D shows changes in the APD and the plateau potential for combinations of INaL, ICa,L, IK1, and Ito substituted into the Endo model. Even after INaL, ICa,L, and IK1 were substituted, neither of the AP characteristics matched those of the PF model. Only after the full kinetic formulation of Ito was also substituted did both AP characteristics match those of the PF model (Fig. 10, A and D). Thus, although some currents (such as Ito) may not have a strong effect on the AP when considered individually, their impact in combination with other currents is significantly greater due to the dynamic changes they undergo during the AP.
Discussion
In this work, we developed biophysically detailed models for the rabbit PF cell and three ventricular transmural cell types. Major ionic currents, as well as Ca2+ handling parameters, in a rabbit ventricular myocyte model (17) were updated to account for heterogeneous experimental data from respective cell types (19–32). The resultant models reproduced APs and Ca2+ transients in the PF and ventricular cells that are in agreement with experimental recordings (5,9,28,33). The models were used to determine ionic mechanisms underlying the AP heterogeneity between the four cell types. The major ionic currents responsible for high heterogeneity across the PVJ were identified. Below, we discuss the major achievements, as well as the limitations, of our work and compare them with results reported in other studies.
Single-cell models
Our cell models are based on the model of Shannon et al. (17), which provides a more detailed description of a rabbit ventricular myocyte than the earlier LabHEART model (18). The LabHEART model was based on the Luo-Rudy ventricular cell model (44), which was developed with the use of hybrid data sets obtained from different species (mainly guinea pig) and cell types. Some of these data sets were also employed for rabbit ventricular AP models (17,18); for example, the parameters of one of the major currents responsible for morphologies of the AP and Ca2+ transient, ICa,L, were based on data from bull-frog atrial cells (45). In addition, none of these models (17,18) considered the heterogeneity of the ventricular wall. It should be noted that although a recent modification of the LabHEART model (46) accounted for transmural differences in ionic current densities, it inherited the limitations of the original model (18) and produced AP morphologies with features characteristic of guinea-pig (rather than rabbit) myocytes. Similar limitations also apply to another modification of the model by Shannon et al., in which the kinetics of ICaL and Ca2+ handling were updated (34), primarily to reproduce APD and Ca2+ alternans in rabbit ventricular myocytes at rapid heart rates.
In our modifications of the model developed by Shannon et al. (17), we aimed primarily to 1), use newly available ionic current data from rabbits; and 2), incorporate details of the ionic and AP differences among PF, Endo, M, and Epi cells. Hence, their model (17) was modified based on extant data for the kinetics and current densities of several major ionic currents that determine the AP properties in the various cell types. Briefly, the Na+ current, INaL, was introduced (Fig. 1) to account for substantial differences in the APD (19–23); L-type and T-type Ca2+ currents, ICa,L and ICa,T, were reformulated (Fig. 2) based on experimental data from rabbit (25) and dog (16,24); and all outward K+ currents (Ito, IK1, IKr, and IKs) were updated to account for differences in kinetics and current densities among the four cell types (Figs. 3–6) observed in experiments on isolated rabbit myocytes (9,25,27–32). Note that under physiological conditions, rabbit PFs do not exhibit pacemaking (15,31), presumably due to low levels of hyperpolarization-activated cation channel expression. The total expression of hyperpolarization-activated cation channel isoforms in PFs is <4% of that expressed in the sinus node (47), which produces only a negligible hyperpolarization-activated pacemaking current, If. Hence, If was not introduced into the PF model.
The modifications resulted in all four models generating APs with characteristics (e.g., APD, MDP, APA, and dV/dtmax) in agreement with experimental data from rabbit (Figs. 7 and 8). Thus, the PF model produced APs with a significantly longer APD, larger upstroke velocity, and lower plateau than any of the ventricular models (9,10). Of importance, the models also reproduced the AP restitution properties, including APD alternans at rapid rates, similar to those observed in experiments (see Fig. 8). Thus, we have developed a new family of single-cell AP models that are based on extensive experimental data from rabbit, and have provided the first electrophysiologically detailed in silico description of the ventricular transmural heterogeneity (including the PF network) in this species.
Ionic heterogeneity
Within each cardiac cell type, the AP morphology is determined by a delicate interplay among a variety of inward and outward currents that flow through distinct ionic channels, pumps, and transporters. The activity of each of these components can in turn be modulated by drugs, hormones, and neural stimulation, or modified by disease. Our study generates new and detailed information on all the types of heterogeneity that exist within the rabbit ventricle at the ionic and functional levels. For example, we show that M cells differ from Epi and Endo cells with respect to ionic currents: M cells display smaller IKs but a more prominent INaL, and Ito is also smaller in M cells than in Epi and Endo cells, but not significantly. Differences between PF cells and any of three ventricular cells are larger than the transmural differences. High INaL values constitute the major difference (Fig. 1) accounting for the remarkably longer APD in PF cells (9,19,43). ICa,L is much smaller in PF cells (Fig. 2), which is responsible for a much lower AP plateau than in ventricular cells. A smaller IK1 in PF cells (Fig. 6) contributes to the longer APD in this cell type; however, smaller IKr and IKs values in PF cells (Figs. 4 and 5) do not result in significant AP differences in comparison with ventricular cell types (Fig. 10). Of interest, Ito, which has comparable current densities in the PF and ventricular cells (Fig. 3), contributes to AP heterogeneity (Figs. 9 and 10) via significantly different kinetics in these two regions.
Although the ionic nature of the remarkable distinction between the AP properties in PF and ventricular cells has not been well understood (1,9,48), it is generally accepted that a significant consequence of the prominent electrophysiological differences among the four functionally distinct cell types (PF, Endo, M, and Epi) is that they show different (and in some cases, opposite) responses to a variety of pharmacological agents (1,7–10,19,20,48–51). Hence, data on specific ionic currents affected by pharmacological stimuli (see Fig. S1, Fig. S2, Fig. S3, Fig. S4, Fig. S5, Fig. S6, Fig. S7, and Fig. S8) can provide crucial insights that will enhance our understanding of the specific mechanisms involved in these responses. This is especially important in the case of modulators with multiple actions on the inward and outward currents, such as quinidine (10,51) or α1-adrenergic agonists (38,43). Our simulations identified specific currents, a balance between which is responsible for differential response of PF, Endo, M, and Epi cells to the latter (Fig. S8). Thus, our models can be used both to identify the ionic mechanisms responsible for AP heterogeneity at the PVJ and to predict the patterns of its modulation by pharmacological agents.
Limitations
The limitations of cardiac cell and tissue models are well documented (16–18,45). During the development of our cell model, we modified the equations for all major ionic channel currents (INa, INaL, ICa,L, ICa,T, Ito, IKr, IKs, and IK1) in the ventricular myocyte model (17) based on available experimental data (19–32). However, for pump and exchanger currents, as well as intracellular Ca2+ handling, because of the lack of experimental data on differences between the PF and ventricular cells, we either used formulations from the original ventricular model (17) or introduced empirical changes to account for differences in Ca2+ transients. Such changes should be validated in the future subject to the availability of experimental data.
Supporting Material
Four tables and eight figures are available at http://www.biophysj.org/biophysj/supplemental/S0006-3495(10)00309-7.
Supporting Material
Acknowledgments
This work was supported by a project grant (BBS/B/1678X) from the Biotechnology and Biological Sciences Research Council of the United Kingdom.
References
- 1.Antzelevitch C., Fish J. Electrical heterogeneity within the ventricular wall. Basic Res. Cardiol. 2001;96:517–527. doi: 10.1007/s003950170002. [DOI] [PubMed] [Google Scholar]
- 2.Antzelevitch C. Role of spatial dispersion of repolarization in inherited and acquired sudden cardiac death syndromes. Am. J. Physiol. 2007;293:H2024–H2038. doi: 10.1152/ajpheart.00355.2007. [DOI] [PMC free article] [PubMed] [Google Scholar]
- 3.Drouin E., Charpentier F., Le Marec H. Electrophysiologic characteristics of cells spanning the left ventricular wall of human heart: evidence for presence of M cells. J. Am. Coll. Cardiol. 1995;26:185–192. doi: 10.1016/0735-1097(95)00167-x. [DOI] [PubMed] [Google Scholar]
- 4.Näbauer M., Beuckelmann D.J., Steinbeck G. Regional differences in current density and rate-dependent properties of the transient outward current in subepicardial and subendocardial myocytes of human left ventricle. Circulation. 1996;93:168–177. doi: 10.1161/01.cir.93.1.168. [DOI] [PubMed] [Google Scholar]
- 5.McIntosh M.A., Cobbe S.M., Smith G.L. Heterogeneous changes in action potential and intracellular Ca2+ in left ventricular myocyte sub-types from rabbits with heart failure. Cardiovasc. Res. 2000;45:397–409. doi: 10.1016/s0008-6363(99)00360-0. [DOI] [PubMed] [Google Scholar]
- 6.Idriss S.F., Wolf P.D. Transmural action potential repolarization heterogeneity develops postnatally in the rabbit. J. Cardiovasc. Electrophysiol. 2004;15:795–801. doi: 10.1046/j.1540-8167.2004.03622.x. [DOI] [PubMed] [Google Scholar]
- 7.Antzelevitch C., Yan G.-X., Shimizu W. Transmural dispersion of repolarization and arrhythmogenicity: the Brugada syndrome versus the long QT syndrome. J. Electrocardiol. 1999;32(Suppl):158–165. doi: 10.1016/s0022-0736(99)90074-2. [DOI] [PubMed] [Google Scholar]
- 8.Akar F.G., Yan G.-X., Rosenbaum D.S. Unique topographical distribution of M cells underlies reentrant mechanism of torsade de pointes in the long-QT syndrome. Circulation. 2002;105:1247–1253. doi: 10.1161/hc1002.105231. [DOI] [PubMed] [Google Scholar]
- 9.Dumaine R., Cordeiro J.M. Comparison of K+ currents in cardiac Purkinje cells isolated from rabbit and dog. J. Mol. Cell. Cardiol. 2007;42:378–389. doi: 10.1016/j.yjmcc.2006.10.019. [DOI] [PubMed] [Google Scholar]
- 10.Veenstra R.D., Joyner R.W., Rawling D.A. Purkinje and ventricular activation sequences of canine papillary muscle. Effects of quinidine and calcium on the Purkinje-ventricular conduction delay. Circ. Res. 1984;54:500–515. doi: 10.1161/01.res.54.5.500. [DOI] [PubMed] [Google Scholar]
- 11.Overholt E.D., Joyner R.W., Wiedmann R. Unidirectional block between Purkinje and ventricular layers of papillary muscles. Am. J. Physiol. 1984;247:H584–H595. doi: 10.1152/ajpheart.1984.247.4.H584. [DOI] [PubMed] [Google Scholar]
- 12.Li Z.Y., Wang Y.H., Kupersmith J. Role of junctional zone cells between Purkinje fibres and ventricular muscle in arrhythmogenesis. Cardiovasc. Res. 1994;28:1277–1284. doi: 10.1093/cvr/28.8.1277. [DOI] [PubMed] [Google Scholar]
- 13.Gilmour R.F., Watanabe M. Dynamics of circus movement re-entry across canine Purkinje fibre-muscle junctions. J. Physiol. 1994;476:473–485. doi: 10.1113/jphysiol.1994.sp020148. [DOI] [PMC free article] [PubMed] [Google Scholar]
- 14.Morley G.E., Danik S.B., Fishman G.I. Reduced intercellular coupling leads to paradoxical propagation across the Purkinje-ventricular junction and aberrant myocardial activation. Proc. Natl. Acad. Sci. USA. 2005;102:4126–4129. doi: 10.1073/pnas.0500881102. [DOI] [PMC free article] [PubMed] [Google Scholar]
- 15.Huelsing D.J., Spitzer K.W., Pollard A.E. Modulation of repolarization in rabbit Purkinje and ventricular myocytes coupled by a variable resistance. Am. J. Physiol. 1999;276:H572–H581. doi: 10.1152/ajpheart.1999.276.2.H572. [DOI] [PubMed] [Google Scholar]
- 16.Aslanidi O.V., Stewart P., Zhang H. Optimal velocity and safety of discontinuous conduction through the heterogeneous Purkinje-ventricular junction. Biophys. J. 2009;97:20–39. doi: 10.1016/j.bpj.2009.03.061. [DOI] [PMC free article] [PubMed] [Google Scholar]
- 17.Shannon T.R., Wang F., Bers D.M. A mathematical treatment of integrated Ca dynamics within the ventricular myocyte. Biophys. J. 2004;87:3351–3371. doi: 10.1529/biophysj.104.047449. [DOI] [PMC free article] [PubMed] [Google Scholar]
- 18.Puglisi J.L., Bers D.M. LabHEART: an interactive computer model of rabbit ventricular myocyte ion channels and Ca transport. Am. J. Physiol. 2001;281:C2049–C2060. doi: 10.1152/ajpcell.2001.281.6.C2049. [DOI] [PubMed] [Google Scholar]
- 19.Coraboeuf E., Deroubaix E., Coulombe A. Effect of tetrodotoxin on action potentials of the conducting system in the dog heart. Am. J. Physiol. 1979;236:H561–H567. doi: 10.1152/ajpheart.1979.236.4.H561. [DOI] [PubMed] [Google Scholar]
- 20.Persson F., Andersson B., Carlsson L. Functional effects of the late sodium current inhibition by AZD7009 and lidocaine in rabbit isolated atrial and ventricular tissue and Purkinje fibre. Eur. J. Pharmacol. 2007;558:133–143. doi: 10.1016/j.ejphar.2006.11.040. [DOI] [PubMed] [Google Scholar]
- 21.Carmeliet E. Slow inactivation of the sodium current in rabbit cardiac Purkinje fibres. Pflugers Arch. 1987;408:18–26. doi: 10.1007/BF00581835. [DOI] [PubMed] [Google Scholar]
- 22.Maltsev V.A., Kyle J.W., Undrovinas A. Molecular identity of the late sodium current in adult dog cardiomyocytes identified by Nav1.5 antisense inhibition. Am. J. Physiol. 2008;295:H667–H676. doi: 10.1152/ajpheart.00111.2008. [DOI] [PMC free article] [PubMed] [Google Scholar]
- 23.Zygmunt A.C., Eddlestone G.T., Antzelevitch C. Larger late sodium conductance in M cells contributes to electrical heterogeneity in canine ventricle. Am. J. Physiol. 2001;281:H689–H697. doi: 10.1152/ajpheart.2001.281.2.H689. [DOI] [PubMed] [Google Scholar]
- 24.Han W., Chartier D., Nattel S. Ionic remodeling of cardiac Purkinje cells by congestive heart failure. Circulation. 2001;104:2095–2100. doi: 10.1161/hc4201.097134. [DOI] [PubMed] [Google Scholar]
- 25.Tsuji Y., Opthof T., Kodama I. Pacing-induced heart failure causes a reduction of delayed rectifier potassium currents along with decreases in calcium and transient outward currents in rabbit ventricle. Cardiovasc. Res. 2000;48:300–309. doi: 10.1016/s0008-6363(00)00180-2. [DOI] [PubMed] [Google Scholar]
- 26.Ma C.Z.J., Li Y. Transmural dispersion of action potential duration and heterogeneous changes in L-type calcium current in rabbit heart three months after myocardial infarction. Drug Dev. Res. 2003;58:122–124. [Google Scholar]
- 27.Fedida D., Giles W.R. Regional variations in action potentials and transient outward current in myocytes isolated from rabbit left ventricle. J. Physiol. 1991;442:191–209. doi: 10.1113/jphysiol.1991.sp018789. [DOI] [PMC free article] [PubMed] [Google Scholar]
- 28.Xu X., Rials S.J., Kowey P.R. Left ventricular hypertrophy decreases slowly but not rapidly activating delayed rectifier potassium currents of epicardial and endocardial myocytes in rabbits. Circulation. 2001;103:1585–1590. doi: 10.1161/01.cir.103.11.1585. [DOI] [PubMed] [Google Scholar]
- 29.Paquette T., Clay J.R., Shrier A. Effects of divalent cations on the E-4031-sensitive repolarization current, I(Kr), in rabbit ventricular myocytes. Biophys. J. 1998;74:1278–1285. doi: 10.1016/S0006-3495(98)77841-5. [DOI] [PMC free article] [PubMed] [Google Scholar]
- 30.Li Y., Lu Z.Y., Ruan Y.F. Effect of imidapril on heterogeneity of slow component of delayed rectifying K+ current in rabbit left ventricular hypertrophic myocytes. Acta Pharmacol. Sin. 2003;24:681–686. [PubMed] [Google Scholar]
- 31.Cordeiro J.M., Spitzer K.W., Giles W.R. Repolarizing K+ currents in rabbit heart Purkinje cells. J. Physiol. 1998;508:811–823. doi: 10.1111/j.1469-7793.1998.811bp.x. [DOI] [PMC free article] [PubMed] [Google Scholar]
- 32.Rozanski G.J., Xu Z., Zucker I.H. Electrophysiology of rabbit ventricular myocytes following sustained rapid ventricular pacing. J. Mol. Cell. Cardiol. 1997;29:721–732. doi: 10.1006/jmcc.1996.0314. [DOI] [PubMed] [Google Scholar]
- 33.Cordeiro J.M., Bridge J.H.B., Spitzer K.W. Early and delayed afterdepolarizations in rabbit heart Purkinje cells viewed by confocal microscopy. Cell Calcium. 2001;29:289–297. doi: 10.1054/ceca.2000.0192. [DOI] [PubMed] [Google Scholar]
- 34.Mahajan A., Shiferaw Y., Weiss J.N. A rabbit ventricular action potential model replicating cardiac dynamics at rapid heart rates. Biophys. J. 2008;94:392–410. doi: 10.1529/biophysj.106.98160. [DOI] [PMC free article] [PubMed] [Google Scholar]
- 35.Zhang S., Sawanobori T., Hiraoka M. Multiple modulations of action potential duration by different calcium channel blocking agents in guinea pig ventricular myocytes. J. Cardiovasc. Pharmacol. 1997;30:489–496. doi: 10.1097/00005344-199710000-00013. [DOI] [PubMed] [Google Scholar]
- 36.Cheng J., Kamiya K., Kodama I. Heterogeneous distribution of the two components of delayed rectifier K+ current: a potential mechanism of the proarrhythmic effects of methanesulfonanilide class III agents. Cardiovasc. Res. 1999;43:135–147. doi: 10.1016/s0008-6363(99)00061-9. [DOI] [PubMed] [Google Scholar]
- 37.Lu H.R., Vlaminckx E., De Clerck F. Drug-induced long QT in isolated rabbit Purkinje fibers: importance of action potential duration, triangulation and early afterdepolarizations. Eur. J. Pharmacol. 2002;452:183–192. doi: 10.1016/s0014-2999(02)02246-x. [DOI] [PubMed] [Google Scholar]
- 38.Burashnikov A., Antzelevitch C. Differences in the electrophysiologic response of four canine ventricular cell types to α1-adrenergic agonists. Cardiovasc. Res. 1999;43:901–908. doi: 10.1016/s0008-6363(99)00124-8. [DOI] [PubMed] [Google Scholar]
- 39.Tseng G.N., Boyden P.A. Multiple types of Ca2+ currents in single canine Purkinje cells. Circ. Res. 1989;65:1735–1750. doi: 10.1161/01.res.65.6.1735. [DOI] [PubMed] [Google Scholar]
- 40.Apkon M., Nerbonne J.M. α1-Adrenergic agonists selectively suppress voltage-dependent K+ current in rat ventricular myocytes. Proc. Natl. Acad. Sci. USA. 1988;85:8756–8760. doi: 10.1073/pnas.85.22.8756. [DOI] [PMC free article] [PubMed] [Google Scholar]
- 41.Tohse N., Nakaya H., Kanno M. α1-Adrenoceptor stimulation enhances the delayed rectifier K+ current of guinea pig ventricular cells through the activation of protein kinase C. Circ. Res. 1992;71:1441–1446. doi: 10.1161/01.res.71.6.1441. [DOI] [PubMed] [Google Scholar]
- 42.Shah A., Cohen I.S., Rosen M.R. Stimulation of cardiac α receptors increases Na/K pump current and decreases gK via a pertussis toxin-sensitive pathway. Biophys. J. 1988;54:219–225. doi: 10.1016/S0006-3495(88)82950-3. [DOI] [PMC free article] [PubMed] [Google Scholar]
- 43.Fedida D., Braun A.P., Giles W.R. α1-Adrenoceptors in myocardium: functional aspects and transmembrane signaling mechanisms. Physiol. Rev. 1993;73:469–487. doi: 10.1152/physrev.1993.73.2.469. [DOI] [PubMed] [Google Scholar]
- 44.Hiraoka M., Kawano S. Calcium-sensitive and insensitive transient outward current in rabbit ventricular myocytes. J. Physiol. 1989;410:187–212. doi: 10.1113/jphysiol.1989.sp017528. [DOI] [PMC free article] [PubMed] [Google Scholar]
- 45.Luo C.H., Rudy Y. A dynamic model of the cardiac ventricular action potential. I. Simulations of ionic currents and concentration changes. Circ. Res. 1994;74:1071–1096. doi: 10.1161/01.res.74.6.1071. [DOI] [PubMed] [Google Scholar]
- 46.Michailova A., Lorentz W., McCulloch A. Modeling transmural heterogeneity of K(ATP) current in rabbit ventricular myocytes. Am. J. Physiol. 2007;293:C542–C557. doi: 10.1152/ajpcell.00148.2006. [DOI] [PubMed] [Google Scholar]
- 47.Shi W., Wymore R., Cohen I.S. Distribution and prevalence of hyperpolarization-activated cation channel (HCN) mRNA expression in cardiac tissues. Circ. Res. 1999;85:e1–e6. doi: 10.1161/01.res.85.1.e1. [DOI] [PubMed] [Google Scholar]
- 48.Baláti B., Varró A., Papp J.G. Comparison of the cellular electrophysiological characteristics of canine left ventricular epicardium, M cells, endocardium and Purkinje fibres. Acta Physiol. Scand. 1998;164:181–190. doi: 10.1046/j.1365-201X.1998.00416.x. [DOI] [PubMed] [Google Scholar]
- 49.Litovsky S.H., Antzelevitch C. Differences in the electrophysiological response of canine ventricular subendocardium and subepicardium to acetylcholine and isoproterenol. A direct effect of acetylcholine in ventricular myocardium. Circ. Res. 1990;67:615–627. doi: 10.1161/01.res.67.3.615. [DOI] [PubMed] [Google Scholar]
- 50.Sicouri S., Moro S., Antzelevitch C. Chronic amiodarone reduces transmural dispersion of repolarization in the canine heart. J. Cardiovasc. Electrophysiol. 1997;8:1269–1279. doi: 10.1111/j.1540-8167.1997.tb01018.x. [DOI] [PubMed] [Google Scholar]
- 51.Sosunov E.A., Anyukhovsky E.P., Rosen M.R. Effects of quinidine on repolarization in canine epicardium, midmyocardium, and endocardium: I. In vitro study. Circulation. 1997;96:4011–4018. doi: 10.1161/01.cir.96.11.4011. [DOI] [PubMed] [Google Scholar]
Associated Data
This section collects any data citations, data availability statements, or supplementary materials included in this article.