

Abstract
Contraction of Vorticella convallaria, a sessile ciliated protozoan, is completed within a few milliseconds and results in a retraction of its cell body toward the substratum by coiling its stalk. Previous studies have modeled the cell body as a sphere and assumed a drag force that satisfies Stokes' law. However, the contraction-induced flow of the medium is transient and bounded by the substrate, and the maximum Reynolds number is larger than unity. Thus, calculations of contractile force from the drag force are incomplete. In this study, we analyzed fluid flow during contraction by the particle tracking velocimetry and computational fluid dynamics simulations to estimate the contractile force. Particle paths show that the induced flow is limited by the substrate. Simulation-based force estimates suggest that the combined effect of the flow unsteadiness, the finite Reynolds number, and the substrate comprises 35% of the total force. The work done in the early stage of contraction and the maximum power output are similar regardless of the medium viscosity. These results suggest that, during the initial development of force, V. convallaria uses a common mechanism for performing mechanical work irrespective of viscous loading conditions.
Introduction
The sessile form of the ciliated peritrich, Vorticella convallaria, displays an unusual form of cell movement (1,2). A 100-μm-long stalk, which normally is extended and attaches its bell-shaped body or zooid to the underlying substratum (Fig. 1 A), shortens by 60∼80% within a few milliseconds. During shortening, the maximum contraction rate is on the order of cm/s (3). The contractile organelle within the stalk is the spasmoneme, a bundle of 2∼4 nm diameter filaments that follows a helical path subjacent to the cell wall or sheath (4). During contraction, the spasmoneme shortens, taking the shortest path through the stalk sheath. As a result, the stalk coils helically and retracts the zooid toward the substrate. A second unusual feature of the stalk contraction is that energy is derived from the binding of calcium ions and not from the hydrolysis of ATP, the usual cellular energy source. Previous studies show that permeabilized stalks shorten when the free calcium ion concentration is >10−6 M and extend when the calcium levels are decreased (5,6). Implicated in the contraction mechanism is the major calcium-binding protein, spasmin, a 20-kDa EF-hand calcium-binding protein localized to the spasmoneme (7). Although spasmin is a strong candidate to be the force-transducing protein in the spasmoneme because of its abundance and affinity to calcium ions, there is no direct experimental evidence that spasmin drives the contraction of V. convallaria. Thus, it is not known how calcium binding energy is converted into a contraction force.
Figure 1.
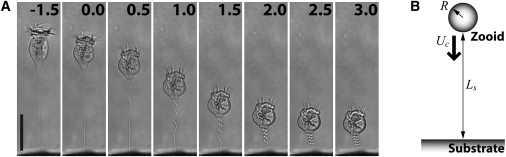
Ultrafast time series of contracting Vorticella convallaria. (A) Sequential images (millisecond timescale) of contraction in water. Contraction begins at the base of the zooid (0 ms) and propagates along the stalk toward the substratum. Scale bar = 50 μm (see Movie S1). (B) A simplified model of contracting V. convallaria. The sphere of radius R representing the shrunken zooid moves at the contraction velocity Uc perpendicularly toward the rigid plane representing the substrate. Ls is the stalk end-to-end length.
The contraction force of V. convallaria is one of the key parameters for the mechanics of the stalk contraction and is a physical bound for any contraction mechanism models. Experimentally, the contraction force of the spasmoneme in large protozoa such as Carchesium and Zoothamnium is easily measured with simple microdevices. A sensitive microneedle and spring-balance device measured that the normalized tension (tension/the cross-sectional area of the spasmoneme) developed during contraction of Carchesium was 4∼15 × 104 N/m2 (8,9). In the smaller Vorticella, the isometric normalized tension developed by a glycerinated stalk of V. convallaria was measured as 3.5∼5.1 × 10⁴ N/m2 with a microneedle (10). For live V. convallaria, the contraction force approaches a few hundreds of nanoNewtons (11). These stall forces are among the largest that are developed by a single cell.
While measurements of a stall force represent an upper bound on the contraction force, the lower bound is represented by the unloaded contraction force. This force is developed during normal contraction and can be estimated by equating the contraction force to the drag force on the zooid. If we assume the zooid is a rigid sphere moving in quiescent water with the negligible inertia of the zooid, the drag force is estimated with Stokes' law,
| (1) |
where Fd is the drag force that a surrounding fluid exerts on the zooid, μ is the fluid viscosity, R is the contracted zooid radius (15∼20 μm), and Uc is the stalk contraction rate (which is negative because the stalk shortens and equals the moving velocity of the zooid) (3,12). Equation 1 is valid for steady creeping flow of an infinite fluid past a spherical particle (13). Based on the Stokes' law assumption, we previously determined that the contraction of V. convallaria is power-limited because its maximum power output is constant regardless of increase in the medium viscosity (14).
However, water is induced to flow by contracting V. convallaria, and the flow does not satisfy key conditions for Stokes' law. Thus, the Stokes' law assumption leads to inaccurate estimates of the drag force. First, because contraction starts and stops, the flow of water around the zooid is unsteady. Unsteady movement of the zooid is characterized by the Stokes number (St), the ratio of the transient inertia force of the flow to the viscous shear force, defined as
| (2) |
where ρ is the fluid density and τu,max is the time to the maximum contraction speed (see Supporting Material). If St ≪ 1, the flow around the particle is regarded as steady because the transient inertia force is negligible. In the case of V. convallaria contracting in water, St is ∼1.3 (R ≈ 25 μm, τu,max ≈ 2 ms from Moriyama et al. (3)). The second condition not satisfied is that the induced flow is not a creeping flow. Viscous dominance of flow is characterized by the ratio of the convective inertia force of the flow to the viscous shear force, which is the Reynolds number (Re):
| (3) |
At Re ≪ 1, the flow is regarded as viscously dominated. However, the Remax of contracting V. convallaria is 4.4 (|Uc|max = 8.8 cm/s from Moriyama et al. (3)), and thus the convective inertia force of the induced flow becomes significant especially near τu,max. Lastly, during contraction, the zooid approaches the substrate. Thus, the induced flow is not unbounded. The flow exerts a drag force greater than that estimated by Stokes' law as the zooid approaches the substrate at the completion of contraction. Because the conditions for Stokes' law are not satisfied, estimates of the drag force are only accurate within an order of magnitude of the contractile force.
For a more accurate estimate of the drag force, we must consider the combined effects of the flow unsteadiness, the finite Reynolds number, and the substrate on the contraction force. Recently, the flow unsteadiness was taken into account based on the unsteady Stokes drag formula given as
| (4) |
where t is time (14). The first term on the right-hand side is the quasi-steady Stokes drag force based on the instantaneous velocity, and the second term is the added mass force that the sphere experiences due to accelerating the surrounding fluid. The last term is the history force related to the memory effect of the fluid (15). Although it was estimated that the history force accounted for, at most, 20% of the total force in the case of contraction in water (14), the effect of the finite Reynolds number and the substrate has never been considered. To correct for the wall effect, one can employ the Stokes drag formula with a wall-effect-correction factor. At low Reynolds numbers, the analytic solution for the drag force on an impermeable sphere slowly moving perpendicularly toward a rigid plane is
| (5a) |
| (5b) |
| (5c) |
where λ is the wall-effect-correction factor and H is the distance from the center of the sphere to the plane (16,17). In the case of V. convallaria, this distance is the sum of the contracted zooid radius and the stalk end-to-end length (H = R + Ls).
In this study, we apply analytical and experimental approaches for estimating the contributions of the flow unsteadiness, finite Reynolds numbers, and the presence of the substrate in calculating the contraction force of V. convallaria. First, we directly visualize the contraction-induced flow by the particle tracking velocimetry, a technique used to analyze the feeding current of V. convallaria by tracking particles seeded in the medium (18). Second, to calculate the contraction force, we model the flow by computational fluid dynamics (CFD) simulations. By solving the governing equations of the contraction-induced flow with appropriate boundary conditions, we systematically evaluate the contributions of non-Stokes conditions to the induced flow. In the case of water, we show that the simple Stokes drag underestimates the peak contraction force by ∼35% compared to the CFD-based estimate. Because the work done in the force-developing stage and the maximum power output are similar regardless of viscous loading conditions, we confirm that the stalk contraction of V. convallaria is power-limited. Finally, we discuss the energetics of contraction based on the CFD simulation results and relate it to the possible work done by calcium binding.
Materials and Methods
Cell culture and sample preparation
V. convallaria cells are cultured in 1 L flasks filled with 500 mL of wheat fusion solution (19). Sessile cells were induced to excise from their stalks by shaking the flasks at 100 rpm for 24 h. The suspension from two flasks was combined into a sterile flask and cells were allowed to reattach to the flask bottom for 10 h. Cells were recovered by changing the solution with 200 mL inorganic medium (2.4 × 10⁻⁴ M KCl, 2.4 × 10⁻⁵ M MgSO4, 4.8 × 10⁻⁵ M CaH4(PO4)2·H2O), and the flask was shaken for another 24 h. The cell suspension was filtered through 50-μm Nitex nylon mesh (Lab Pak; Sefar Filtration, Depew, NY) and the filter placed on the top of a petri dish touching the free surface of spring water (Poland Spring, Poland, MA). Cells reattached to No. 1 cover glass fragments on the bottom of the dish (20).
Polyvinylpyrrolidone solution characterization
Polyvinylpyrrolidone (PVP) solutions of 0, 1, 2, and 3 % (w/w) were prepared (MW 360,000; Sigma-Aldrich, St. Louis, MO) in spring water and the pH titrated to 6.5∼7.0 with KOH solution. The viscosity of the solutions was measured with a rheometer (ARG 2; TA Instrument, New Castle, DE) and a ϕ60 mm 2° cone plate at 20°C. The density of the solutions was measured with a density meter (DMA 38; Anton Paar, Ashland, VA) at 20°C. The measured properties of the PVP solutions are summarized in Table 1.
Table 1.
Properties of PVP solutions and key fluid dynamics parameters
| PVP % (w/w) | ρ (g/cm3) | μ (mPa·s) | |Uc|max (cm/s) | τu,max (ms) | τc (ms) | Remax (−) | St (−) |
|---|---|---|---|---|---|---|---|
| 0% | 1.000 | 1.00 | 5.78 | 0.96 | 3.9 | 1.90 | 1.12 |
| 1% | 1.001 | 2.74 | 3.52 | 0.90 | 7.9 | 0.42 | 0.44 |
| 2% | 1.003 | 6.93 | 2.39 | 1.03 | 13.6 | 0.11 | 0.15 |
| 3% | 1.005 | 10.31 | 1.77 | 1.04 | 20.3 | 0.06 | 0.10 |
The radius of the shrunken zooid was measured for each contraction, and its average value (R = 16.4 μm) was used for the above dimensionless number calculation and force estimations. |Uc|max and τu,max were obtained from Eq. 7, and τc was calculated from Eq. 6 so that (Ls(τc) − Ls,min)/(Ls,max − Ls,min) = 0.01.
Contraction speed measurement
The contraction rate of a single cell was measured in the prepared media. A glass fragment with attached V. convallaria was placed at the bottom of a microwell petri dish (glass bottom culture dish; MatTek, Ashland, MA) and imaged on an inverted light microscope (Eclipse TE300; Nikon Instruments, Melville, NY) through a 40× objective lens (NA 0.6) and with a mercury lamp light source. To characterize the ultrafast movement of V. convallaria at very high temporal and spatial resolution, images (512 × 512 pixels, 0.5 μm/pixel) were captured at 8000 fps with a high-speed camera (Phantom V7; Vision Research, Wayne, NJ), processed with ImageJ (National Institutes of Health, Bethesda, MD) and analyzed with MATLAB programs (The MathWorks, Natick, MA). The end-to-end length of the stalk was calculated from the coordinates of the both ends of the stalk (Table 2), and the contraction speed was calculated from stalk length data. For each solution, one representative case was chosen in which the entire stalk lies in the focal plane at right angle to the substrate.
Table 2.
The end-to-end length of the extended and contracted stalk and the coefficients of fitting curves
| PVP % | Ls,max (μm) | Ls,min (μm) | c1 (s) | c2 (−) | c3 (−) |
|---|---|---|---|---|---|
| 0% | 116.8 | 22.5 | 9.263 × 10⁻⁴ | 1.243 | 0.873 |
| 1% | 115.8 | 25.2 | 9.945 × 10⁻⁴ | 0.915 | 0.772 |
| 2% | 114.6 | 23.0 | 1.557 × 10⁻³ | 0.781 | 0.973 |
| 3% | 113.8 | 25.5 | 2.203 × 10⁻³ | 0.697 | 1.149 |
The R-square values are >0.999 in all cases. It is noticeable that c1, the characteristic timescale in Eq. 6, has similar values to τu,max chosen as the characteristic timescale for the stalk contraction.
Flow visualization
Because ciliary beat induces flow around the oral apparatus of the cell, we stopped cilia movement by starving the cells for days (V. Baru, Whitehead Institute for Biomedical Research, personal communication, 2006) or inhibiting dynein by treatment with 1% ammonium vanadate (NH4VO3; Fisher Scientific, Pittsburgh, PA) (21).
The contraction-induced flow was detected by tracking the movement of 1-μm-diameter polystyrene beads (1.05 g/cm3; Bang Laboratories, Fishers, IN) in the solution at 8123 fps. Raw images were preprocessed with ImageJ to make particles more distinguishable, and the particles were identified and tracked with the Particle Tracker plug-in of ImageJ (22). MATLAB was used to post-process data obtained from Particle Tracker.
Data fitting
To represent the measured stalk length with a single curve and the contraction velocity with its time-derivative form, we employed a hyperbolic secant function, which is similar in form to the fractional stalk length change,
| (6) |
where Ls,max and Ls,min are the end-to-end length of the extended and fully coiled stalk, respectively. The value t = 0 indicates a point when the stalk begins to coil. The corresponding velocity curve is
| (7) |
Values of the coefficients were extracted by fitting Eq. 6 against the experimentally measured stalk length data with the method of least-squares (Table 2). The fitted curves corresponded well with the experimentally measured time course of stalk length and contraction velocity (Fig. 2).
Figure 2.
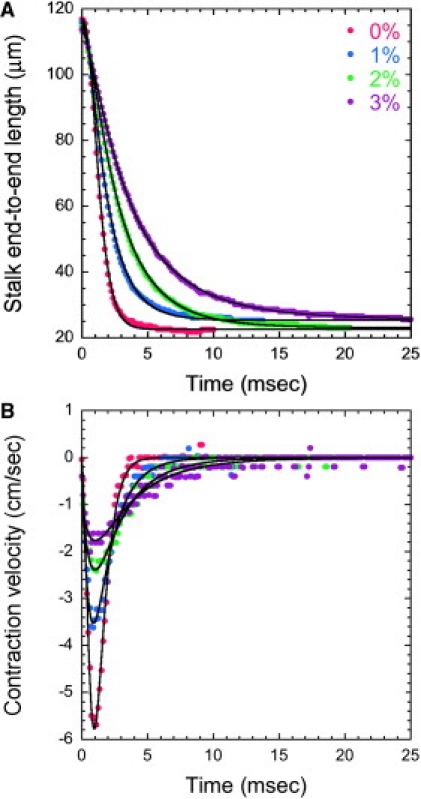
Fitting curves for contraction force estimation in 0, 1, 2, and 3% PVP solution. (A) The experimentally measured end-to-end length of the stalk (dots) and corresponding stalk length curves from Eq. 6 (black lines). (B) The derived instantaneous contraction velocity of the stalk (dots) and corresponding fitted contraction velocity curves from Eq. 7 (black lines).
CFD simulation
Governing equations for the induced flow are the Navier-Stokes equation and the continuity equation for incompressible flow. These equations were solved numerically based on the finite-element method with COMSOL Multiphysics and Script (COMSOL, Natick, MA). For the simulation, we assume that the moving zooid is a rigid sphere unsteadily moving perpendicularly toward a rigid plane (Fig. 1 B). In this model, the stalk is ignored for the simplicity of modeling. Although the coiling stalk has a complex geometry, the drag force difference due to the stalk is expected to be small because the cross-sectional area of the stalk is much smaller than that of the zooid. In addition, any other surfaces except the substrate are not considered because the substrate is closest to the zooid. This assumption leads to a two-dimensional, axis-symmetric mesh (Fig. 3). This mesh, which includes moving interior boundaries, consists of three subdomains. The middle subdomain including the sphere moves downward at V. convallaria's contraction velocity, and the other two subdomains expand or shrink accordingly in the z direction. This moving mesh strategy prevents any deformation of elements around the sphere. The drag force on the sphere was calculated by integrating stress over the sphere's surface. Before simulating the contraction-induced flow, the mesh was verified with known drag force formulae (23).
Figure 3.
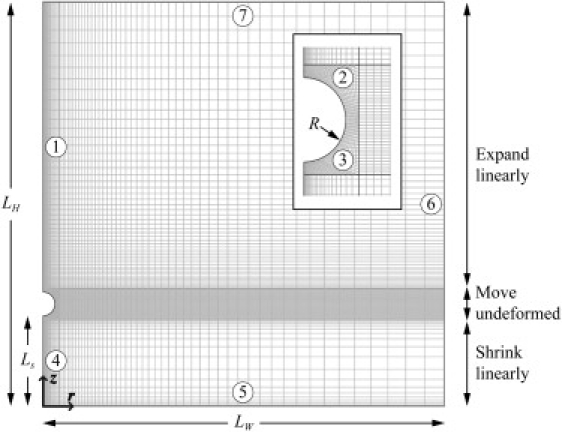
The two-dimensional axisymmetric mesh used for the CFD simulation. (Inset) Magnified view of the sphere area. The z axis is the axis of symmetry. Both the width (LW) and height (LH) of the mesh are 512 μm. The radius of the sphere (R) and the gap distance (Ls) were assigned according to the dimension of V. convallaria. Elements of the midsection move downward as a whole according to Eq. 7. Assigned boundary conditions are the axisymmetric condition for boundaries 1 and 4, the no-slip wall condition for boundary 5 representing the substrate, the moving wall condition for boundaries 2 and 3 representing the zooid, and the open condition for boundaries 6 and 7.
Results
Visualized contraction-induced flow
High-speed videos capture the dynamics of contraction in solutions of increasing viscosity. Measurements of the stalk length show that full shortening of the stalk takes a longer time to complete as the viscosity of the solution increases (Fig. 2 A). Whereas contraction finishes by 4 ms in 0% PVP solution, a comparable degree of shortening requires a few tens of milliseconds in 3% PVP solution. In a plot of the instantaneous velocity as a function of time (Fig. 2 B), the maximum contraction speed is reached within 1 ms after the start of contraction, but the magnitude of the rate decreases with increasing viscosity. The parameters of contraction dynamics are summarized in Table 1.
Visualized water flow around contracting V. convallaria shows that the direction of flow changes near the substrate. As the stalk shortens (Fig. 4 A), water surrounding the zooid is induced to flow. At t = 0.74 ms, near τu,max of contraction, particles between the zooid and substrate are directed parallel with the substrate and perpendicular to the direction of the cell body movement. By contrast, particles behind the cell body are directed downward and inward. These motions suggest that water flows limited by the substrate surface as the cell body approaches and fills the space displaced by the retracting cell body.
Figure 4.
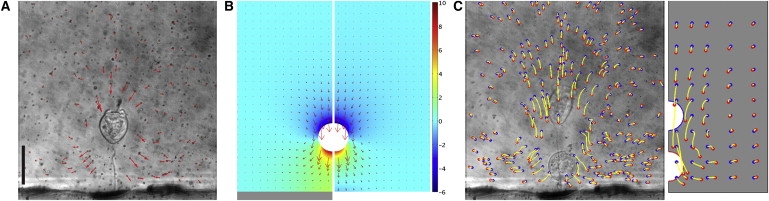
Water flow around contracting V. convallaria. (A) Experimentally visualized flow field at t = 0.74 ms, near τu,max. The scale of velocity vectors is arbitrary. Scale bar = 50 μm. (B) Flow velocity vectors (red arrows, arbitrary scale) with pressure distribution (Pa, colored fields) of corresponding CFD simulations for contraction in the presence (left panel) and absence (right panel) of the substrate (gray bar). (C) Particle trajectories around the same cell from the experiment (left panel) and CFD simulation (right panel). Yellow lines are particle paths, and blue and red dots indicate where particles start and stop, respectively. Images before and after contraction are overlapped. R = 19.1 μm, Remax = 2.3, Ls,max = 80.1 μm, Ls,min = 14.6 μm, c1 = 7.174 × 10⁻⁴ s, c2 = 1.257, and c3 = 1.086.
In comparison at t = 0.74 ms, flow velocity and pressure distribution for the same contraction-induced flow are simulated by CFD in the presence (Fig. 4 B, left panel) and absence (Fig. 4 B, right panel) of the bounding surface. For the simulation without the substrate, boundary 5 of the simulation model (Fig. 3) was modified to the open boundary condition. When the cell body moves in the absence of the bound, the vectors in front of the zooid in the CFD simulation are directed downward with the movement of the cell body. In front and back of the cell body are corresponding increased and decreased pressure, which dissipates well within the distance of the cell body. By contrast, movement toward the surface shows clear differences in flow vectors and pressures between the surface and cell body. First, the flow vectors decrease in magnitude and are directed outward at the surface bound. The simulation result with the substrate agrees well with the flow visualization result (see Movie S2 in the Supporting Material). Second, the pressure is increased through the entire region between the cell body and substrate. This higher pressure means that the zooid experiences greater upward or drag force, which is calculated as 34.4 nN with the substrate and 31.8 nN without the substrate. The wall effect of the substrate is responsible for this drag force difference.
Trajectories of seeded particles display the distance and paths of particles moving with flow induced by the contracting V. convallaria (Fig. 4 C). Particle traces from the flow visualization experiment (left panel) and the CFD simulation (right panel) display identical movements, with motion directed down and then outward as the cell body nears the substrate surface. Cells in 2% and 4% PVP solution showed similar flow patterns (data not shown).
Contraction force estimation
From the fitted velocity curves and CFD simulations, we derived estimates of the contraction force (Fig. 5) in increasing viscosity and under four conditions: Stokes' law (Fs, Eq. 1); the Stokes drag formula with the wall effect correction factor (Fsw, Eq. 5); the unsteady Stokes drag formula (Fus, Eq. 4); and the CFD simulation (Fcfd). Peak values of the estimated contraction force and the time to the peak contraction force (τf,max) are summarized in Table 3.
Figure 5.
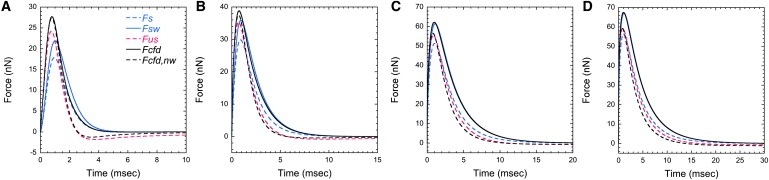
Dynamic contraction force in (A) 0%, (B) 1%, (C) 2%, and (D) 3% PVP solution. The force development is plotted assuming Stokes' law (Fs, dashed blue), Stokes' law with the wall effect corrected (Fsw, solid blue), the unsteady Stokes drag (Fus, dashed red), bounded CFD calculation (Fcfd, solid black), and unbounded CFD calculation (Fcfd,nw, dashed black).
Table 3.
The peak contraction force/the time to the peak contraction force, total work, maximum power output, and the efficiency of the spasmoneme
| PVP % | Fs (nN)/(ms) | Fsw (nN)/(ms) | Fus (nN)/(ms) | Fcfd (nN)/(ms) | Wtot (pJ) | Pmax (nW) | ɛ (%) |
|---|---|---|---|---|---|---|---|
| 0% | 17.9/0.96 | 21.9/1.01 | 24.2/0.76 | 27.7/0.79 | 1.64 | 1.56 | 8.0 |
| 1% | 29.9/0.90 | 35.9/0.95 | 35.3/0.71 | 38.8/0.75 | 2.25 | 1.36 | 11.0 |
| 2% | 51.3/1.03 | 61.4/1.10 | 55.4/0.85 | 62.2/0.98 | 3.72 | 1.49 | 18.2 |
| 3% | 56.4/1.04 | 67.1/1.11 | 59.4/0.85 | 67.5/1.02 | 3.79 | 1.19 | 18.5 |
Wtot and Pmax estimated with Eqs. 1, 4, and 5 are summarized in Table S1.
Contraction in water takes place under non-Stokes conditions. Comparison between Fs and the other estimates in peak values reveals the unsteady effect increased the drag force by 35% (Fs versus Fus) while the wall contributes a 22% greater force (Fs versus Fsw). Because the added mass force is negligibly small, the history force is responsible for the difference between Fs and Fus. This contribution of the history force (26% of Fus) is greater than previous estimates (14). Another observed difference between Fs and Fus is the time to the peak force. Whereas τf,max is coincident with τu,max for Fs, τf,max is reached earlier than τu,max for Fus, which is also true for Fcfd. This difference suggests that the peak contraction force precedes the peak contraction speed. In comparison with the peak force of Fs (17.9 nN), the calculated peak force in water from our CFD simulation, Fcfd,max (27.7 nN), is 55% larger because the CFD simulation takes account of the combined effects of the unsteadiness, the substrate, and the >1 Reynolds number. Therefore, application of Stokes' law underestimates the contraction force of V. convallaria.
An interesting feature of the force curves (Fig. 5 A) is that Fus becomes negative in the later stage of contraction. Negative force means that the zooid experiences the drag force in the direction of contraction, i.e., toward the substrate. We suggest that the memory effect of the fluid accounts for this negative drag. Although the zooid stops its motion, the induced flow cannot stop immediately because of its inertia. Consequently, the flow exerts force on the zooid. However, this negative force is not evident in the contraction force curve of Fcfd, the most rigorous estimate. We believe the difference is due to the substrate because when the substrate is omitted (Fcfd,nw), Fcfd,nw agrees with Fcfd in the early stage of contraction, but develops a negative force in the later stage. Therefore, the wall effect due to the substrate negates the following flow due to the memory effect.
Because the CFD calculation of unbounded contraction force, Fcfd,nw, assumes that the contraction-induced flow is not confined by the substrate, its flow condition is the same as that of Fus except for the Reynolds number (Fus assumes Re ≪1). Hence, the difference between Fus and Fcfd,nw shows the significance of the convective inertia force. The maximum of Fcfd,nw (27.3 nN) is ∼13% greater than that of Fus. Similarly, the agreement between Fcfd and Fcfd,nw in the early stage of contraction suggests that the wall effect is negligible in this phase. Therefore, in the case of contraction in water, the effect of the flow unsteadiness and the >1 Reynolds number is significant in the early stage of contraction because of acceleration and high speed, whereas the later stage of contraction becomes dominated by the wall effect because of proximity to the substrate.
With an increase in viscosity of the medium (μ), the peak contraction speed (|Uc|max) decreases and the contraction time (τc) increases, but the time to the peak contraction speed (τu,max) remains constant (Table 1). In addition, while the contraction speed decreases, the peak contraction force, Fd,max, increases due to the increasing medium viscosity. As expected from smaller Stokes numbers, the decreasing difference between Fs and Fus with the increasing medium viscosity suggests that the transient inertia effect becomes negligible in more viscous liquids. Furthermore, as the Reynolds number decreases, the convective inertia force becomes negligible and leads to smaller differences between Fus and Fcfd,nw. The increasing kinematic viscosity of the medium (ν = μ/ρ) implies that the viscous characteristic timescale (R2/ν) decreases and that any change in flow field diffuses in a shorter time. Hence, the memory effect of the fluid becomes more negligible. This trend is evident in Fus, which shows the negligible negative force in highly viscous media. Furthermore, because the Remax of the 3% PVP case is much smaller than unity, the induced flow can be regarded as a creeping flow. This interpretation is suggested by the perfect agreement between Fcfd and Fsw (Fig. 5 D).
Discussion
Our experiments and simulations dissect the relative contributions to the drag force for cell-scale movements through a fluid under conditions where the Reynolds number and Stokes number are in the regime between steady creeping and transient inertial flow. We show that movement toward a surface and the history force from the medium contribute significantly to the drag force. In our calculations for water, the simple assumption of Stokes' law counts for only 65% of the maximum contraction force. These calculations are only possible because we can account for the fluid flow by visualization of particle trajectories and computational fluid dynamics simulations.
Furthermore, the force development curves calculated in this study provide significant insight into the energetics of contraction. Because the stalk of V. convallaria shortens to the same length, the cell has to generate more force and work harder to contract as the viscosity of the medium increases (Table 3 and Fig. 6). This implies that the total work (Wtot) also increases while the fuel for contraction, calcium bound to the spasmoneme, should remain constant. The maximum energy available from binding of 1 mole of calcium ions (ΔμCa) is given as
| (8) |
where R is the universal gas constant (8.314 J/K·mol), T is the temperature (293°K), and [Ca2+]high and [Ca2+]low are calcium ion concentrations for the extended/coiled stalk, respectively (12). Because the extracted stalk remains extended when [Ca2+]free < 10−8 M and coiled when [Ca2+]free > 10−6 M, it is assumed that [Ca2+]high = 10−6 M and [Ca2+]low = 10−8 M. Here [Ca2+]free is the free calcium ion concentration of media. Then, ΔμCa is ∼11.2 kJ per 1 mole of calcium ion, and V. convallaria converts this amount of energy to mechanical work with certain efficiency. The total amount of energy available from calcium binding (Q) and the efficiency of the spasmoneme (ɛ) are given as
| (9) |
| (10) |
where NCa is the amount of calcium ions bound to 1 μm of the spasmoneme (10). Because the diameter of the spasmoneme is ∼1.5 μm (11), NCa is 1.57 × 10⁻¹⁷ mol/μm, and because the stalk length is ∼116 μm, Q is ∼20.4 pJ (see Supporting Material). Table 3 shows estimated ɛ, and the efficiency of the extracted stalk (∼7%) (10) is comparable to the current result for water. Considering that evaluated Wtot does not include work done to deform the stalk, the efficiency is expected to be higher than the current estimates.
Figure 6.
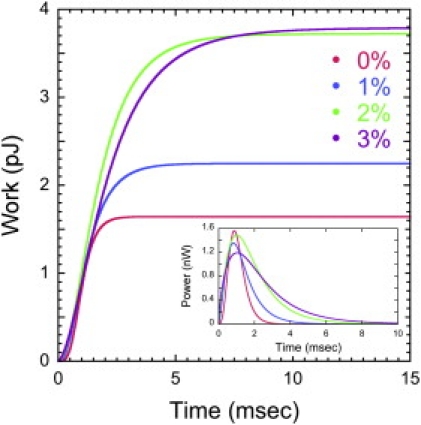
Mechanical work done and power dissipated (inset) by the spasmoneme to overcome viscous resistance in four PVP solutions.
In contrast to increasing Wtot, the maximum power output of the spasmoneme (Pmax) is constant irrespective of the significantly varying medium viscosity (Table 3). The CFD-based power estimate confirms power-limitedness of V. convallaria suggested based on Stokes' law (14). This power-limitedness suggests that V. convallaria generates and consumes energy for contraction in the same fashion in the early stage of contraction in different viscous loading conditions because the instantaneous work is very similar in terms of amount and gradient for all cases (Fig. 6). Thus, as a consequence of the limit on maximum power, V. convallaria adjusts its contraction behavior in different viscous solutions by decreasing the contraction speed and by increasing the efficiency of the spasmoneme. This explanation for a power-limit was proposed to explain the power-limit on bacterial motility (24). Having constant power input to their flagellum, bacteria alter the conformation and efficiency of the flagellum according to the medium viscosity. However, this study deals with only one V. convallaria cell, and it would require CFD-based estimations over a number of cells to confirm power-limitedness and the maximum contraction force scaling-law, Fd,max ∼ μ0.5, proposed based on Stokes' law (14).
Our studies examine the power of stalk contraction of V. convallaria in passive loading conditions. The natural medium surrounding V. convallaria can exert a viscous resistance force only when the cell contracts. Consequently, the medium cannot maintain significant resistance in the early and later stages of contraction. The power-limit can be examined under different passive and active loading forces. Similar to the passive load from a viscous solution, a micropipette attached to the cell body exerts a passive force proportional to the contraction distance (11). In this condition the bent micropipette exerts force even after contraction is completed. By contrast, a centrifugal force on the cell body is an active loading condition, because the cell is always under the influence of the force (11). Contraction of V. convallaria in a viscous fluid flow is also an active loading condition. In this case, τu,max varies according to the magnitude of the applied drag force (S. Ryu and P. Matsudaira, unpublished data) while V. convallaria in stagnant media shows almost constant τu,max (Table 1). This difference suggests that the contraction dynamics of V. convallaria may depend on the type and condition of external loading. Therefore, the power-limitedness of V. convallaria must be extended to active loading conditions in which the stalk length is stalled to various degrees.
Supporting Material
One table, seven equations, and two movies are available at http://www.biophysj.org/biophysj/supplemental/S0006-3495(10)00277-8.
Supporting Material
Acknowledgments
The authors thank Howard Stone at Princeton University for his comments on the draft. S.R. thanks Valeriya Baru for her mentoring in the biology of V. convallaria.
This study is supported by the Institute for Collaborative Biotechnologies through grant No. DAAD19-03-D-0004 to P.M. from the U.S. Army Research Office. Initial experiments were supported by a grant from Dupont to P.M.
Footnotes
Sangjin Ryu's present address is Division of Engineering, Brown University, Providence, Rhode Island.
Paul Matsudaira's present address is Department of Biological Sciences, National University of Singapore, Singapore.
References
- 1.Mahadevan L., Matsudaira P. Motility powered by supramolecular springs and ratchets. Science. 2000;288:95–100. doi: 10.1126/science.288.5463.95. [DOI] [PubMed] [Google Scholar]
- 2.Buhse, J. H. E., and J. C. Clamp, 2001. Vorticella. In Encyclopedia of Life Sciences. John Wiley & Sons, Chichester. http://www.els.net/.
- 3.Moriyama Y., Hiyama S., Asai H. High-speed video cinematographic demonstration of stalk and zooid contraction of Vorticella convallaria. Biophys. J. 1998;74:487–491. doi: 10.1016/S0006-3495(98)77806-3. [DOI] [PMC free article] [PubMed] [Google Scholar]
- 4.Amos W.B. Structure and coiling of the stalk in the peritrich ciliates Vorticella and Carchesium. J. Cell Sci. 1972;10:95–122. doi: 10.1242/jcs.10.1.95. [DOI] [PubMed] [Google Scholar]
- 5.Hoffmann-Berling H. The mechanism of a new contraction cycle different from muscle contraction. Biochim. Biophys. Acta. 1958;27:247–255. doi: 10.1016/0006-3002(58)90331-7. [DOI] [PubMed] [Google Scholar]
- 6.Ochiai T., Asai H., Fukui K. Hysteresis of contraction-extension cycle of glycerinated Vorticella. J. Protozool. 1979;26:420–425. [Google Scholar]
- 7.Amos W.B., Routledge L.M., Yew F.F. Calcium-binding proteins in a vorticellid contractile organelle. J. Cell Sci. 1975;19:203–213. doi: 10.1242/jcs.19.1.203. [DOI] [PubMed] [Google Scholar]
- 8.Ueda K. Studies on the stalk muscle of Carchesium (I) Zool. Mag. 1952;61:367–371. [Google Scholar]
- 9.Rahat M., Pri-Paz Y., Parnas I. Properties of stalk-muscle contractions of Carchesium sp. J. Exp. Biol. 1973;58:463–471. [Google Scholar]
- 10.Moriyama Y., Yasuda K., Asai H. Ca2+-induced tension development in the stalks of glycerinated Vorticella convallaria. Cell Motil. Cytoskeleton. 1996;34:271–278. doi: 10.1002/(SICI)1097-0169(1996)34:4<271::AID-CM2>3.0.CO;2-B. [DOI] [PubMed] [Google Scholar]
- 11.France, D.C. 2007. Structure and mechanics of the spasmoneme, a biological spring within the protozoan Vorticella convallaria. PhD thesis, Massachusetts Institute of Technology, Cambridge, MA.
- 12.Amos W.B. Reversible mechanochemical cycle in the contraction of Vorticella. Nature. 1971;229:127–128. doi: 10.1038/229127a0. [DOI] [PubMed] [Google Scholar]
- 13.Clift R., Grace J.R., Weber M.E. Dover Publications; Mineola, New York: 1978. Bubbles, Drops, and Particles. [Google Scholar]
- 14.Upadhyaya A., Baraban M., Mahadevan L. Power-limited contraction dynamics of Vorticella convallaria: an ultrafast biological spring. Biophys. J. 2008;94:265–272. doi: 10.1529/biophysj.107.108852. [DOI] [PMC free article] [PubMed] [Google Scholar]
- 15.Michaelides E.E. World Scientific Publishing; Singapore: 2006. Particles, Bubbles and Drops—Their Motion, Heat and Mass Transfer. [Google Scholar]
- 16.Brenner H. The slow motion of a sphere through a viscous fluid towards a plane surface. Chem. Eng. Sci. 1961;16:242–251. [Google Scholar]
- 17.Maude A.D. End effects in a falling-sphere viscometer. Br. J. Appl. Phys. 1961;12:293–295. [Google Scholar]
- 18.Sleigh M.A., Barlow D. Collection of food by Vorticella. Trans. Am. Microsc. Soc. 1976;95:482–486. [Google Scholar]
- 19.Vacchiano E.J., Kut J.L., Buhse H.E. A novel method for mass-culturing Vorticella. J. Protozool. 1991;38:608–613. [Google Scholar]
- 20.Vacchiano E., Dreisbach A., Buhse H.E. Morphogenetic transitions and cytoskeletal elements of the stalked zooid and the telotroch stages in the peritrich ciliate Vorticella convallaria. J. Protozool. 1992;39:101–106. [Google Scholar]
- 21.Simons T.J.B. Vanadate—a new tool for biologists. Nature. 1979;281:337–338. doi: 10.1038/281337a0. [DOI] [PubMed] [Google Scholar]
- 22.Sbalzarini I.F., Koumoutsakos P. Feature point tracking and trajectory analysis for video imaging in cell biology. J. Struct. Biol. 2005;151:182–195. doi: 10.1016/j.jsb.2005.06.002. [DOI] [PubMed] [Google Scholar]
- 23.Ryu, S., and P. T. Matsudaira. 2008. CFD-based evaluation of drag force on a sphere unsteadily moving perpendicularly toward a solid surface: a simple model of a biological spring, Vorticella convallaria. In Proceedings of 2008 COMSOL User Conference. Boston, MA.
- 24.Schneider W.R., Doetsch R.N. Effect of viscosity on bacterial motility. J. Bacteriol. 1974;117:696–701. doi: 10.1128/jb.117.2.696-701.1974. [DOI] [PMC free article] [PubMed] [Google Scholar]
Associated Data
This section collects any data citations, data availability statements, or supplementary materials included in this article.