

Abstract
Fluorescence resonance energy transfer (FRET), measured by fluorescence intensity-based microscopy and fluorescence lifetime imaging, has been used to estimate the size of oligomers formed by the M2 muscarinic cholinergic receptor. The approach is based on the relationship between the apparent FRET efficiency within an oligomer of specified size (n) and the pairwise FRET efficiency between a single donor and a single acceptor (E). The M2 receptor was fused at the N terminus to enhanced green or yellow fluorescent protein and expressed in Chinese hamster ovary cells. Emission spectra were analyzed by spectral deconvolution, and apparent efficiencies were estimated by donor-dequenching and acceptor-sensitized emission at different ratios of enhanced yellow fluorescent protein-M2 receptor to enhanced green fluorescent protein-M2 receptor. The data were interpreted in terms of a model that considers all combinations of donor and acceptor within a specified oligomer to obtain fitted values of E as follows: n = 2, 0.495 ± 0.019; n = 4, 0.202 ± 0.010; n = 6, 0.128 ± 0.006; n = 8, 0.093 ± 0.005. The pairwise FRET efficiency determined independently by fluorescence lifetime imaging was 0.20–0.24, identifying the M2 receptor as a tetramer. The strategy described here yields an explicit estimate of oligomeric size on the basis of fluorescence properties alone. Its broader application could resolve the general question of whether G protein-coupled receptors exist as dimers or larger oligomers. The size of an oligomer has functional implications, and such information can be expected to contribute to an understanding of the signaling process.
Keywords: Confocal Microscopy, Fluorescence Resonance Energy Transfer (FRET), G Protein-coupled Receptors (GPCR), 7-Helix Receptor, Mathematical Modeling, Fluorescence Lifetime Imaging (FLIM), M2 Muscarinic Receptor, Oligomer, eGFP, eYFP
Introduction
Much evidence now indicates that G protein-coupled receptors can exist as oligomers (1, 2), a development that has implications for all aspects of GPCR4-mediated signaling. Among the many questions prompted by the emergence of such structures is that of oligomeric size. Although commonly referred to as dimers, oligomers of GPCRs have been detected most often by means of coimmunoprecipitation or resonance energy transfer (3). As typically applied, neither technique can distinguish dimers from larger oligomers. The latter have been identified on the basis of their electrophoretic mobility (reviewed in Ref. 4), but the composition of the bands may be unclear, and the size under the conditions of electrophoresis may have little in common with that in the membrane. Larger oligomers also have been identified by approaches in which detection requires the colocalization of three or four proteins, each bearing a different tag (5–11), but such procedures place only a lower limit on the possible size of the array.
There have been comparatively few attempts to examine the oligomeric status of a GPCR in a more quantitative and explicit manner. Measurements of BRET at different ratios of acceptor to donor have pointed to dimers of the melatonin receptor (12), the β1- and β2-adrenergic receptors (13), the M1, M2, and M3 muscarinic receptors (14), and the neurotensin receptor (15). In each case, however, the data were analyzed in terms of a model developed for gramicidin and based on the notion of a dynamic equilibrium between the monomeric and oligomeric states (16). Measurements of the efficiency at which differently tagged adducts were coimmunoprecipitated from extracts of coinfected Sf9 cells suggested that the M2 muscarinic receptor is at least a trimer (5), but the value depended upon properties that were difficult to measure or control.
In this study, we introduce a general method for the determination of oligomeric size from the efficiency of fluorescence resonance energy transfer, as estimated from the spectral properties and fluorescence lifetimes. The theory underlying the spectral analyses has been described previously (17) and is based on the following two considerations: first, the apparent FRET efficiency is determined by the size of the oligomer and its complement of donors and acceptors; second, the pairwise FRET efficiency, i.e. the efficiency for the transfer of energy from a single donor to a single acceptor, can be inferred from the apparent efficiency by means of a model in which all pathways for FRET are enumerated for all combinations of donor and acceptor in an oligomer of specified size.
This approach has been applied to fluorophore-tagged M2 muscarinic cholinergic receptors expressed in CHO cells. The data indicate that the receptor exists as a tetramer, as suggested previously on the basis of electrophoretic mobility (4, 5, 18), copurification (4, 5, 18), and noncompetitive effects in the binding of agonists and antagonists (4, 18–20). Similar studies on other GPCRs can be expected to reveal the degree of oligomeric diversity within the rhodopsin-like subgroup and across the family at large. The approach also can be extended from live cells to more controlled systems, where it may help to distinguish functional properties that are intrinsic to monomers from those that emerge as a consequence of oligomerization. Such information has implications for our understanding of the mechanistic and molecular factors that underlie signaling. A preliminary report of this work has appeared elsewhere (21).
EXPERIMENTAL PROCEDURES
Fluorophore-tagged Receptors
The human M2 muscarinic receptor was fused at the N terminus to eGFP, eYFP, or eCFP. The fluorophores were preceded by a cleavable signal sequence derived from the chicken α7 nicotinic acetylcholine receptor signal peptide (α7ss), which has been shown to enhance localization at the plasma membrane (22). Placement of the fluorophores at the extracellular surface permitted their environment to be controlled with respect to pH. The cDNA coding for eGFP was generated from that for eYFP by site-directed mutagenesis at the following three positions: F64L, S65T, and H231L. The cDNA coding for eCFP was generated from that for eGFP by site-directed mutagenesis at a further six positions as follows: K26R, Y66W, N146I, M153T, V163A, and N164H (23–25). Dimerization of the fluorophore was precluded in each case by the mutation A206K (26).
The signal sequence, the cDNA coding for eGFP, eYFP, or eCFP, and the cDNA coding for the receptor were amplified by PCR, which added 20 bases corresponding to the 5′ and 3′ ends of what would become the contiguous fragment. This created overlapping regions of homology within the fragments, which were combined with vector DNA and linked by homologous recombination in living yeast cells (27).
eYFP also was fused to the N terminus of a truncated variant of the rat Wnt receptor, Frizzled-1 (rFz1). The truncated form included amino acids 294–640 and was amplified via PCR from a previously generated expression vector containing wild-type rFz1 (28). AscI and NheI restriction sites were added by means of the primers at the 5′ and 3′ ends, respectively. The amplified product was digested and ligated into the pIRESpuro vector at a position downstream of the reading frame for α7ss-eYFP.
All sequences were confirmed by DNA sequencing. Plasmid DNA was recovered from yeast cells and propagated in bacteria. Genes necessary for the replication and growth of yeast were removed using standard molecular biological techniques.
Cell Culture
Chinese hamster ovary (CHO-S) cells were grown in Dulbecco's modified Eagle's medium containing GlutaMAX® supplemented with 10% (v/v) fetal bovine serum and 0.1 mm nonessential amino acids. All reagents were from Invitrogen. The cells were grown on sterile glass coverslips (Fisher) at 37 °C in a humidified atmosphere of 6% CO2. The coverslips (10 mm for standard confocal imaging and 25 mm for FLIM) were coated with poly-l-ornithine (Sigma) (29), seeded with a total of 1 × 10⁵ cells, and incubated for 24 h to ensure adhesion. The cells then were transfected with 1 μg of each plasmid using Lipofectamine 2000 (Sigma) (30), incubated for a further 24 h, and washed with PBS prior to imaging. The efficiency of transfection was 52%, measured as the fraction of cells expressing eGFP-M2. Standard confocal imaging and FLIM were performed in Dulbecco's PBS (Sigma) and RPMI media (Wisent), respectively.
Immunocytochemistry
CHO cells were plated on sterile glass coverslips (25 mm), transfected with the plasmid coding for eGFP-M2, and incubated for 24 h as described above. The cells then were incubated for 1 h with a monoclonal anti-eGFP antibody (Abcam) at a dilution of 1:1,000, washed three times with sterile PBS, and incubated for 1 h with a Cy3-labeled anti-IgG (mouse) antibody (Jackson ImmunoResearch) at a dilution of 1:100. They subsequently were washed three times with sterile PBS and transferred to RPMI media for imaging. Images were acquired on a Zeiss Axiovert 100 laser-scanning confocal microscope. Enhanced GFP was irradiated using a 488-nm Ar+ laser operated at 0.93 milliwatt (i.e. 3.7% of the maximum power) and a 500–550-nm bandpass filter. Cy3 was irradiated using a 543-nm HeNe laser at 100% of the maximum power (1 milliwatt) and a 560-nm long pass filter.
Binding of Radioligands
CHO cells were seeded on 150-mm plates and transfected with 50 μg of the plasmid for eGFP-M2 using calcium-phosphate precipitation (31–33). The efficiency of transfection was 12%. After 24 h, the cells were harvested in buffer A (50 mm HEPES, 10 mm MgCl2, 1 mm EDTA, 1 Complete Protease Inhibitor Cocktail tablet (Roche Diagnostics), adjusted to pH 7.45 with NaOH). The membranes then were homogenized by several passes in a Potter-Elvehjem tissue blender with a Teflon pestle. The protein concentration was measured using a BCA assay kit from Pierce, with bovine serum albumin (Pierce) taken as the standard, and the homogenate was diluted to 0.07 g of protein per liter with buffer A. The diluted homogenate was centrifuged at 5,000 × g for 15 min at 4 °C, and the pellet was stored at −80 °C.
Thawed pellets were resuspended in buffer A, and the binding of [3H]quinuclidinylbenzilate (Amersham Biosciences, lot B52, 48 Ci/mmol) was measured at graded concentrations of the radioligand after equilibration of the mixture for 2 h. Further details regarding the binding assays and the analysis of the data in terms of the Hill equation have been described previously (Ref. 4 and references therein).
Release of Ca2+
CHO cells were grown in a 6-well plate and cotransfected, using Lipofectamine 2000, with 1 μg each of the plasmids coding for eCFP-M2 and Gαqi9. The latter is a chimeric form of Gαq in which nine residues at the C terminus have been replaced with the corresponding nine residues from Gαi2 (34). The cells then were bathed in an imaging buffer (20 mm HEPES, 146 mm NaCl, 5 mm KCl, 1 mm MgCl2, 1 mm CaCl2, 1 g/liter bovine serum albumin, 1 g/liter glucose, adjusted to pH 7.4 with NaOH) and loaded with Fluo-4 (Invitrogen). Changes in the level of intracellular calcium upon the addition of oxotremorine-M and N-methylscopolamine were monitored in a FLEXstation scanning fluorometer (Molecular Devices) according to protocols that have been described previously (35). eCFP-M2 was used in place of eGFP-M2 or eYFP-M2 to avoid direct excitation of the fluorophore by the xenon lamp at 492 nm, the wavelength used to excite Fluo-4. The emission was measured at 525 nm.
Estimation of Apparent FRET Efficiency by Spectral Analysis
Confocal images were acquired on a Leica SP2 confocal microscope equipped with a 40× oil immersion lens. Each full spectral scan encompassed the range from 474.5 to 552.5 nm, which was covered in 14 emission frames with a bandwidth of 5 nm and separated by 1 nm. Samples were excited at 458 nm by means of an Ar+ laser and an RT-30/70 dichroic mirror. Images were acquired from single focal sections in which the tagged receptors were located predominantly at the plasma membrane, as determined from a comparison of the fluorescence and contrast images. The diameter of the pinhole was 1 Airy unit throughout. All intensities were measured using ImageJ (36).
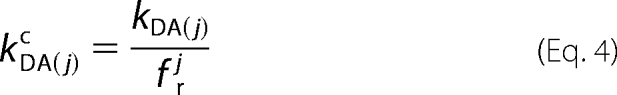
Emission spectra were recorded before and after stepwise photobleaching of the acceptor. The individual contributions of donor and acceptor to each spectrum were determined by deconvolution (37) and expressed as kDA(j) and kAD(j), respectively, which represent the emission from each fluorophore at its respective peak after the jth round of photobleaching.
The acceptor was photobleached by scanning the field of view three consecutive times with an Ar+ laser at 514 nm, and the amount remaining after photobleaching was determined by measuring the intensity of fluorescence at 526–531 nm upon excitation at 514 nm. The process was repeated until the emission was indistinguishable from background levels or there was an interruption, such as a movement of the cell that caused a change in the population of fluorophores within the focal plane. The data from 36 cells treated in this manner were subjected to further analysis as described below; the mean intensity of emission from the acceptor after the last round of photobleaching was 43% (s.e. = 3%) of that recorded initially.
The apparent FRET efficiency was estimated by donor-dequenching (Eappddq, Equation 1) and by acceptor-sensitized emission (Eappase, Equation 2). Both estimates were obtained for each cell.
 |
 |
In Equation 1, the parameter kDA(0) represents the intensity of emission from the donor in the presence of unbleached acceptor. The parameter kD represents the intensity in the absence of acceptor, which was estimated by extrapolation of the observed linear relationship between kAD(j) and kDA(j) to obtain a value for kDA(j) after complete photobleaching of eYFP-M2 (i.e. when kAD(j) = 0) (Fig. 1A).
FIGURE 1.

Emission from eGFP-M2 upon photobleaching at 514 nm. A, cell coexpressing eGFP-M2 and eYFP-M2 was subjected to 12 rounds of photobleaching and spectral analysis to obtain values of kDA(j) and kAD(j) for the cell before bleaching (j = 0) and after each successive round (j = 1–12) (●). The stepwise decrease in kAD(j) was accompanied by an increase in kDA(j) that arose from donor-dequenching. Each value of kDA(j) also was adjusted according to Equation 4 to correct for photobleaching of the donor (○). The lines were fitted to the uncorrected (●) and corrected data (○) by linear regression, and the corresponding x-intercepts represent kDe and kDec, respectively, as described in the text. B, cell expressing eGFP-M2 alone was subjected to successive rounds of photobleaching. The emission spectrum was acquired after each step (j), and the intensity at the maximum (kD(j)) is shown relative to that from the unbleached cell (kD(0)). The line represents the best fit of Equation 3 to the data, and the fitted value of fr is 0.989 ± 0.001. Inset, the emission spectrum was recorded before photobleaching (■) and after each successive step j (▴, ▾, ♦, ●, □, ▵, ▿). A.U., arbitrary units.
Two values of kD can be obtained for each cell. One is based on the estimates of kDA(j) taken at face value, and it therefore disregards the possibility that the donor is photobleached during successive rounds of spectral acquisition and irradiation at 514 nm. Such a relationship between kAD(j) and kDA(j) is illustrated by the closed circles in Fig. 1A, and the corresponding value of kD is designated here as kDe.
The second value of kD incorporates a correction for photobleaching of the donor. To measure the potential magnitude of such an adjustment, cells expressing eGFP-M2 alone were photobleached at 514 nm in the stepwise manner described above for cotransfected cells. The emission spectrum was recorded after each round of photobleaching (j), as illustrated in Fig. 1B (inset), and the intensity at 508–513 nm (kD(j)) was normalized to the corresponding intensity from the unbleached cell (kD(0)). The decrease in kD(j)/kD(0) with respect to j can be described empirically by Equation 3 (Fig. 1B), in which fr is the fraction of the signal remaining after a single round of photobleaching; frj is therefore the fraction remaining after the jth round, and kD(0) and kD(j) represent the intensity of emission from eGFP-M2 before photobleaching and after the jth round, respectively. The effect on kD(j)/kD(0) was consistent from cell to cell, and the mean value of fr from 21 cells is 0.981 (s.e. = 0.001).
To compensate for photobleaching of the donor in cotransfected cells, each estimate of kDA(j) was adjusted upward according to Equation 4.
 |
Linear extrapolation of the relationship between kAD(j) and kDA(j)c yields the intensity of emission in the absence of acceptor, corrected for photobleaching of the donor (Fig. 1A, open circles). That value is designated here as kDec.
In Equation 2, the parameter kAD(0) represents the intensity of emission from the acceptor in the presence of the donor, as determined by deconvolution of the spectrum from the unbleached cell. The corresponding denominator is the intensity of emission from eYFP-M2 at 526–531 nm upon excitation at 458 nm in the absence of eGFP-M2, calculated as the difference between the total emission at 526–531 nm upon excitation at 514 nm (i.e. kA514) and that portion attributable to eGFP-M2 (i.e. kDηDθ). The quotient in Equation 2 was adjusted for the difference in excitation wavelength between numerator and denominator by the factor ηA (Equation 5), which is the intensity of emission at 526–531 nm upon excitation at 458 nm (I458) relative to that upon excitation at 514 nm (I514).
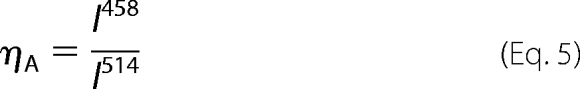 |
The value of ηA was determined from eYFP-M2 expressed alone, and the mean from 40 such cells is 0.211 (s.e. = 0.001).
To estimate the contribution of the donor to the denominator in Equation 2, the value of kD was taken as either kDe or kDec, as described above, and adjusted to account for differences in the wavelengths of excitation (ηD) or emission (θ). The factor ηD is the intensity of emission from the donor at 526–531 nm upon excitation at 514 nm (I514) relative to the intensity upon excitation at 458 nm (I458) (Equation 6).
 |
The value of ηD was determined from eGFP-M2 expressed alone, and the mean from 38 such cells is 0.48 (s.e. = 0.03). The factor θ is the intensity of emission from the donor at 526–531 nm (I(526–531)) relative to the peak intensity at 508–513 nm (I(508–513)) (Equation 7).
 |
Both kDe and kDec were determined by deconvolution, as described above, and therefore represent the intensity of emission at 508–513 nm. The value of θ is 0.464.
For estimates of the FRET efficiency uncorrected for photobleaching of the donor, the value of kD was taken throughout as kDe (i.e. in Equations 1 and 2). For efficiencies corrected for photobleaching of the donor, the value of kD was taken throughout as kDec.
Relationship between Pairwise FRET Efficiency and Oligomeric Size
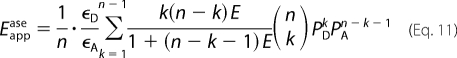
Apparent FRET efficiencies (Eapp) were measured in cells differing in the ratio of total acceptor ([A]T) to total donor ([D]T). Differences in [A]T/[D]T emerged stochastically upon cotransfection of the two plasmids. The data were analyzed in terms of a model described previously (17) to obtain fitted estimates of the pairwise FRET efficiency (E) between a single donor and a single acceptor in an oligomer of size n.
To compare the results for different values of n, it was assumed that the value of E is the same for all combinations of donor and acceptor within the oligomer (Equations 8–13). For the specific case of a tetramer (n = 4), the model also was formulated with arbitrary distances as described below (Equations 14 and 15) and in the supplemental material. Either approach is expected to be consistent with the dynamic averaging that would ensue if the fluorophore were to interconvert through multiple orientations on a time scale that was rapid relative to that of a spectral measurement. It is assumed throughout that all oligomers are of the same size.
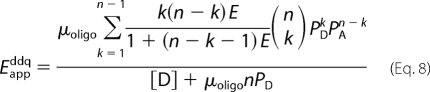
If E is the same for all pairs of donor and acceptor within an oligomer, the apparent FRET efficiency in a mixture of monomers and oligomers is given by Equations 8 and 9 (17)
 |
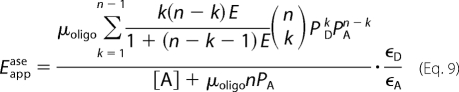 |
The ratio [A]T/[D]T is the independent variable and enters into the model as PA = [A]T/([A]T + [D]T) and PD = [D]T/([A]T + [D]T). Different combinatorial arrangements of donor and acceptor are accommodated by the summation over all values of k, which denotes the number of donor-tagged protomers within the oligomer. In Equation 9 and elsewhere, the ratio ϵD/ϵA equals (ϵD488eD458)/(ϵA514eA458). The constants ϵD488 and ϵA514 denote the extinction coefficient of the donor and acceptor, respectively, at the peak in the excitation spectrum. They were corrected for submaximal excitation by the factor eX458 (X ≡ D or A), which is the excitation of the fluorophore at 458 nm relative to that at the wavelength of maximum excitation. The value of eX458 was taken as 0.62 and 0.09 for the donor and acceptor, respectively (23, 38), and the corresponding values of ϵD488eD458 and ϵA514eA458 are 33,170 m−1 cm−1 (eGFP) and 7,434 m−1 cm−1 (eYFP) (37).
The parameter μoligo in Equations 8 and 9 represents the concentration of oligomer in the presence of monomeric donor or acceptor at the concentration [D] or [A]. If there are no free monomers, Equations 8 and 9 simplify to Equations 10 and 11, respectively.
 |
 |
To test for the presence of monomers in the context of the model, Equations 8 and 9 were rearranged as Equations 12 and 13, in which the parameter ξ represents the relative number of protomers in the monomeric and oligomeric states, i.e. ξD = [D]/(μoligonPD) and ξA = [A]/(μoligonPA).
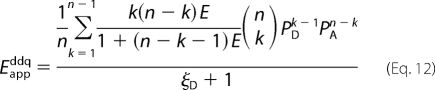 |
 |
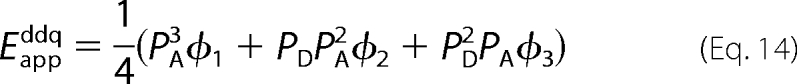
Two specific configurations of a tetramer were examined for the implications of arbitrary distances between donor and acceptor, namely a square and the rhombus formed by two equilateral triangles (supplemental material). Each arrangement predicts two values for the pairwise FRET efficiency between one donor and one acceptor; one value corresponds to the transfer of energy along one side (Es), and a second corresponds to that across the diagonal (Ed). These values of E are linked in a manner that is defined by the relative, center-to-center distances between individual fluorophores within each oligomer. General expressions for the apparent FRET efficiency in either a square or a rhombus are shown below as Equations 14 and 15, in which the coefficients ϕj are functions of Es or Ed. The specific expressions and other details are described in the supplemental material (square, Equations S9a and S9b; rhombus, Equations S11a and S11b).
 |
Estimation of [A]T/[D]T
Equations 8–15 were applied to data from cells for which estimates of both Eappddq and Eappase were available. The required values of [A]T/[D]T therefore were calculated according to Equation 16 (17).
 |
In cells coexpressing eGFP-M2 and eYFP-trFz1, Eappase was not defined because of the virtual absence of FRET. The value of [A]T/[D]T for each cell was therefore calculated according to Beer's law as shown in Equation 17.
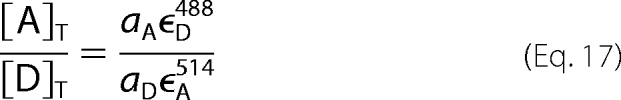 |
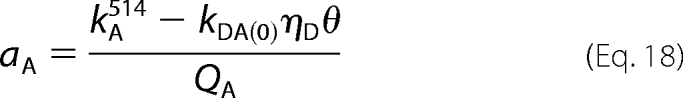
The absorbance of the acceptor (aA) was obtained from Equation 18, in which the difference kA514 − kDA(0)ηDθ is the intensity of emission from eYFP-trFz1 at 526–531 nm upon excitation at 514 nm; kA514 is the total emission under those conditions, and kDA(0)ηDθ is that portion attributable to eGFP-M2 as described below. QA is the quantum yield of eYFP, which was taken as 0.61 (37).
 |
The absorbance of the donor (aD) was obtained from Equation 19, in which QD is the quantum yield of eGFP taken as 0.64 (37). Equation 19 incorporates a correction for the FRET efficiency as determined by donor dequenching (1 − Eappddq) and for the difference between excitation at 458 nm and excitation at 488 nm (eD458). A negative value of Eappddq was entered as zero.
 |
The constant kDA(0) in Equations 18 and 19 is the intensity of emission at 508–513 nm upon excitation at 458 nm. Because of the absence of FRET, as indicated by the results of spectral deconvolution, this is a measure of the emission from the unquenched donor. Its use here is therefore analogous to the substitution of kDe or kDec for kD in Equation 2.
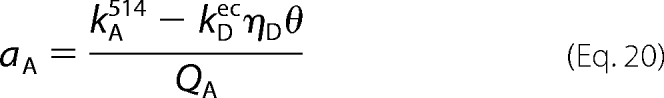
Data from cells coexpressing eGFP-M2 and eYFP-trFz1 were compared with the results from similar measurements with cells coexpressing eGFP-M2 and eYFP-M2. In the latter case, the values of aA and aD required by Equation 17 were calculated according to Equations 20 and 21. The value of kDec was determined from the deconvoluted spectra after successive photobleaching as described above.
 |
 |
Estimation of FRET Efficiency from Fluorescence Lifetimes
Time-correlated single-photon counting was carried out on a Zeiss Axiovert 100 laser-scanning confocal microscope equipped with Hamamatsu R3809U-52 detectors controlled by a Becker-Hickl DCC-100 control module. The excitation source was a Chameleon multiphoton laser system (Coherent) tuned to 900 nm (eGFP-M2 alone or eGFP-M2 plus eYFP-M2) or 930 nm (eYFP-M2), and the cells were scanned at power setting 8 for a period that ranged from 360 to 480 s. The emission was measured over all wavelengths in a focal plane near the center of the cell, and images were acquired with a 40× oil immersion lens at a resolution of 128 × 128 pixels.
The images were analyzed on a pixel-by-pixel basis using SPCImage (Becker-Hickl). Four pixels generally were binned to obtain the data for subsequent analyses. For each bin, all photons collected over the course of the measurement were described by the convolution of the instrument response function and a sum of q exponentials; the latter is shown as Equation 22, which describes the time-dependent decay of fluorescence from a value determined by the former. The parameter τj represents the lifetime of component j; aj is the corresponding amplitude, and a0 is the time-independent background.
 |
Equation 22 was taken as a monoexponential (q = 1) in the case of cells expressing eGFP-M2 or eYFP-M2 alone and as a biexponential (q = 2) or a triexponential (q = 3) for those coexpressing eGFP-M2 and eYFP-M2. The number of traces ranged from 1.4 × 10⁴ to 106 per image.
The distribution of all lifetimes obtained from Equation 22 for all bins in the same image was described empirically as a sum of gaussians. The data were analyzed in terms of Equation 23, in which the parameter τ0,j represents the mean lifetime of the jth gaussian; Aj and σj represent the corresponding amplitude and standard deviation, respectively.
 |
Distributions from cells expressing eGFP-M2 or eYFP-M2 alone were described by a single gaussian (q = 1). Those from cotransfected cells were described by two or three gaussians (q = 2 or 3) as described below.
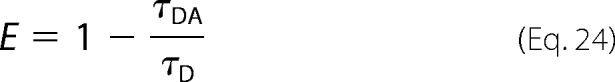
The FRET efficiency for a single donor-acceptor pair (E) was calculated according to Equation 24, in which τDA and τD represent the lifetimes of quenched and unquenched eGFP-M2, respectively (39). The values of τDA and τD for each cell were taken as the fitted values of τ0,1 and τ0,2 (Equation 23), as described under “Results,” and the means from all cells were substituted in Equation 24.
 |
When the oligomer is a dimer, the value of τ0,1 estimated from Equation 23 is the lifetime for the interaction between one donor and one acceptor. In that case, the values of E in Equation 24 and in Equations 8–13 are identical. With larger oligomers, the fitted value of τ0,1 is a biased average of two or more lifetimes as described in the supplemental material.
Statistical Procedures
Equations 8–15, 22, and 23 were fitted to the data by nonlinear regression. The errors associated with parameters derived from a single analysis were estimated from the diagonal elements of the covariance matrix. Differences in the sum of squares associated with fewer or additional parameters were tested for significance by means of the F statistic. Further details regarding these and other statistical procedures have been described previously (40).
RESULTS
Functionality and Levels of Expression
Upon expression in CHO cells, M2 muscarinic receptors bearing eGFP, eYFP, or eCFP at the N terminus appeared to reside predominantly at the plasma membrane. Except where stated otherwise, most fluorescence emanated from an annulus coincident with the membrane in the focal plane of cells selected for further analysis (Fig. 2A). Also, there was marked colocalization of the fluorescence from eGFP and Cy3 when intact, nonpermeabilized cells expressing eGFP-M2 were treated successively with an eGFP-specific primary antibody and a Cy3-conjugated secondary antibody (Fig. 2C). Cells expressing eGFP-M2 and treated only with the secondary antibody displayed no fluorescence above 560 nm upon irradiation at 543 nm; similarly, no fluorescence was obtained upon treatment with the primary antibody alone.
FIGURE 2.

Localization and activation of eGFP-M2 and eCFP-M2 in live CHO cells. A and B, left panel shows the contrast image of a CHO cell expressing eGFP-M2 (A) or eYFP-trFz1 (B), and the right panel shows the confocal image of the same cell irradiated at 458 nm. Similar results were obtained with eYFP-M2 and eCFP-M2. C, CHO cells expressing eGFP-M2 were labeled with a mouse anti-GFP primary antibody and an anti-IgG (mouse) secondary antibody conjugated to Cy3. The individual panels are as follows: from left to right, contrast image, fluorescence from eGFP upon irradiation at 488 nm, fluorescence from Cy3 upon irradiation at 543 nm, and the merged image from 2nd (eGFP) and 3rd (Cy3) panels. D, CHO cells expressing eGFP-M2 were imaged at different times after the addition of 0.1 mm carbachol. Punctate densities appeared at the membrane after 15 min, followed by internalization after 30 min; by 60 min, the loss of signal from the plasma membrane was almost complete. The same cell is shown at each time. E, cells coexpressing eCFP-M2 and Gαqi9 were monitored at 525 nm for Ca2+-induced fluorescence. At the time shown by the arrow, the cells were treated with 10 mm oxotremorine-M alone (○) or together with 1 μm N-methylscopolamine (●). F and G, decay of fluorescence was monitored from cotransfected CHO cells in which eGFP-M2 and eYFP-M2 were localized primarily in the interior (F) or at the plasma membrane (G). Each bin contained four pixels, and the trace was fitted by a biexponential decay (Equation 22, q = 2). The range of fluorescence lifetimes is represented by the color scale below G. A.U., arbitrary units.
Treatment of transfected cells with the agonist carbachol at a concentration of 0.1 mm caused a redistribution of receptors from the membrane to the interior over a period of about 60 min (Fig. 2D). In contrast, there was no change upon the addition of 1 μm N-methylscopolamine. With cells coexpressing eCFP-M2 and Gαqi9, treatment with the agonist oxotremorine-M at a concentration of 10 mm caused a release of intracellular Ca2+, as indicated by a sustained increase in fluorescence from Fluo-4. The effect was blocked when oxotremorine-M was accompanied by N-methylscopolamine at a concentration of 1 μm (Fig. 2E).
Specific binding of the antagonist [3H]quinuclidinylbenzilate to homogenized membranes from CHO cells expressing eGFP-M2 revealed a single class of sites with an apparent affinity of about 30 nm (Fig. 3). Maximal specific binding was 103 pm (s.e. = 4 pm, N = 3) at a protein concentration of 0.07 g/liter, which corresponded to 0.88 × 10⁶ receptors per cell or 1.5 nmol of receptor per g of protein. Cells used for the binding assays were transfected by means of calcium phosphate precipitation; those destined for measurements of FRET were transfected with Lipofectamine 2000, which give higher efficiencies of transfection with less plasmid. The level of expression per cell in the latter therefore was comparable with or less than that in the former.
FIGURE 3.

Binding of [3H]quinuclidinylbenzilate to homogenized membranes from CHO cells expressing eGFP-M2. Total binding was measured at graded concentrations of [3H]quinuclidinylbenzilate alone (upper curve) and in the presence of 1.0 mm N-methylscopolamine (base line). The data were analyzed in terms of the Hill equation, as described previously (i.e. Equation 1 in Ref. 4). The Hill coefficient proved to be indistinguishable from 1 (p = 0.87) and was fixed accordingly in subsequent analyses. The lines represent the best fit of the equation to the data from three experiments (○, □, ▵) taken in concert. A single value of the apparent equilibrium dissociation constant (log K) was common to all of the data; maximal specific binding (Bmax) and nonspecific binding were estimated separately for the data from each experiment. The fitted values of log K and Bmax are −9.50 ± 0.03 and 95–110 pm, respectively. Values plotted on the ordinate have been normalized to the mean value of Bmax (i.e. 103 ± 4 pm).
Determination of Apparent FRET Efficiency from Spectral Analysis
Emission spectra typical of those recorded from CHO cells coexpressing eGFP-M2 and eYFP-M2 are illustrated in Fig. 4A. Stepwise photobleaching of the acceptor caused a diminution of the peak corresponding to the acceptor (eYFP-M2, λmax = 527 nm) and a concomitant enhancement of that corresponding to the donor (eGFP-M2, λmax = 509 nm). Deconvolution of the spectra in Fig. 4A yields the individual spectra for the donor and the acceptor, shown in Fig. 4, B and C, respectively. The effects of photobleaching confirm the presence of FRET between donor- and acceptor-tagged receptors.
FIGURE 4.

Emission spectra from a CHO cell coexpressing eGFP-M2 and eYFP-M2. The observed spectra (A) and the constituent spectra obtained for eGFP-M2 (B) and eYFP-M2 (C) by deconvolution are shown for the cell before photobleaching (j = 0) and after successive bouts of irradiation at 514 nm (j = 1–6). The corresponding values for the relative intensity of the emission from the donor and the acceptor (kDA(j)/kAD(j)) are as follows (j = 0–6): 0.73, 1.10, 1.37, 1.69, 2.10, 2.47, and 3.43. A.U., arbitrary units.
Apparent FRET efficiencies calculated from the values of kDA and kAD obtained from 36 cells at different values of [A]T/[D]T are shown in Fig. 5. Efficiencies estimated from donor-dequenching range from 0.05 to 0.67 if photobleaching of the donor is assumed to be negligible (i.e. kD = kDe in Equation 1) (Fig. 5A) and from 0.11 to 0.70 if the values of kDA(j) are corrected for photobleaching as described under “Experimental Procedures” (i.e. kD = kDec in Equation 1) (Fig. 5C). Similarly, efficiencies estimated from acceptor-sensitized emission range from 0.05 to 1.80 if kD in Equation 2 is taken as kDe (Fig. 5B) and from 0.07 to 1.72 if kD is taken as kDec (Fig. 5D).
FIGURE 5.

Estimation of the pairwise FRET efficiency from the apparent efficiency at different ratios of acceptor to donor. Apparent FRET efficiencies were measured by donor-dequenching (Equation 1, A and C) and by acceptor-sensitized emission (Equation 2, C and D). In each case, the values of Eapp were calculated without regard to photobleaching of the donor (A and B) or adjusted as described under “Experimental Procedures” to compensate for such an effect (C and D). The lines represent the best fit of Equations 10 and 11 to the values of Eappddq and Eappase taken together (A and B, C and D) to yield a single value of E for each value of n listed in the inset to D. The fitted values of E are listed in Table 1.
As defined by Equation 2, Eappase is the donor-dependent increase in the intensity of emission from the acceptor over the intensity that would result from direct excitation of the acceptor alone. A consequence of this definition is that the value of Eappase can exceed 1. It is expected that the rate of direct excitation of donors by incident light was low under the conditions of the experiments; the efficiency of excitation at 458 nm is 62% of that at 488 nm (i.e. λmax for GFP) (37); also, the quantum yield (QD) is 0.64, and the laser was operated at 2.8 milliwatts, or 56% of its maximum power. The direct excitation of acceptors was even lower, however, as the efficiency of excitation at 458 nm is only 9% of that at 514 nm (i.e. λmax for YFP) (37). For cells expressing low levels of acceptor relative to donor, it is likely that most of the acceptor-tagged receptors are in donor-containing complexes and undergo FRET; moreover, the likelihood of such complexes increases with the size of the oligomer. Because the degree to which acceptors are excited directly at 458 nm is low, and because most are in complexes that undergo FRET, the difference between direct excitation and acceptor-sensitized excitation can be large, resulting in values of Eappase greater than 1. This is seen to occur in seven cells when the efficiency is calculated with kDe (Eappase = 1.04–1.80) and in six cells when the efficiency is calculated with kDec (Eappase = 1.05–1.72). The corresponding values of [A]T/[D]T are 0.47–1.83 and 0.75–1.65, respectively.
The various adjustments to kDA (Equation 1) and kAD (Equation 2) compensate for known technical distortions to yield fully corrected estimates of Eappddq and Eappase. Because the latter were measured in parallel for each cell, the ratio can be used to calculate the ratio of total eYFP-M2 to total eGFP-M2 ([A]T/[D]T) according to Equation 16. That value is analogous to the G factor, which relates Eappddq and Eappase in a previously described procedure that also was designed to obtain corrected measures of FRET (41). In the case of ηD and ηA, the corrections adjust for global factors that are determined by the spectral properties of the fluorophores and by instrumental parameters during acquisition of the image. Such factors are expected to be the same from cell to cell, and the mean values of both ηD and ηA are associated with low standard errors. The acquired spectra therefore exhibited the expected consistency and precision over the course of the investigation. That in turn speaks to the fidelity of Eappase and Eappddq as estimates of apparent efficiency.
FRET Efficiency and Oligomeric Size
Apparent FRET efficiencies determined by donor-dequenching and acceptor-sensitized emission at different ratios of acceptor to donor were analyzed in terms of Equations 10 and 11 to obtain estimates of the pairwise FRET efficiency (E) in an oligomer of size n. The values of Eapp and [A]T/[D]T were corrected for photobleaching of the donor or left uncorrected, as described above, and three values of E were obtained for each n as follows: two values from separate analyses of the data from each protocol (i.e. Eappddq and Eappase), and one value from a simultaneous analysis in which E was common to the data from both. The parametric values are listed in Table 1, and the fitted curves are illustrated by the lines in Fig. 5.
TABLE 1.
FRET efficiencies for a single donor-acceptor pair within an oligomer of size n
Estimates of the apparent FRET efficiency at different ratios of acceptor to donor were analyzed in terms of Equations 10 (Eappddq) and 11 (Eappase) to obtain a separate estimate of the pairwise efficiency (E) for each set of data and a single estimate common to both sets. Apparent efficiencies were calculated according to Equations 1 and 2 with a correction for photobleaching of the donor (i.e. kD = kDec) or with no correction (i.e. kD = kDe), as described in the text. The fitted curves obtained with single values of E common to both sets of data are shown in Fig. 5.
| n | Efficiency |
|||||
|---|---|---|---|---|---|---|
| Uncorrected for donor photobleaching |
Corrected for donor photobleaching |
|||||
| From Eappddq | From Eappase | From Eappddq and Eappase | From Eappddq | From Eappase | From Eappddq and Eappase | |
| 2 | 0.365 ± 0.028 | 0.384 ± 0.028 | 0.381 ± 0.019 | 0.465 ± 0.025 | 0.504 ± 0.028 | 0.495 ± 0.019 |
| 3 | 0.212 ± 0.018 | 0.207 ± 0.017 | 0.207 ± 0.012 | 0.283 ± 0.018 | 0.287 ± 0.019 | 0.287 ± 0.013 |
| 4 | 0.149 ± 0.013 | 0.142 ± 0.012 | 0.143 ± 0.009 | 0.204 ± 0.014 | 0.202 ± 0.014 | 0.202 ± 0.010 |
| 6 | 0.094 ± 0.009 | 0.087 ± 0.008 | 0.088 ± 0.005 | 0.131 ± 0.009 | 0.127 ± 0.009 | 0.128 ± 0.006 |
| 8 | 0.068 ± 0.007 | 0.063 ± 0.006 | 0.063 ± 0.004 | 0.096 ± 0.007 | 0.093 ± 0.007 | 0.093 ± 0.005 |
The fits to either Eappddq or Eappase are essentially equivalent at different values of n (Fig. 5). A specific oligomer therefore cannot be identified on the basis of spectral analyses alone, at least with the present data. The model nevertheless gave well defined values of E that range from 38% for a dimer (n = 2) to 6% for an octamer (n = 8) if photobleaching of the donor is disregarded (Table 1 and Fig. 5, A and B); if photobleaching is taken into account, the values range from 50% for a dimer to 9% for an octamer (Table 1 and Fig. 5, C and D). Pairwise efficiencies estimated by donor-dequenching (Eappddq, Equation 10) and acceptor-sensitized emission (Eappase, Equation 11) are in good agreement at all values of n, and there is little effect on the sum of squares if both sets of data are analyzed in concert with a single value of E (p > 0.40).
Oligomeric Homogeneity
Estimates of the pairwise efficiency derived from spectral studies depend in part on the concentrations of donor- and acceptor-tagged monomers, which were taken as zero in the analyses described above (i.e. Equations 10 and 11). To test this assumption, the simultaneous fit of Equations 12 and 13 to both sets of data was mapped with respect to the value of ξ, which was taken as the same for donor and acceptor (i.e. ξD = ξA). The values of Eappddq and Eappase were corrected for photobleaching of the donor, and the two sets of data shared a single value of E. The value of n was taken as 4.
Any value of ξ greater than 0 was accompanied by an increase in the pairwise FRET efficiency and in the sum of squares. The latter is significant (p < 0.05) when 40% or more of the receptors are assumed to exist as monomers (i.e. ξ ≥0.35), and the pairwise FRET efficiency within the oligomer equals or exceeds 38%. If the efficiency is taken as 20% (Table 1, n = 4), the increase is significant when only 9% of the receptors are monomers (i.e. ξ = 0.1). The same trend was observed when the fits to Eappddq (Equation 12) and Eappase (Equation 13) were mapped independently. The data therefore are consistent with the assumption that M2 receptors captured in the confocal images existed wholly as oligomers.
FRET Efficiencies Based on Arbitrary Distances in a Tetramer
Equations 810–13 pre-suppose that the distance between donor and acceptor is the same for all pairs within the oligomer. This is unlikely for oligomers larger than a trimer, and the data from the 36 cells represented in Fig. 5 therefore were evaluated in terms of a tetramer configured as a square and a rhombus (supplemental Fig. S1).
Equations 14 and 15 were fitted simultaneously to the corrected estimates of Eappddq and Eappase (i.e. kD = kDec in Equations 1 and 2) to obtain a single value for the efficiency corresponding to FRET along one side (Es) or, in a separate analysis, to that for FRET across the diagonal (Ed). The fitted curves are essentially superimposable with those obtained with Equations 10 and 11 (cf. Fig. 5, C and D, n = 4), and the fitted values of Es and Ed are as follows: for a square, 0.27 ± 0.01 and 0.044 ± 0.003; for a rhombus, 0.24 ± 0.01 and 0.011 ± 0.001.
FRET from Spurious Interactions
To test for the possibility that FRET arose in a stochastic manner or from dimerization of the tags themselves, the eGFP-tagged M2 receptor was coexpressed with an eYFP-tagged, truncated variant of the Wnt receptor Frizzled-1 (eYFP-trFz1). The M2 receptor contains about 22 residues between the N terminus and the beginning of the first transmembrane domain (42), whereas the corresponding segment of Frizzled-1 contains 315 residues (42). The latter therefore was truncated by 293 residues to ensure that the two fluorophores occupy comparable positions relative to the surface of the membrane.
The effect of successive photobleaching in cells coexpressing eGFP-M2 and either eYFP-M2 or eYFP-trFz1 is illustrated in Fig. 6. With eGFP-M2 and eYFP-M2 (Fig. 6A), fluorescence from the donor increased toward an asymptote that corresponds to a fully bleached population of acceptors; fluorescence from the acceptor decreased toward zero, beginning at an unbleached value that was anomalously high for direct excitation at 458 nm and indicative of FRET (i.e. kAD/kDA(0) ≈ 1). With eGFP-M2 and eYFP-trFz1 (Fig. 6B), fluorescence from the donor was essentially unchanged; fluorescence from the acceptor was comparatively low in unbleached cells (i.e. kAD ≤ 0.2kDA(0)), consistent with a low level of direct excitation at 458 nm, and decreased further upon bleaching at 514 nm.
FIGURE 6.

Comparison of eYFP-M2 and eYFP-trFz1 for their interaction with eGFP-M2. Cells coexpressing either eGFP-M2 and eYFP-M2 (A) or eGFP-M2 and eYFP-trFz1 (B) were photobleached in a stepwise manner. Emission spectra measured before photobleaching and after each successive step were deconvoluted to obtain the values of kDA(j) ( ) and kAD(j) (- - -), which are shown relative to the value kDA(j) for the unbleached cell (i.e. kDA(0)). A value of 1 is indicated by the dotted line. Data from five cells are shown in each panel; the estimates of kDA(j) and kAD(j) from the same cell are presented as paired open (□, ▵, ▿, ○, ◇) and closed symbols (■, ▴, ▾, ●, ♦), respectively.
Low values of kAD and insensitivity to photobleaching indicate a lack of FRET between eGFP-M2 and eYFP-trFz1 (Fig. 6B). The absence of an effect was not due to an insufficient quantity of eYFP-trFz1, which was expressed at levels comparable with eGFP-M2. For the cells represented in Fig. 6B, the ratio of total acceptor ([A]T) to total donor ([D]T) calculated from Equation 17 was 0.91–2.5; also, the ratio of fluorescence intensities at 526–531 nm (eYFP-trFz1) and 508–513 nm (eGFP-M2) upon excitation at 514 and 458 nm, respectively, was 3.0–5.4. For the cells represented in Fig. 6A, the value of [A]T/[D]T from Equation 17 was 0.16–0.39, and the ratio of intensities from eYFP-M2 and eGFP-M2 was 1.8–3.3. The intensity of emission from eGFP-M2 was comparable in the presence of either eYFP-trFz1 or photobleached eYFP-M2. These observations indicate that eGFP-M2, eYFP-M2, and eYFP-trFz1 were expressed at similar levels under all conditions.
Pairwise FRET Efficiency Determined by Fluorescence Lifetime Imaging
The FRET efficiency for a single donor-acceptor pair in cells coexpressing eGFP-M2 and eYFP-M2 was estimated independently from fluorescence lifetimes. Except as described below, cells were selected in which the fluorophores were located predominantly at the plasma membrane (Fig. 2G). A single exponential was used to describe the traces from cells expressing eGFP-M2 (Fig. 7A) or eYFP-M2 alone. The fit was not improved with two exponentials rather than one (p > 0.05) in tests of data from individual pixels selected at random from across the image. With cells coexpressing eGFP-M2 and eYFP-M2 (Fig. 7B), the fit to the data from selected pixels generally was better with two exponentials (p < 0.05) and improved only marginally upon the addition of a third.
FIGURE 7.

Decay of fluorescence from donor-transfected and cotransfected cells. The loss of fluorescence over time is shown for 1 bin from the image of a cell expressing eGFP-M2 alone (A) and a cell coexpressing eGFP-M2 and eYFP-M2 (B). Each bin included four pixels, and the lines represent the best fit of a mono- (A) or a biexponential (B) to the data (i.e. Equation 22 with q = 1 or 2).
In the case of cells expressing eGFP-M2 alone, the values of τ obtained by fitting a single exponential gave distributions that are well described by a single gaussian (Fig. 8A). Estimates of τ0,1 from individual cells varied from 2.10 to 2.54 ns (Equation 23), and the mean value from all such cells is 2.27 ± 0.02 ns (N = 42). The initial intensity of fluorescence was virtually unchanged over the course of the FLIM measurements, which typically were 480 s in duration. With cells expressing eYFP-M2 alone, the distributions of τ from a single exponential were described by a single gaussian (Fig. 8B) to yield a mean value for τ0,1 of 3.00 ± 0.01 ns (N = 16 cells).
FIGURE 8.

Distribution of fluorescence lifetimes in transfected cells. The distribution in each panel includes all values of τj obtained by fitting Equation 22 (q = 1–3) to the decay from a cell expressing eGFP-M2 alone (A, q = 1), eYFP-M2 alone (B, q = 1), and eGFP-M2 plus eYFP-M2 (C, q = 2; D, q = 3). The data shown in C and D are from the same cell. The solid lines represent the best fit of a sum of gaussians (Equation 23, q = 1 or 3), and the parametric values are as follows: (A, q = 1) τ0,1 = 2.301 ± 0.003 ns, σ1 = 0.231 ± 0.003 ns, and A1 = 182 ± 2; (B, q = 1) τ0,1 = 3.014 ± 0.008 ns, σ1 = 0.437 ± 0.008 ns, A1 = 162 ± 3; (C, q = 3) τ0,1 = 1.90 ± 0.16 ns, τ0,2 = 2.43 ± 0.02 ns, τ0,3 = 2.83 ± 0.35 ns, σ1 = 0.27 ± 0.11 ns, σ2 = 0.20 ± 0.03 ns, σ3 = 0.44 ± 0.19 ns, A1 = 17 ± 10, A2 = 94 ± 26, A3 = 29 ± 9; (D, q = 3) τ0,1 = 1.79 ± 0.02 ns, τ0,2 = 2.38 ± 0.01 ns, τ0,3 = 3.01 ± 0.05 ns, σ1 = 0.50 ± 0.01 ns, σ2 = 0.20 ± 0.02 ns, σ3 = 0.42 ± 0.03 ns, A1 = 27 ± 3, A2 = 73 ± 1, and A3 = 69 ± 3. The dashed lines show the individual components when q = 3.
Of 55 cells coexpressing eGFP-M2 and eYFP-M2, three resembled those expressing eGFP-M2 alone and appeared not to exhibit FRET. The traces from the other 52 cells were fitted initially by a biexponential, and the distributions of lifetimes were analyzed as a sum of two gaussians to obtain the mean values of τ0,1 and τ0,2 listed in Table 2, line A (Equation 23, q = 2). With 38 of those cells, the sum of squares was significantly lower when the distribution was described by three gaussians rather than two (p < 0.05), as illustrated for one such cell in Fig. 8C. In most cases, the third lifetime was somewhat longer than either of those obtained with two gaussians. The mean values of τ0,j listed in Table 2, line B, were calculated from the individual estimates of τ0,1 and τ0,2 (14 cells, Equation 23, q = 2) or of τ0,1, τ0,2, and τ0,3 (38 cells, Equation 23, q = 3), as appropriate.
TABLE 2.
Lifetimes and FRET efficiencies estimated by means of FLIM for complexes at the plasma membrane
Fluorescence was monitored from 52 cells in which eGFP-M2 and eYFP-M2 were localized predominantly at the plasma membrane. The traces from binned pixels were analyzed in terms of two or three exponentials (Equation 22), and the resulting distribution of lifetimes from each cell was analyzed as a sum of gaussians (Equation 23). Lifetimes from two exponentials were described by two gaussians throughout (line A) or by either two or three gaussians (line B), as determined by the F-statistic. Lifetimes from three exponentials were described by three gaussians (line C). The estimates of τ0,j from individual cells were averaged to obtain the means (±S.E.) listed in the table, where τ0,1, τ0,2, and τ0,3 correspond to τDA, τD, and τA, respectively. The number of traces is shown in parentheses. Efficiencies were calculated from τDA and τD for each cell (Equation 24), and the individual values were averaged to obtain the means (±S.E.) listed in the table.
| q (Equation 22) | q (Equation 23) | Lifetime |
Efficiency (Equation 24) | |||
|---|---|---|---|---|---|---|
| τ0,1 (τDA) | τ0,2 (τD) | τ0,3 (τA) | ||||
| ns | ns | ns | ||||
| A | 2 | 2 (52) | 2.01 ± 0.04 (52) | 2.55 ± 0.03 (52) | 0.21 ± 0.02 | |
| B | 2 | 2 (14) | 1.94 ± 0.03 (52) | 2.41 ± 0.01 (52) | 2.83 ± 0.04 (38) | 0.20 ± 0.01 |
| 3 (38) | ||||||
| C | 3 | 3 (52) | 1.79 ± 0.04 (52) | 2.35 ± 0.02 (52) | 3.00 ± 0.09 (38) | 0.24 ± 0.02 |
A mismatch between the number of exponentials and the modality of the distribution implies that two processes are insufficient to describe the decay across all pixels; rather, such cells appear to reveal a third and generally slower process that is disregarded when the traces are analyzed in terms of two exponentials. The data from all cells therefore were analyzed in terms of three exponentials to yield distributions that generally were trimodal (Fig. 8D). They in turn were analyzed in terms of three gaussians to yield the mean values of τ0,j listed in Table 2, line C.
Similar estimates of τ0,j were obtained from the three approaches described above (Table 2). The values in Table 2, line A, are somewhat larger than the corresponding values in Table 2, lines B and C, as expected if three rates of decay were approximated by two rates in some cases. The addition of a third gaussian to describe the distributions obtained with the lifetimes from two exponentials in 73% of the cells is supported by the manifestly trimodal distributions obtained with the lifetimes from three exponentials, notwithstanding the uncertainty associated with the latter values.
The intermediate lifetime from the fits of three gaussians (τ0,2) agrees with the lifetime measured for eGFP-M2 expressed alone (2.27 ns), and it therefore has been taken to represent fluorescence from unquenched eGFP-M2 (τD). The shorter lifetime (τ0,1) can be attributed to the quenching of eGFP-M2 by eYFP-M2 through FRET (τDA). The longer lifetime (τ0,3) agrees with that measured for eYFP-M2 expressed alone (3.00 ns) and presumably represents the decay of fluorescence induced in the acceptor via FRET (τA).
Substituted into Equation 24, the values of τDA and τD listed in Table 2 yield FRET efficiencies of 0.20–0.24. If the value of 0.20 is used to compute the apparent efficiencies according to Equations 10 and 11 with no correction for photobleaching of the donor (i.e. kD = kDe in Equations 1 and 2), the resulting curves are nearly superimposable with the fitted curves computed for a trimer (Fig. 9, A and B); when photobleaching of the donor is taken into account (i.e. kD = kDec in Equations 1 and 2), the resulting curves overlay those computed for a tetramer (Fig. 9, C and D).
FIGURE 9.

Pairwise efficiency and oligomeric size from spectral analyses and FLIM. Estimates of the apparent FRET efficiency (○) were calculated according to Equation 1 (Eappddq) or Equation 2 (Eappase); the emission from the donor in the absence of acceptor was not adjusted for photobleaching of the donor (kD = kDe) (A and B) or was corrected as described under “Experimental Procedures” (kD = kDec) (C and D). The dashed lines were calculated according to Equation 10 (A and C) or Equation 11 (B and D) with the value of E taken as 0.20; the value of n was as follows: a, 2; b, 3; d, 4; e, 6. The solid lines (c) represent the best fit of Equation 10 or 11 with n taken as 3 (A and B) or 4 (C and D). Inset to B and D: fitted values of E derived from the simultaneous analysis of Eappddq and Eappase in terms of Equation 10 or 11 at different values of n (□) are compared with the value of E calculated from τDA and τD according to Equation 22 (arrows, E = 0.20).
Cells occasionally appeared in which localization of the receptor was predominantly intracellular (Fig. 2F). Nineteen such cells were examined by means of FLIM, and the pattern that emerged resembles that described above for images in which the signal was located predominantly at the plasma membrane. The data were analyzed in the same manner, and 15 of the 19 cells required three gaussians rather than two to describe the distributions of lifetimes obtained by fitting two exponentials to the kinetic traces (p < 0.05).
The mean lifetimes from the fits of Equation 23 to the distributions from individual cells are listed in Table 3. All modes of analysis yield values similar to those obtained for receptors at the plasma membrane (cf. Table 2), and the three lifetimes were identified accordingly as τDA, τD, and τA. Similar agreement emerges for the corresponding efficiencies, which range from 0.17 to 0.23 (Table 3). These similarities suggest that the oligomeric status of most receptors is the same throughout the cell.
TABLE 3.
Lifetimes and FRET efficiencies estimated by means of FLIM for internal complexes
Fluorescence was monitored from 19 cells in which the localization of eGFP-M2 and eYFP-M2 was predominantly internal. The traces from binned pixels were analyzed in terms of Equations 22 and 23 as described in the legend to Table 2. Distributions of lifetimes from two exponentials (Equation 22, q = 2) required two gaussians for 4 cells and three gaussians for 19 cells (Equation 23, n = 2 or 3). Efficiencies were calculated from τDA and τD for each cell (Equation 24), and the individual values were averaged to obtain the means (±S.E.) listed in the table.
| q (Equation 22) | q (Equation 23) | Lifetime |
Efficiency (Equation 24) | |||
|---|---|---|---|---|---|---|
| τ0,1 (τDA) | τ0,2 (τD) | τ0,3 (τA) | ||||
| ns | ns | ns | ||||
| A | 2 | 2 (19) | 2.15 ± 0.08 (19) | 2.78 ± 0.09 (19) | 0.23 ± 0.04 | |
| B | 2 | 2 (4) | 2.02 ± 0.07 (19) | 2.44 ± 0.03 (19) | 2.98 ± 0.10 (15) | 0.17 ± 0.03 |
| 3 (15) | ||||||
| C | 3 | 3 (19) | 2.08 ± 0.09 (19) | 2.55 ± 0.09 (19) | 3.17 ± 0.12 (15) | 0.18 ± 0.05 |
DISCUSSION
Fluorescence resonance energy transfer has been used to characterize oligomers of the M2 muscarinic receptor in the plasma membrane of CHO cells. The approach was based on two complementary procedures for measuring the FRET efficiency between a single donor and a single acceptor, in this case eGFP and eYFP. In the first, the apparent efficiency was estimated from the emission spectrum by means of donor-dequenching (Eappddq) and acceptor-sensitized emission (Eappase) at different ratios of eYFP-M2 to eGFP-M2; the pairwise FRET efficiency then was inferred in terms of a model that accounts for all combinatorial possibilities within an oligomer of specified size (n). In the second procedure, E or a close approximation thereof was estimated directly from fluorescence lifetimes. The spectral analyses delivered a set of essentially equivalent fits relating the pairwise efficiency and n, and the appropriate value of n was identified by the efficiency calculated from lifetimes.
The oligomeric size that emerges from this approach depends upon the degree to which the donor is photobleached under the conditions used to bleach the acceptor. If eGFP is unaffected, the efficiency of 0.20 calculated from fluorescence lifetimes corresponds to a trimer according to the spectral analyses (Fig. 9B, inset). If the donor in cotransfected cells is bleached at the rate of eGFP-M2 expressed alone, the efficiency from lifetimes corresponds to a tetramer (Fig. 9D, inset). In neither case is the efficiency determined by FLIM consistent with that inferred for a dimer on the basis of the spectral analyses (Fig. 9). Were the fluorophores to adopt orientations that differ in their pairwise FRET efficiency and interconvert slowly on the time scale of the assays, static averaging over the entire population would cause the measured efficiency to be somewhat less than that obtained if all were in the optimal conformation. Because the magnitude of such an effect is likely to be comparable for both estimates of E, comparisons such as those in Fig. 9 would yield the same oligomeric size.
In a previous study of coexpressed eGFP and eYFP, bleaching of the acceptor did not require irradiation at 514 nm; rather, the acquisition of successive spectra upon excitation at 476 nm was sufficient in itself to reduce the signal from eYFP (43). Emission from the donor was unaffected during the early steps but subsequently declined with bleaching of the acceptor. It was concluded that the donor is protected from photobleaching while engaged in FRET.
In this study, the acceptor was photobleached by irradiation at 514 nm, which corresponds to λmax for the excitation of eYFP. If most of the acceptors are excited under such conditions, few will be in an electronic state to accept energy from the small fraction of donors that also are excited. The protection otherwise provided by FRET thereby is reduced, and the donor is susceptible to photobleaching. Donors within oligomers that were formed without acceptors or have lost acceptors through bleaching also will be vulnerable, and the latter population will increase with each successive round of irradiation at 514 nm. Similarly, donors in acceptor-deficient oligomers will be vulnerable to irradiation at 458 in the manner of those that were sensitive to irradiation at 476 nm (43). Results from a recent study in which eGFP- and eYFP-tagged constructs were examined under similar conditions also indicate that eGFP is sensitive to photobleaching at 514 nm (44).
These considerations suggest that a population of donors coexpressed with acceptors will be photobleached at a rate similar to that measured in cells expressing eGFP-M2 alone. Among those FRET efficiencies that incorporate the correction for photobleaching of the donor (Table 1), the value of 0.202 agrees most closely with the efficiency of 0.20–0.24 determined by FLIM, identifying the oligomer as a tetramer. The measured values of Eappddq and Eappase differ markedly from the values computed according to the model with the pairwise efficiency taken as 0.20 and the value of n taken as either two or six (Fig. 9, C and D).
Estimates of the pairwise efficiency obtained from spectral analyses and fluorescence lifetimes are determined by the physical properties of the fluorophores, and they are unaffected by variables that are inaccessible or difficult to measure. The process of spectral deconvolution that yields the values of Eapp and [A]T/[D]T required by Equations 10 and 11 pre-supposes only that the spectrum from a cotransfected cell is the sum of the spectra that would be obtained from cells transfected with eGFP-M2 or eYFP-M2 alone. Similarly, efficiencies calculated from fluorescence lifetimes are independent of the various factors that determine the amplitude of the signal.
In this study, the dependence of apparent efficiency on the ratio of acceptor to donor was not in itself sufficient to define both the pairwise FRET efficiency and the size of the oligomer. That ambiguity was resolved by estimating the value of E independently from fluorescence lifetimes, but the model may be able to pinpoint a specific oligomeric size under some conditions. Simulations based on Equations 10 and 11 indicate that the effect of n on the predicted dependence of Eapp on [A]T/[D]T varies with the value of E. The differences are small at the values of E found for the M2 receptor (i.e. ≤50%), but they ought to be discernible at values near 80%. Efficiencies of that magnitude are not improbable; for example, the judicious placement of small fluorescent probes such as FlAsH and Texas Red can yield highly efficient FRET pairs (45).
It is assumed in Equations 10 and 11 that monomers are nonexistent and that all oligomers are of the same size. The first assumption is supported by the observation that the fit to Eappddq and Eappase is compromised when the fraction of receptors in the monomeric state exceeds zero (Equations 12 and 13), and it is consistent with reports that oligomerization is a prerequisite for transport to the plasma membrane (46). The notion of oligomeric homogeneity remains untested, although it is consistent with other data as described below. It also is supported by internal consistency within the results of the present analyses. At each value of n, there is good agreement between the values of E obtained by donor-dequenching and acceptor-sensitized emission; moreover, the values of E when n is 4 are in good agreement with the efficiency estimated from lifetimes. If the oligomer serves a specific functional role, the required properties may depend upon a specific size that is achieved during biosynthesis and determined wholly or in part by factors intrinsic to a monomer (4).
The model also assumes that the distance between donor and acceptor is the same for all pairs within an oligomer of given size. This is likely to be true for a dimer and perhaps for a trimer, where structures can be envisaged in which all pathways for the transfer of energy are equivalent or nearly so. It cannot be true for a tetramer, where the simplest possible arrangement is a square or rhombus in which FRET could occur across the diagonal or along the side. In such a case, the value of 0.202 estimated for E in terms of Equations 10 and 11 is an average of the efficiencies for the transfer of energy along all pathways within the complex. Such averaging washes out information regarding the relative disposition of constituent protomers. Size is the parameter of interest here, however, and that information is available for tetramers and larger oligomers as long as the proportion of donors and acceptors obeys the binomial distribution. Similar averaging occurs in the estimation of τDA via FLIM, as described below and in the supplemental material. It follows that FRET efficiencies calculated from lifetimes can be compared with those inferred from the spectral data at all values of n.
To examine the effect of averaging in the case of a tetramer, the value of E from Equations 10 and 11 was compared with the values of Es and Ed for the arbitrary distances that might exist in a square and a rhombus (supplemental Fig. S1, Equations S9 and S11). In the rhombus under consideration here, the short diagonal is equal in length to a side. It follows that there are proportionately fewer such pathways in a square, and the fitted value obtained for Es in a square (Es = 0.27, supplemental Equation S9) therefore exceeds that in a rhombus (Es = 0.24, supplemental Equation S11). Although the distance along a side is the same in both arrangements, the diagonal of a square is shorter than the long diagonal of a rhombus (supplemental Fig. S1); accordingly, the efficiency corresponding to FRET across the diagonal also is larger in a square (Ed = 0.044) than in a rhombus (Ed = 0.011). As expected, the two efficiencies based on arbitrary distances in either form of tetramer bracket the average efficiency from Equations 10 and 11. Neither value of Es approaches the fitted value of E for a dimer (i.e. 0.50, Table 1), in which the assumption of equal distances presumably is valid.
A similar analysis of fluorescence decay in terms of arbitrary distances is precluded by the number of lifetimes predicted by the model. An approach analogous to that taken for the spectral data gives five linked lifetimes for the transfer of energy via FRET in a square and six such lifetimes in a rhombus (supplemental Table S3 and Equations S18 and S19). With the inclusion of τD and τA, an explicit description of the system would require a total of seven and eight lifetimes, respectively. Such a large number of exponential terms exceeds the capacity of the data and would seem to limit the degree to which oligomeric size can be assessed on the basis of lifetimes alone. An assessment of size also requires information on the ratio of acceptors to donors, which is not readily available from FLIM.
The several values of τDA,j predicted for a tetramer (supplemental Equations S18 and S19) suggest that the measured values listed in Table 2 are weighted means. Although microscopic lifetimes cannot be extracted from the data, the known relationships among the different τDA,j and the expected occurrence of each in a square and a rhombus allow values to be calculated such that the weighted means equal those measured experimentally. Because the lifetimes for each pathway are known in a simulation, the efficiency can be calculated for FRET along a side of the tetramer (Es) and across the diagonal (Ed). If donors and acceptors are expressed at the same level, the calculated efficiencies for a square are 0.19–0.22 and 0.026–0.033, respectively; the corresponding efficiencies for a rhombus are 0.15–0.19 and 0.0066–0.0086 (supplemental Table S5). These values agree to at least a first approximation with those inferred from the spectral data for a square (Es = 0.27 and Ed = 0.044) and a rhombus (Es = 0.24 and Ed = 0.011), in accord with the agreement obtained when all distances are assumed to be equal (Fig. 5, C and D).
Fusion of eGFP and eYFP at the N terminus allowed for control of the pH, which affects the spectral properties of the fluorophore (23). The modification had no discernible effect on transport of the receptor to the plasma membrane, as indicated by the localization of the fluorophore, its internalization in the presence of agonist, and its colocalization with a Cy3-conjugated antibody specific for an anti-eGFP antibody. There also was no discernible effect on functionality, including the ability to signal. The tag did not affect the binding of antagonists nor did it prevent agonist-initiated internalization, as noted above, or the activation of G proteins linked to the release of intracellular Ca2+. Similar additions to the N terminus of the M1 muscarinic receptor were without effect on the ligand-binding properties or the agonist-induced release of intracellular calcium in HEK 293 cells (22).
Fluorophore-tagged M2 receptors in CHO cells were expressed at levels comparable with those in native tissues. The estimated density of 0.88 × 10⁶ receptors per cell is about one-half of the density reported for intact cardiomyocytes from rat atria. The latter value is 1.7 × 10⁶ receptors per cell (47), which may be an underestimate. It was determined from the binding of N-[3H]methylscopolamine, which presumably labeled only those receptors that were located at the plasma membrane. Also, N-[3H]methylscopolamine has been shown to exhibit, under some conditions, a shortfall in capacity that cannot be attributed to sites localized in a hydrophobic compartment (4, 20). If the capacity for [3H]quinuclidinylbenzilate is stated relative to total protein, the present value of about 1.5 nmol/g compares favorably with values of 3–5 nmol/g that have been reported previously for the M2 receptor in sarcolemmal membranes (48–50). These considerations suggest that the oligomeric status of the receptor in CHO cells is not an artifact of overexpression.
No FRET was observed between eGFP-M2 and eYFP-trFz1, which was engineered to resemble eYFP-M2 with respect to the placement of the fluorophore. It follows that eGFP-M2 and eYFP-trFz1 do not interact at levels of expression that lead to FRET in the case of eGFP-M2 and eYFP-M2, although the possibility that eGFP-M2 and eYFP-trFz1 form a dark complex in which the dipole of eGFP is perpendicular to that of eYFP cannot be ruled out. The present result is consistent with reports that the M2 receptor does not coprecipitate with Frizzled-1 (51) or exhibit BRET when coexpressed with the Smoothened receptor, a homologue of Frizzled-1 (14). Heterologous expression was driven by the cytomegalovirus promoter in the latter investigation (14) and in the experiments described here. These results suggest that the association between eGFP-M2 and eYFP-M2 is specific; they argue against the alternative possibility of stochastic interactions and suggest that it is difficult to populate the membrane at a level sufficient for such effects. Dimerization via the fluorophore was prevented by the substitution of lysine for alanine at position 206 in all constructs (26).
The present evidence for a tetramer is consistent with the results of earlier studies in which the oligomeric size of the M2 receptor has been measured directly or inferred from functional properties. Muscarinic receptors purified from porcine sarcolemma and examined by electrophoresis were found to migrate as a mixture of monomers and oligomers, including an apparent tetramer (18). A complex containing c-Myc-, hemagglutinin-, and FLAG-tagged M2 receptors has been purified from triply infected Sf9 cells, and the amount of the tri-labeled species was sufficient to suggest that it was larger than a trimer (5). M2 receptors also can be purified from Sf9 cells as monomers that regroup almost exclusively as tetramers upon reconstitution in phospholipid vesicles (4).
Functional studies on the M2 receptor in native preparations and after reconstitution as a tetramer have revealed noncompetitive effects in the binding of muscarinic antagonists, and the pattern can be described quantitatively in terms of cooperative interactions among at least four sites (4, 18–20). Cooperativity indicative of a tetramer also has been reported for the binding of the agonist oxotremorine-M to the muscarinic receptor purified from porcine atria (18). Similarly, the guanyl nucleotide-sensitive dispersion of affinities revealed by agonists at the M2 receptor in myocardial membranes (49, 52, 53) and reconstituted preparations (4, 54, 55) can be described in terms of cooperativity among at least four interacting sites (4, 53). In that context, the effects of guanyl nucleotides emerge as a shift in the distribution of the supposed tetramer between two states that differ in their cooperative properties and perhaps in their degree of asymmetry (4, 53).
Recent evidence suggests that larger oligomers may be common among GPCRs. A complex containing at least four copies of the D2 dopamine receptor was detected by resonance energy transfer when both the donor and the acceptor were formed by bimolecular fluorescence complementation (8). Trimers or larger oligomers of the α1B-adrenergic (6), CB1-cannabinoid (7), and A2A-adenosine receptors (7) have been identified by means of sequential energy transfer among three luminescent or fluorescent probes. Similarly, combinations of bimolecular fluorescence complementation with either BRET (9) or FRET (11) have been used to demonstrate that the adenosine A2A receptor can be at least trimeric. The retention sequence that prevents surface expression of the GABAB1 receptor has been exploited to demonstrate that tetramers of the GABAB1 and GABAB2 receptors can be formed as a dimer of heterodimers (10). FRET efficiencies determined by means of spectral deconvolution at the level of single pixels have suggested that the Ste2p receptor forms tetramers in yeast (56). In the case of rhodopsin, atomic force microscopy has identified what appear to be extended rows of dimers in some preparations of native tissue (57).
The present results differ from those of most previous attempts to estimate the oligomeric size of a GPCR from resonance energy transfer by varying the complement of fluorophores. Measurements of BRET at different ratios of acceptor to donor (13, 14), or at different ratios of the BRET pair to the wild-type receptor (12), have led to the conclusion that the MT1 and MT2 melatonin receptors (12), the β1- and β2-adrenergic receptors (13), and the M1, M2, and M3 muscarinic receptors (14) all form dimers when expressed in HEK 293 cells. A study employing photobleaching FRET with the neurotensin receptor reconstituted into phospholipid vesicles also concluded that the receptors form dimers (15). An exception to this trend has been the purified β2-adrenergic receptor, which emerged as a tetramer when labeled with cysteine-reactive fluorophores and monitored for FRET efficiency upon reconstitution at different ratios of acceptor to donor (58).
Such differences may relate in part to differences between receptors in whole cells and after reconstitution, although there is no evident correlation between the nature of the preparation and the oligomeric size inferred from the model. They also may arise from differences in the models themselves. Estimates of n in the earlier studies of GPCRs (12–15, 58) were based on a scheme introduced for gramicidin (16), which incorporates the approximation that the apparent efficiency of energy transfer can be obtained as the product of the pairwise efficiency and the fraction of interacting donors. That assumption is valid only for dimers; in the case of larger oligomers, it disregards the existence of multiple pathways for the de-excitation of donors and for the excitation of acceptors (17). Such quasi-parallel pathways have been accommodated in the present analyses by the summation in Equations 810–13 and the corresponding terms in supplemental Equations S8–S11.
The earlier model also pre-supposes that monomers and oligomers coexist in a dynamic equilibrium, and the equations derived to account for FRET between dansyl- and 4-(diethylamino)phenylazobenzene-4-sulfonylgramicidin incorporate two related assumptions, namely that the concentrations are sufficient to preclude appreciable levels of monomers and that the affinity of heterodimerization is the geometric mean of the affinities of homodimerization (16). Deviations from the latter assumption were shown to affect the relative quantum yield in a manner akin to differences in the oligomeric size (16).
Although it is implicit in the present model that the complex is stable, the degree and prevalence of oligomeric stability among GPCRs remain unclear. Data that address such questions are contradictory and often ambiguous. Stability observed under some conditions may bespeak a nonphysiological state. What appears in some assays as the dissociation of a transient complex may be a conformational change, or dissociated monomers may reassociate rather than exchange with others in the bulk space.
A comparatively high degree of stability is implied by the widespread observation that differently tagged receptors can be coimmunoprecipitated from detergent-solubilized preparations (1, 2, 59). In some cases, including the M2 receptor, receptor-specific ligands have been shown to affect neither the degree of coimmunoprecipitation (59, 60, 73) nor the magnitude of BRET (13) or FRET (59) between tagged protomers. Solubilized M2 receptors also can exhibit noncompetitive interactions among antagonists acting at the orthosteric site (20, 61). With D2 dopamine receptors expressed in HEK 293 cells, neither the quantities of cross-linked oligomers detected on Western blots nor the rate of cross-linking was affected by the level of expression (8). It now appears that oligomers of GPCRs are assembled early on during biosynthesis and trafficked intact to the plasma membrane (62, 63), in agreement with the notion of a preformed and stable complex.
Recent evidence for transient complexes has included differences in fluorescence recovery after photobleaching between fluorophore-tagged forms of the β1- and β2-adrenergic receptors expressed in live HEK 293T cells (64). The differences were attributed to a difference in the stability of the complex; the β1 complex was found to be transient, whereas the β2 complex appeared to be stable. Also, the recovery of fluorescence was unaffected by isoproterenol or propranolol (64). The tetramers of Cy3- and Cy5-tagged β2-adrenergic receptors that were identified upon reconstitution of the purified receptor in phospholipid vesicles exhibited an increase in FRET efficiency in the presence of the inverse agonist carazolol, suggesting the formation of larger aggregates such as octamers (58). In the case of oligomers formed by the D2 dopamine receptor, measurements of fluorescence recovery after photobleaching have suggested that at least one interface is sufficiently unstable that immobilized protomers do not affect the mobility of others (65). If oligomers of the M2 receptor indeed dissociate and reassociate in a spontaneous manner, the failure to detect monomers in the context of the present model suggests that the system exists predominantly in the oligomeric state.
Reconstituted monomers of the β2-adrenergic receptor (66), the μ-opioid receptor (67), and rhodopsin (68, 69) have been shown to activate G proteins. Oligomers therefore are not essential for communication between a GPCR and an attendant α-subunit, at least under those conditions, yet noncompetitive effects among antagonists at the M2 receptor imply that the tetramers identified here and elsewhere serve a functional purpose. Moreover, the characteristic but enigmatic binding patterns revealed by agonists at the M2 muscarinic receptor can be described in terms of cooperativity among four interacting sites while resisting other explanations (4, 53, 70). Inasmuch as those patterns are a measure of efficacy (71, 72), tetramers may play a role in signaling per se (4, 53).
Supplementary Material
Acknowledgments
We thank Hanaan Rosenthal for assistance with the program used for spectral deconvolution and Natalie Lavine for helpful discussions. We also thank Dr. David R. Hampson for the plasmid coding for Gαi9 and Sujeenthar Tharmalingam for help with the assay for the release of Ca2+.
This work was supported in part by the Canadian Institutes of Health Research Grants MOP 43990 and MOP 97978 (to J. W. W.), the Heart and Stroke Foundation of Ontario Grants T5650 and T6280 (to J. W. W.), the University of Wisconsin-Milwaukee Research Growth Initiative (to V. R.), and the Wisconsin Institute for Biomedical and Health Technologies (to V. R.).

The on-line version of this article (available at http://www.jbc.org) contains supplemental text, equations, Fig. S1, Tables S1–S5, and additional references.
- GPCR
- G protein-coupled receptor
- BRET
- bioluminescence resonance energy transfer
- CHO
- Chinese hamster ovary
- Cy3
- indocarbocyanine
- eGFP
- enhanced green fluorescent protein
- eYFP
- enhanced yellow fluorescent protein
- eCFP
- enhanced cyan fluorescent protein
- eGFP-M2
- eYFP-M2, and eCFP-M2, fluorophore-tagged M2 muscarinic receptors
- FRET
- fluorescence (Förster) resonance energy transfer
- r
- rat
- FLIM
- fluorescence lifetime imaging
- GABA
- γ-aminobutyric acid
- PBS
- phosphate-buffered saline
- trFz1
- truncated rat Wnt receptor Frizzled-1
- dansyl
- 5-dimethylaminonaphthalene-1-sulfonyl.
REFERENCES
- 1.Angers S., Salahpour A., Bouvier M. (2002) Annu. Rev. Pharmacol. Toxicol. 42, 409–435 [DOI] [PubMed] [Google Scholar]
- 2.Bai M. (2004) Cell. Signal. 16, 175–186 [DOI] [PubMed] [Google Scholar]
- 3.Harrison C., van der Graaf P. H. (2006) J. Pharmacol. Toxicol. Methods 54, 26–35 [DOI] [PubMed] [Google Scholar]
- 4.Ma A. W., Redka D. S., Pisterzi L. F., Angers S., Wells J. W. (2007) Biochemistry 46, 7907–7927 [DOI] [PubMed] [Google Scholar]
- 5.Park P. S., Wells J. W. (2004) J. Neurochem. 90, 537–548 [DOI] [PubMed] [Google Scholar]
- 6.Lopez-Gimenez J. F., Canals M., Pediani J. D., Milligan G. (2007) Mol. Pharmacol. 71, 1015–1029 [DOI] [PubMed] [Google Scholar]
- 7.Carriba P., Navarro G., Ciruela F., Ferré S., Casadó V., Agnati L., Cortés A., Mallol J., Fuxe K., Canela E. I., Lluís C., Franco R. (2008) Nat. Methods 5, 727–733 [DOI] [PubMed] [Google Scholar]
- 8.Guo W., Urizar E., Kralikova M., Mobarec J. C., Shi L., Filizola M., Javitch J. A. (2008) EMBO J. 27, 2293–2304 [DOI] [PMC free article] [PubMed] [Google Scholar]
- 9.Gandia J., Galino J., Amaral O. B., Soriano A., Lluís C., Franco R., Ciruela F. (2008) FEBS Lett. 582, 2979–2984 [DOI] [PubMed] [Google Scholar]
- 10.Maurel D., Comps-Agrar L., Brock C., Rives M. L., Bourrier E., Ayoub M. A., Bazin H., Tinel N., Durroux T., Prézeau L., Trinquet E., Pin J. P. (2008) Nat. Methods 5, 561–567 [DOI] [PMC free article] [PubMed] [Google Scholar]
- 11.Vidi P. A., Chen J., Irudayaraj J. M., Watts V. J. (2008) FEBS Lett. 582, 3985–3990 [DOI] [PubMed] [Google Scholar]
- 12.Ayoub M. A., Couturier C., Lucas-Meunier E., Angers S., Fossier P., Bouvier M., Jockers R. (2002) J. Biol. Chem. 277, 21522–21528 [DOI] [PubMed] [Google Scholar]
- 13.Mercier J. F., Salahpour A., Angers S., Breit A., Bouvier M. (2002) J. Biol. Chem. 277, 44925–44931 [DOI] [PubMed] [Google Scholar]
- 14.Goin J. C., Nathanson N. M. (2006) J. Biol. Chem. 281, 5416–5425 [DOI] [PubMed] [Google Scholar]
- 15.Harding P. J., Attrill H., Boehringer J., Ross S., Wadhams G. H., Smith E., Armitage J. P., Watts A. (2009) Biophys. J. 96, 964–973 [DOI] [PMC free article] [PubMed] [Google Scholar]
- 16.Veatch W., Stryer L. (1977) J. Mol. Biol. 113, 89–102 [DOI] [PubMed] [Google Scholar]
- 17.Raicu V. (2007) J. Biol. Phys. 33, 109–127 [DOI] [PMC free article] [PubMed] [Google Scholar]
- 18.Wreggett K. A., Wells J. W. (1995) J. Biol. Chem. 270, 22488–22499 [DOI] [PubMed] [Google Scholar]
- 19.Colozo A. T., Park P. S., Sum C. S., Pisterzi L. F., Wells J. W. (2007) Biochem. Pharmacol. 74, 236–255 [DOI] [PubMed] [Google Scholar]
- 20.Park P. S., Sum C. S., Pawagi A. B., Wells J. W. (2002) Biochemistry 41, 5588–5604 [DOI] [PubMed] [Google Scholar]
- 21.Pisterzi L. F., Jansma D. B., Georgiou J., Woodside M. J., Chou J. T., Angers S., Raicu V., Wells J. W. (2009) Biophys. J. 96, 169a. [DOI] [PMC free article] [PubMed] [Google Scholar]
- 22.Weill C., Galzi J. L., Chasserot-Golaz S., Goeldner M., Ilien B. (1999) J. Neurochem. 73, 791–801 [DOI] [PubMed] [Google Scholar]
- 23.Tsien R. Y. (1998) Annu. Rev. Biochem. 67, 509–544 [DOI] [PubMed] [Google Scholar]
- 24.Heim R. (1999) Methods Enzymol. 302, 408–423 [DOI] [PubMed] [Google Scholar]
- 25.Lippincott-Schwartz J., Patterson G. H. (2003) Science 300, 87–91 [DOI] [PubMed] [Google Scholar]
- 26.Zacharias D. A., Violin J. D., Newton A. C., Tsien R. Y. (2002) Science 296, 913–916 [DOI] [PubMed] [Google Scholar]
- 27.Raymond C. K., Sims E. H., Olson M. V. (2002) Genome Res. 12, 190–197 [DOI] [PMC free article] [PubMed] [Google Scholar]
- 28.Yang-Snyder J., Miller J. R., Brown J. D., Lai C. J., Moon R. T. (1996) Curr. Biol. 6, 1302–1306 [DOI] [PubMed] [Google Scholar]
- 29.Kuang D., Yao Y., Lam J., Tsushima R. G., Hampson D. R. (2005) J. Neurochem. 93, 383–391 [DOI] [PubMed] [Google Scholar]
- 30.Ma D., Wells J. W. (2004) Biotechnol. Lett. 26, 1441–1446 [DOI] [PubMed] [Google Scholar]
- 31.Jordan M., Schallhorn A., Wurm F. M. (1996) Nucleic Acids Res. 24, 596–601 [DOI] [PMC free article] [PubMed] [Google Scholar]
- 32.Chowdhury E. H., Sasagawa T., Nagaoka M., Kundu A. K., Akaike T. (2003) Anal. Biochem. 314, 316–318 [DOI] [PubMed] [Google Scholar]
- 33.Jordan M., Wurm F. (2004) Methods 33, 136–143 [DOI] [PubMed] [Google Scholar]
- 34.Conklin B. R., Farfel Z., Lustig K. D., Julius D., Bourne H. R. (1993) Nature 363, 274–276 [DOI] [PubMed] [Google Scholar]
- 35.Kuang D., Yao Y., Wang M., Pattabiraman N., Kotra L. P., Hampson D. R. (2003) J. Biol. Chem. 278, 42551–42559 [DOI] [PubMed] [Google Scholar]
- 36.Rasband W. S.ImageJ, Version 1.41k, National Institutes of Health, rsb.info.nih.gov/ij/, 1997–2007 [Google Scholar]
- 37.Raicu V., Jansma D. B., Miller R. J., Friesen J. D. (2005) Biochem. J. 385, 265–277 [DOI] [PMC free article] [PubMed] [Google Scholar]
- 38.Zimmermann T., Rietdorf J., Girod A., Georget V., Pepperkok R. (2002) FEBS Lett. 531, 245–249 [DOI] [PubMed] [Google Scholar]
- 39.Lakowicz J. R. (2006) Principles of Fluorescence Spectroscopy, 3rd Ed., pp.445–447, Springer-Verlag Inc., New York [Google Scholar]
- 40.Wells J. W. (1992) in Receptor-Ligand Interactions: A Practical Approach (Hulme E. C. ed) pp. 289–395, Oxford University Press, Oxford, UK [Google Scholar]
- 41.Gordon G. W., Berry G., Liang X. H., Levine B., Herman B. (1998) Biophys. J. 74, 2702–2713 [DOI] [PMC free article] [PubMed] [Google Scholar]
- 42.Skrabanek L., Campagne F., Weinstein H. (2003) Nucleic Acids Res. 31, 3856–3858 [DOI] [PMC free article] [PubMed] [Google Scholar]
- 43.Raicu V., Jansma D. B., Michalski K. (2006) in Proceedings of SPIE, Imaging, Manipulation, and Analysis of Biomolecules, Cells, and Tissues IV (Farkas D. L., Nicolau D. V., Leif R. C. eds) 60880A 60881–60880A 60889 [Google Scholar]
- 44.Dinant C., van Royen M. E., Vermeulen W., Houtsmuller A. B. (2008) J. Microsc. 231, 97–104 [DOI] [PubMed] [Google Scholar]
- 45.Adams S. R., Campbell R. E., Gross L. A., Martin B. R., Walkup G. K., Yao Y., Llopis J., Tsien R. Y. (2002) J. Am. Chem. Soc. 124, 6063–6076 [DOI] [PubMed] [Google Scholar]
- 46.Jordan B. A., Trapaidze N., Gomes I., Nivarthi R., Devi L. A. (2001) Proc. Natl. Acad. Sci. U.S.A. 98, 343–348 [DOI] [PMC free article] [PubMed] [Google Scholar]
- 47.Pathak A., Smih F., Galinier M., Verwaerde P., Rouet P., Philip-Couderc P., Montastruc J. L., Senard J. M. (2005) Int. J. Obes. 29, 176–182 [DOI] [PubMed] [Google Scholar]
- 48.Peterson G. L., Schimerlik M. I. (1984) Prep. Biochem. 14, 33–74 [DOI] [PubMed] [Google Scholar]
- 49.Mattera R., Pitts B. J., Entman M. L., Birnbaumer L. (1985) J. Biol. Chem. 260, 7410–7421 [PubMed] [Google Scholar]
- 50.Sum C. S., Pyo N., Wells J. W. (2001) Biochem. Pharmacol. 62, 829–851 [DOI] [PubMed] [Google Scholar]
- 51.Kaykas A., Yang-Snyder J., Héroux M., Shah K. V., Bouvier M., Moon R. T. (2004) Nat. Cell Biol. 6, 52–58 [DOI] [PubMed] [Google Scholar]
- 52.Berrie C. P., Birdsall N. J., Burgen A. S., Hulme E. C. (1979) Biochem. Biophys. Res. Commun. 87, 1000–1005 [DOI] [PubMed] [Google Scholar]
- 53.Chidiac P., Green M. A., Pawagi A. B., Wells J. W. (1997) Biochemistry 36, 7361–7379 [DOI] [PubMed] [Google Scholar]
- 54.Tota M. R., Kahler K. R., Schimerlik M. I. (1987) Biochemistry 26, 8175–8182 [DOI] [PubMed] [Google Scholar]
- 55.Shiozaki K., Haga T. (1992) Biochemistry 31, 10634–10642 [DOI] [PubMed] [Google Scholar]
- 56.Raicu V., Stoneman M. R., Fung R., Melnichuk M., Jansma D. B., Pisterzi L. F., Rath S., Fox M., Wells J. W., Saldin D. K. (2009) Nature Photonics 3, 107–113 [Google Scholar]
- 57.Liang Y., Fotiadis D., Filipek S., Saperstein D. A., Palczewski K., Engel A. (2003) J. Biol. Chem. 278, 21655–21662 [DOI] [PMC free article] [PubMed] [Google Scholar]
- 58.Fung J. J., Deupi X., Pardo L., Yao X. J., Velez-Ruiz G. A., Devree B. T., Sunahara R. K., Kobilka B. K. (2009) EMBO J. 28, 3315–3328 [DOI] [PMC free article] [PubMed] [Google Scholar]
- 59.Gazi L., López-Giménez J. F., Rüdiger M. P., Strange P. G. (2003) Eur. J. Biochem. 270, 3928–3938 [DOI] [PubMed] [Google Scholar]
- 60.Park P., Sum C. S., Hampson D. R., Van Tol H. H., Wells J. W. (2001) Eur. J. Pharmacol. 421, 11–22 [DOI] [PubMed] [Google Scholar]
- 61.Redka D. S., Pisterzi L. F., Wells J. W. (2008) Mol. Pharmacol. 74, 834–843 [DOI] [PubMed] [Google Scholar]
- 62.Dupré D. J., Robitaille M., Ethier N., Villeneuve L. R., Mamarbachi A. M., Hébert T. E. (2006) J. Biol. Chem. 281, 34561–34573 [DOI] [PubMed] [Google Scholar]
- 63.Dupré D. J., Baragli A., Rebois R. V., Ethier N., Hébert T. E. (2007) Cell. Signal. 19, 481–489 [DOI] [PubMed] [Google Scholar]
- 64.Dorsch S., Klotz K. N., Engelhardt S., Lohse M. J., Bünemann M. (2009) Nat. Methods 6, 225–230 [DOI] [PubMed] [Google Scholar]
- 65.Fonseca J. M., Lambert N. A. (2009) Mol. Pharmacol. 75, 1296–1299 [DOI] [PMC free article] [PubMed] [Google Scholar]
- 66.Whorton M. R., Bokoch M. P., Rasmussen S. G., Huang B., Zare R. N., Kobilka B., Sunahara R. K. (2007) Proc. Natl. Acad. Sci. U.S.A. 104, 7682–7687 [DOI] [PMC free article] [PubMed] [Google Scholar]
- 67.Kuszak A. J., Pitchiaya S., Anand J. P., Mosberg H. I., Walter N. G., Sunahara R. K. (2009) J. Biol. Chem. 284, 26732–26741 [DOI] [PMC free article] [PubMed] [Google Scholar]
- 68.Bayburt T. H., Leitz A. J., Xie G., Oprian D. D., Sligar S. G. (2007) J. Biol. Chem. 282, 14875–14881 [DOI] [PubMed] [Google Scholar]
- 69.Whorton M. R., Jastrzebska B., Park P. S., Fotiadis D., Engel A., Palczewski K., Sunahara R. K. (2008) J. Biol. Chem. 283, 4387–4394 [DOI] [PMC free article] [PubMed] [Google Scholar]
- 70.Green M. A., Chidiac P., Wells J. W. (1997) Biochemistry 36, 7380–7394 [DOI] [PubMed] [Google Scholar]
- 71.Birdsall N. J., Burgen A. S., Hulme E. C. (1977) Adv. Behav. Biol. 24, 25–33 [Google Scholar]
- 72.Ehlert F. J. (1985) Mol. Pharmacol. 28, 410–421 [PubMed] [Google Scholar]
- 73.Zeng F. Y., Wess J. (1999) J. Biol. Chem. 274, 19487–19497 [DOI] [PubMed] [Google Scholar]
Associated Data
This section collects any data citations, data availability statements, or supplementary materials included in this article.